
Author: BD Research Desk
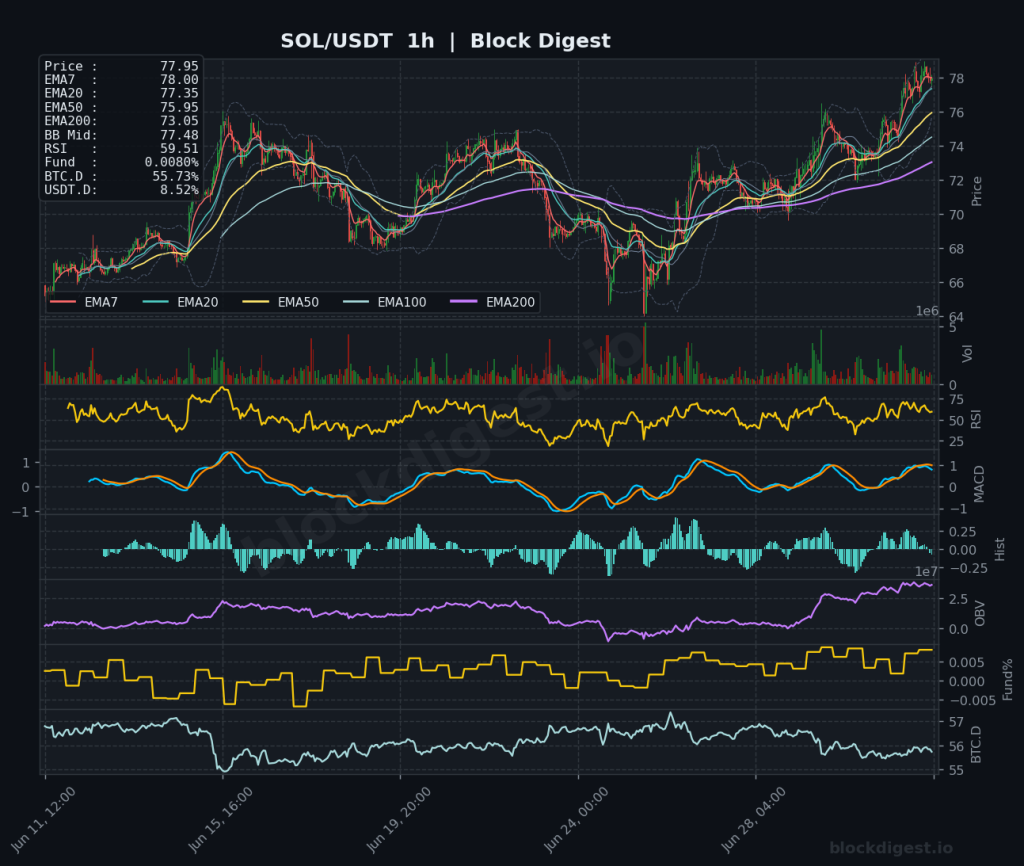
Altcoin Daily Analysis: BTC Dominance at 55.73% Suppresses Altcoin Outperformance
Market Context The broader altcoin market is navigating a cautiously recovering environment as of July 2, 2026, with BTC dominance sitting at approximately 55.73–55.76% — a level that continues to suppress meaningful altcoin outperformance on a relative basis. USDT dominance at 8.52% signals that a meaningful portion of capital remains parked on the sidelines, though...
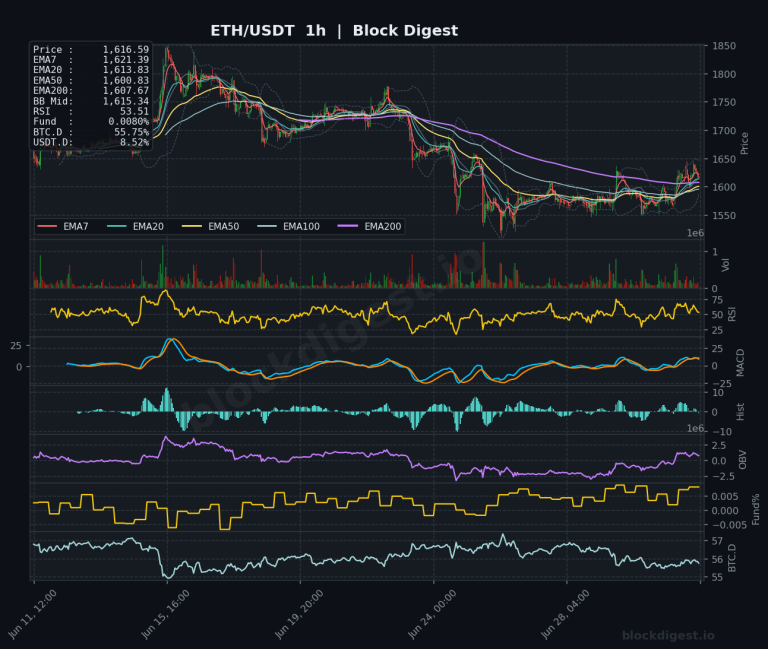
Ethereum Daily Analysis: Ethereum Below Key EMAs Amid Multi-Month Downtrend
Market Overview Ethereum is trading at $1,616.76 as of July 2, 2026, attempting a modest recovery after a prolonged multi-month downtrend that has seen price fall from highs above $4,000 on the daily chart. Price currently sits well below the daily EMA200 ($2,271.62), EMA50 ($1,807.37), and EMA20 ($1,658.20), confirming the dominant macro trend remains firmly...
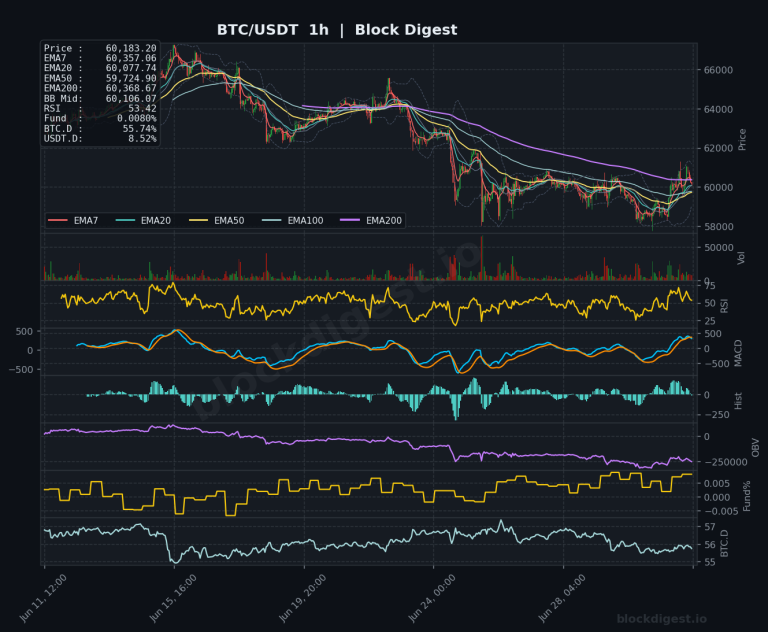
Bitcoin Daily Analysis: Bitcoin at $60K Below All Major EMAs
Market Overview Bitcoin is trading at approximately $60,185 as of July 2, 2026, navigating a structurally damaged macro environment following a decline of more than 50% from its October 2025 peak near $126,000. On the daily timeframe, price is currently sitting well below all major EMAs — the EMA20 at $61,992, EMA50 at $66,116, EMA200...
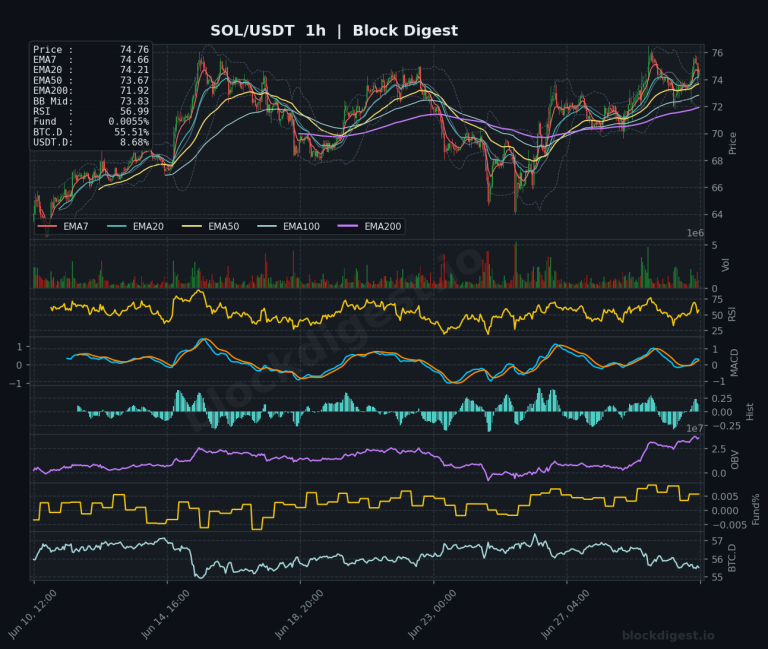
Altcoin Daily Analysis: Bitcoin Dominance 55.5% Amid Risk-Off Positioning
Market Context Bitcoin dominance sits at approximately 55.51–55.53% across the altcoin pairs analyzed, reflecting a market environment where capital continues to favor BTC over the broader altcoin space. USDT.D at 8.68% remains elevated, signaling persistent risk-off positioning among participants and limited appetite for aggressive altcoin accumulation. The combination of high BTC dominance and elevated stablecoin...
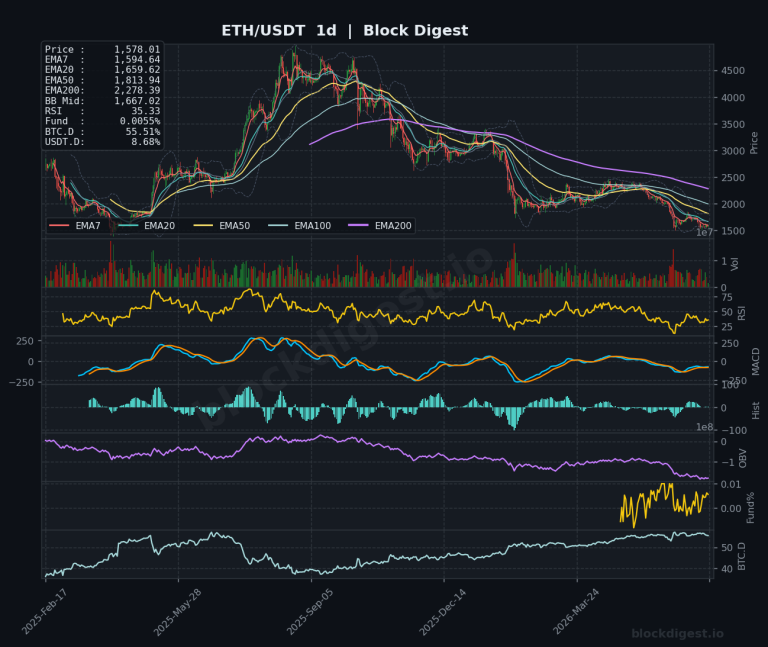
Ethereum Monthly Analysis: Ethereum at $1,578 Below Key Moving Averages
Macro Market Overview Ethereum enters July 2026 trading at $1,578, a price level that paints a sobering picture of the current macro environment. The monthly candle structure reveals a prolonged distribution and markdown phase that has been unfolding since the local cycle highs near $4,000 established in late 2024, with price now having surrendered well...
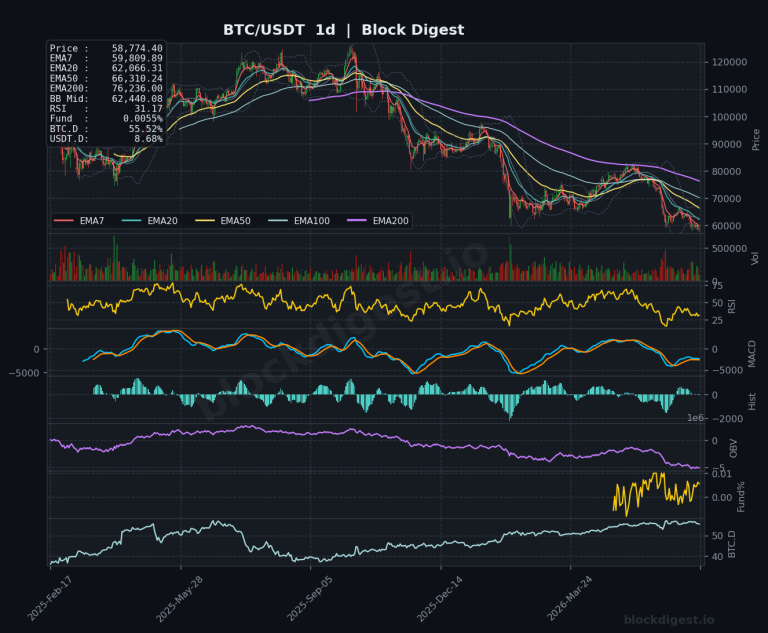
Bitcoin Monthly Analysis: Bitcoin Below EMA7 and EMA20, 46% From Peak
Macro Market Overview Bitcoin enters July 2026 trading around $58,773, firmly below both the monthly EMA7 ($70,112) and EMA20 ($77,801), a bearish structural configuration that signals a meaningful shift in the macro trend following the cycle peak established near $109,000. The June monthly candle is printing as a notable red close, extending what is now...
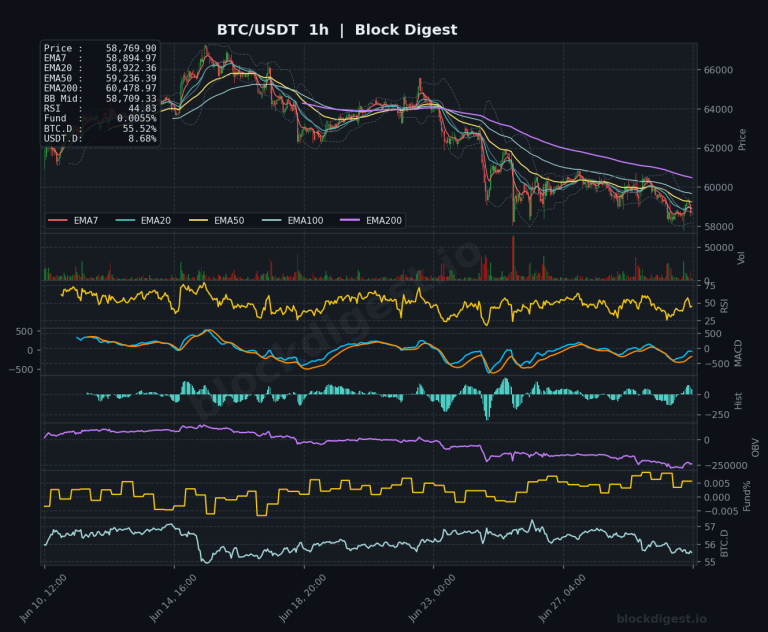
Bitcoin Daily Analysis: BTC Below All EMAs at $58,774 Resistance
Market Overview BTC/USDT is currently trading at $58,774–$58,778, sitting below all major EMAs across every timeframe — a structurally bearish configuration. On the daily chart, price has failed to reclaim the EMA7 ($59,809) and trades well beneath the EMA20 ($62,066), EMA50 ($66,310), and EMA200 ($76,236), confirming a sustained downtrend from the cycle highs. The Bollinger...
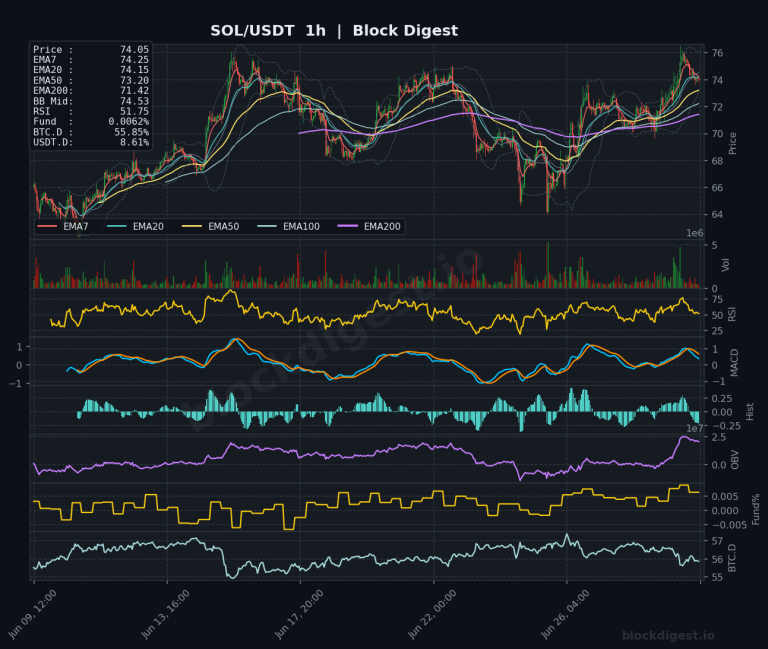
Altcoin Daily Analysis: BTC Dominance at 55.85% Suppresses Altcoin Rotation
Market Context The broader altcoin market is trading under notable pressure heading into the close of June 2026, with BTC dominance holding at 55.85% — a level that continues to suppress meaningful capital rotation into altcoins. USDT dominance at 8.61% signals that a significant proportion of market participants remain in cash or stablecoins, reflecting cautious...
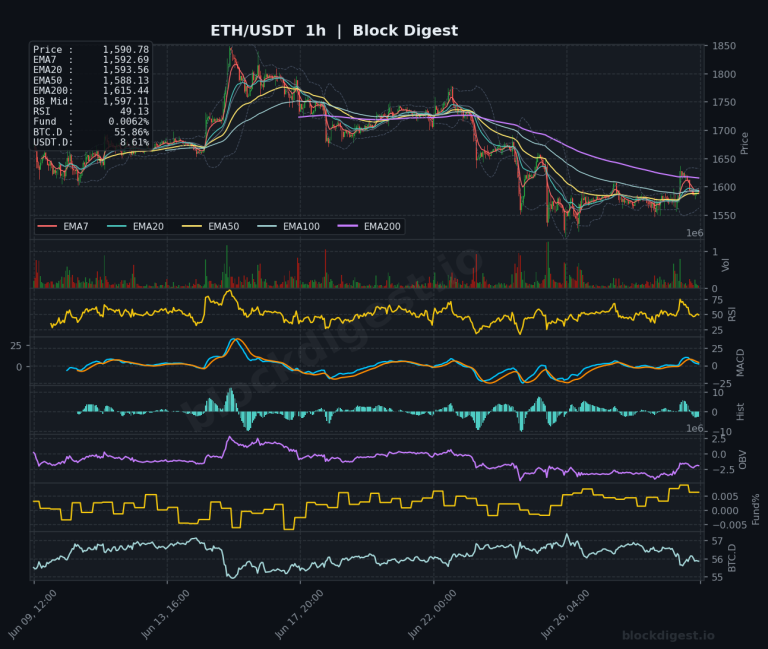
Ethereum Daily Analysis: ETH drops below key EMAs amid prolonged downtrend
Market Overview ETH/USDT is currently trading at $1,590.78, caught in a pronounced downtrend that has persisted across multiple timeframes. On the daily chart, price sits well below all major EMAs — the EMA7 at $1,605.04, EMA20 at $1,670.06, EMA50 at $1,824.33, and EMA200 at $2,285.05 — confirming a deeply bearish macro structure. The Bollinger Band...
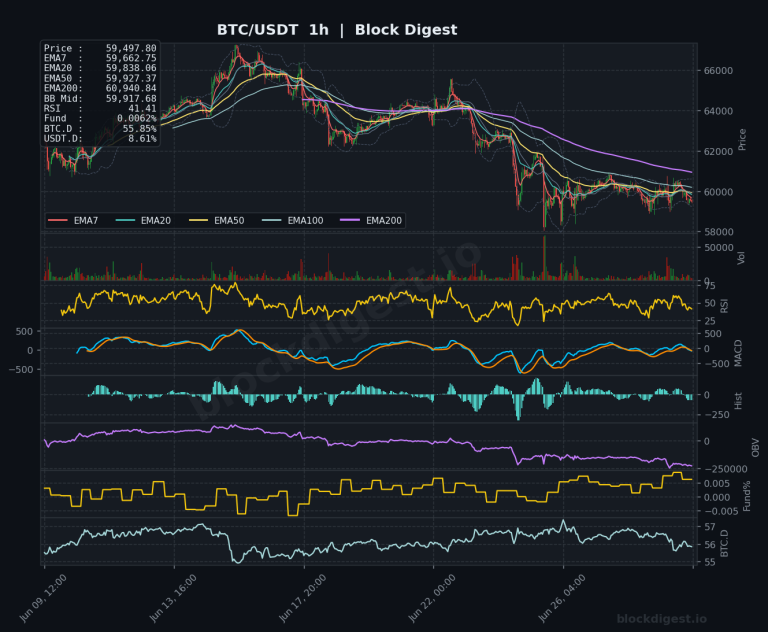
Bitcoin Daily Analysis: Bitcoin Below All EMAs at $59,497
Market Overview Bitcoin is currently trading at $59,497.80, firmly below all major exponential moving averages across every timeframe — a structurally bearish configuration. On the daily chart, price is well beneath the EMA7 ($60,378), EMA20 ($62,497), EMA50 ($66,652), and the distant EMA200 ($76,422), confirming a sustained downtrend from the highs set earlier in the cycle....
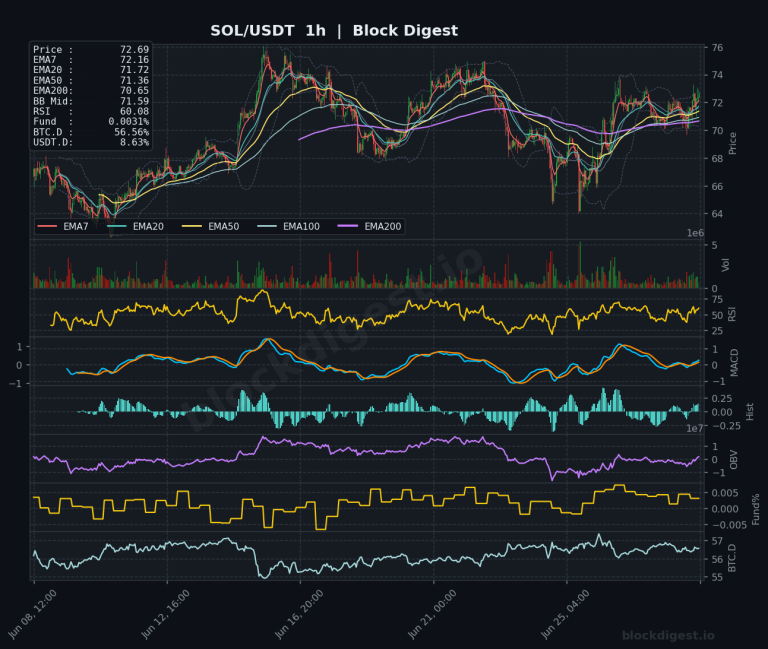
Altcoin Daily Analysis: BTC Dominance at 56.56% Pressures Altcoins
Market Context Bitcoin dominance sits at approximately 56.56% as of June 29, 2026, reflecting a market environment where capital continues to favor BTC over the broader altcoin field — a headwind for sustained altcoin rallies. USDT dominance at 8.63% remains elevated, indicating that a meaningful portion of sidelined capital has yet to rotate back into...
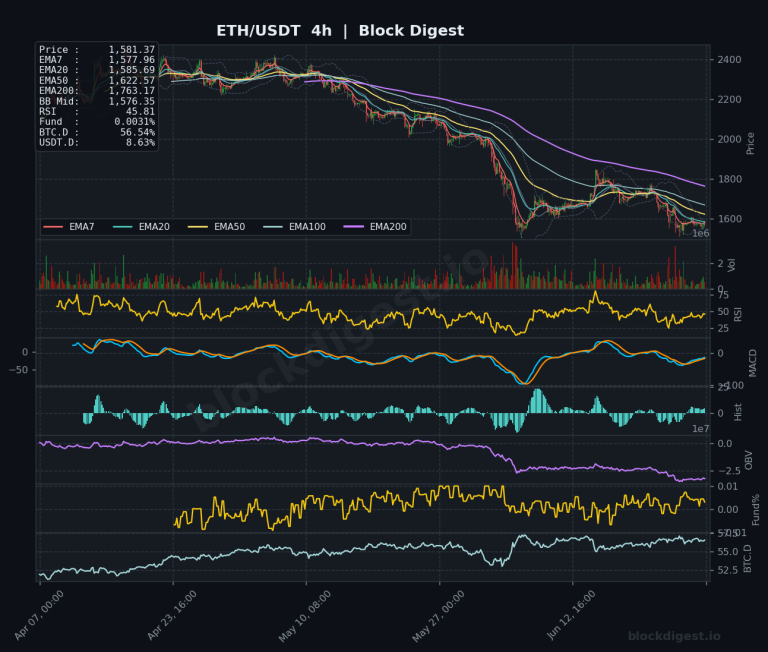
Ethereum Weekly Analysis: ETH Slides to $1,581 Amid Multi-Year Lows
Weekly Market Overview ETH/USDT closed the week ending June 29, 2026 at $1,581.37, continuing a protracted multi-month downtrend that has seen price shed well over 60% from its 2025 highs near $4,500. The weekly candle structure remains decisively bearish, with price printing fresh multi-year lows and finding no meaningful support on the descent. The broader...