
Market Context
Bitcoin dominance sits at approximately 55.51–55.53% across the altcoin pairs analyzed, reflecting a market environment where capital continues to favor BTC over the broader altcoin space. USDT.D at 8.68% remains elevated, signaling persistent risk-off positioning among participants and limited appetite for aggressive altcoin accumulation. The combination of high BTC dominance and elevated stablecoin dominance paints a cautious macro backdrop heading into July 2026, with most large-cap altcoins struggling to establish meaningful recovery momentum.
Solana (SOL)
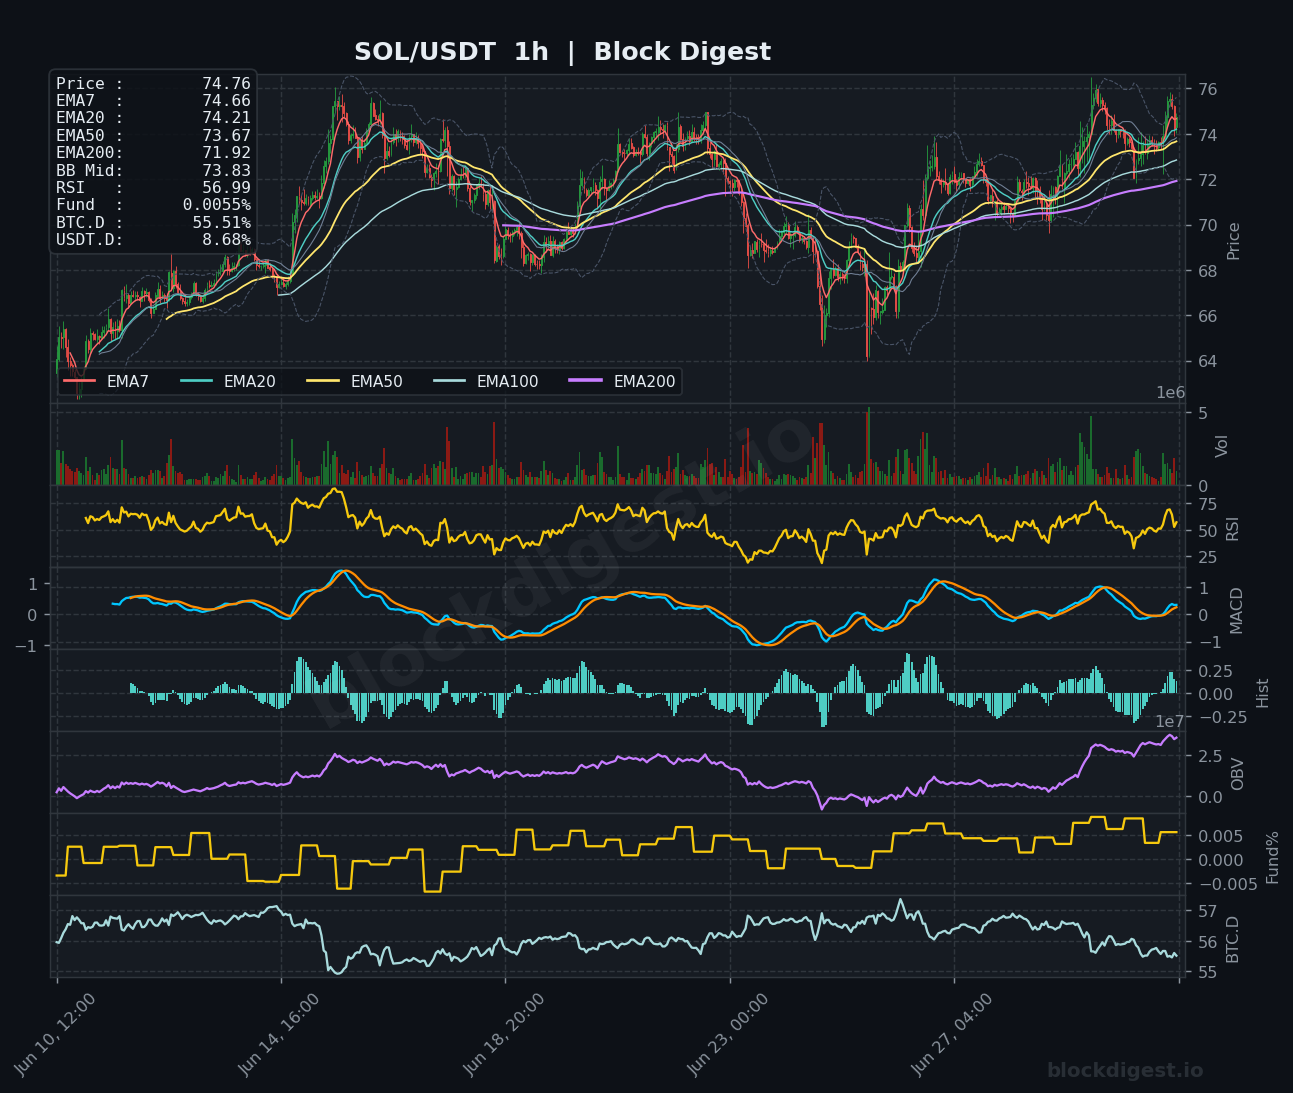
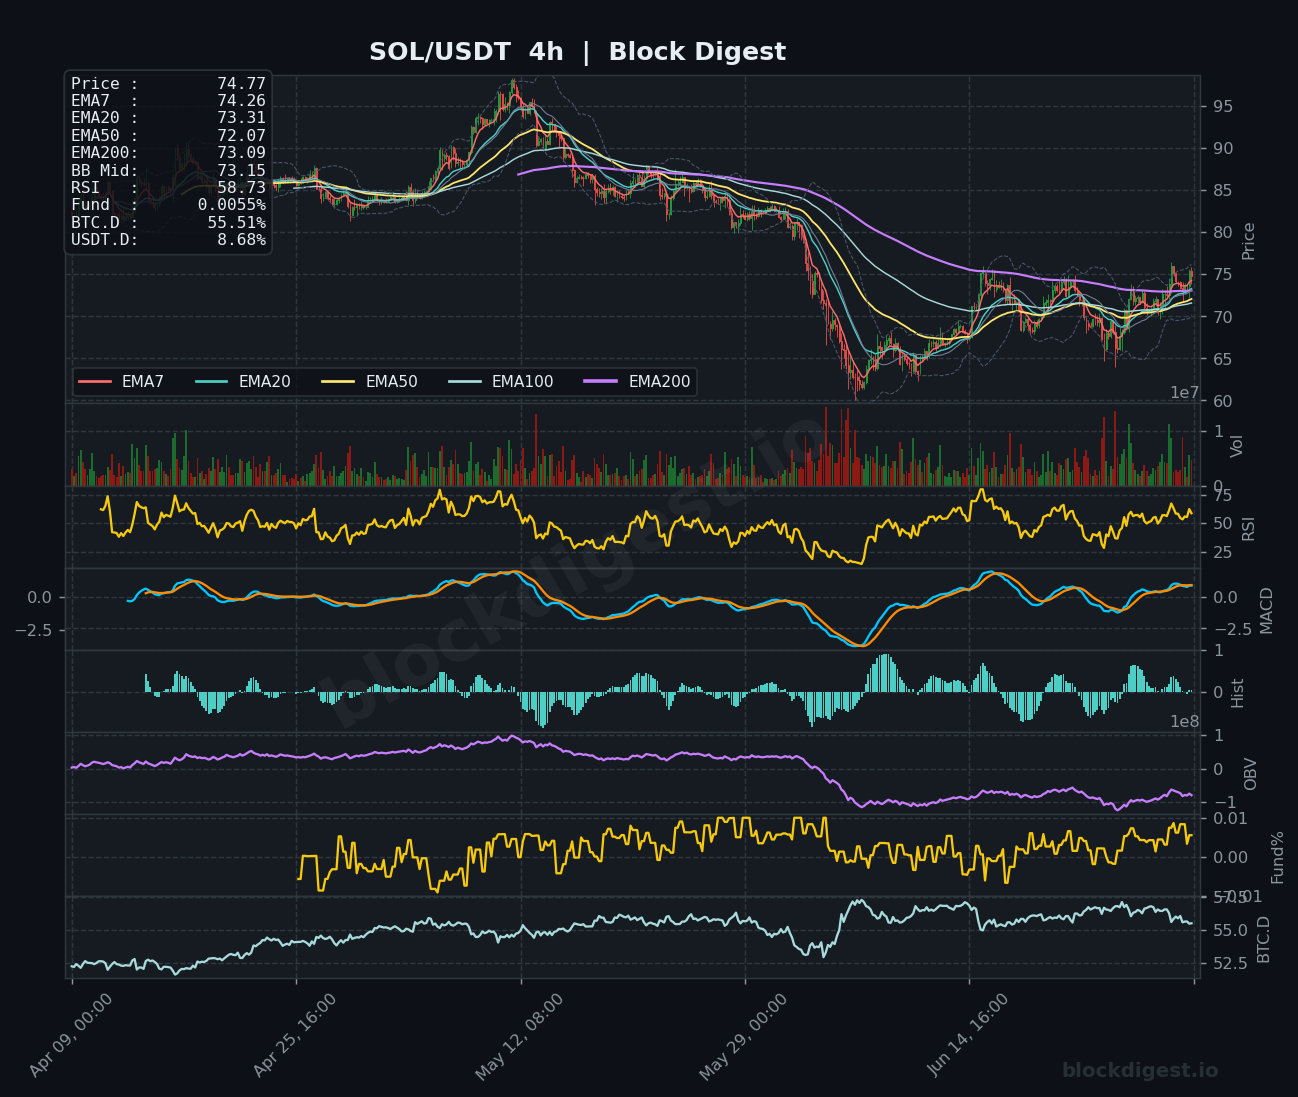
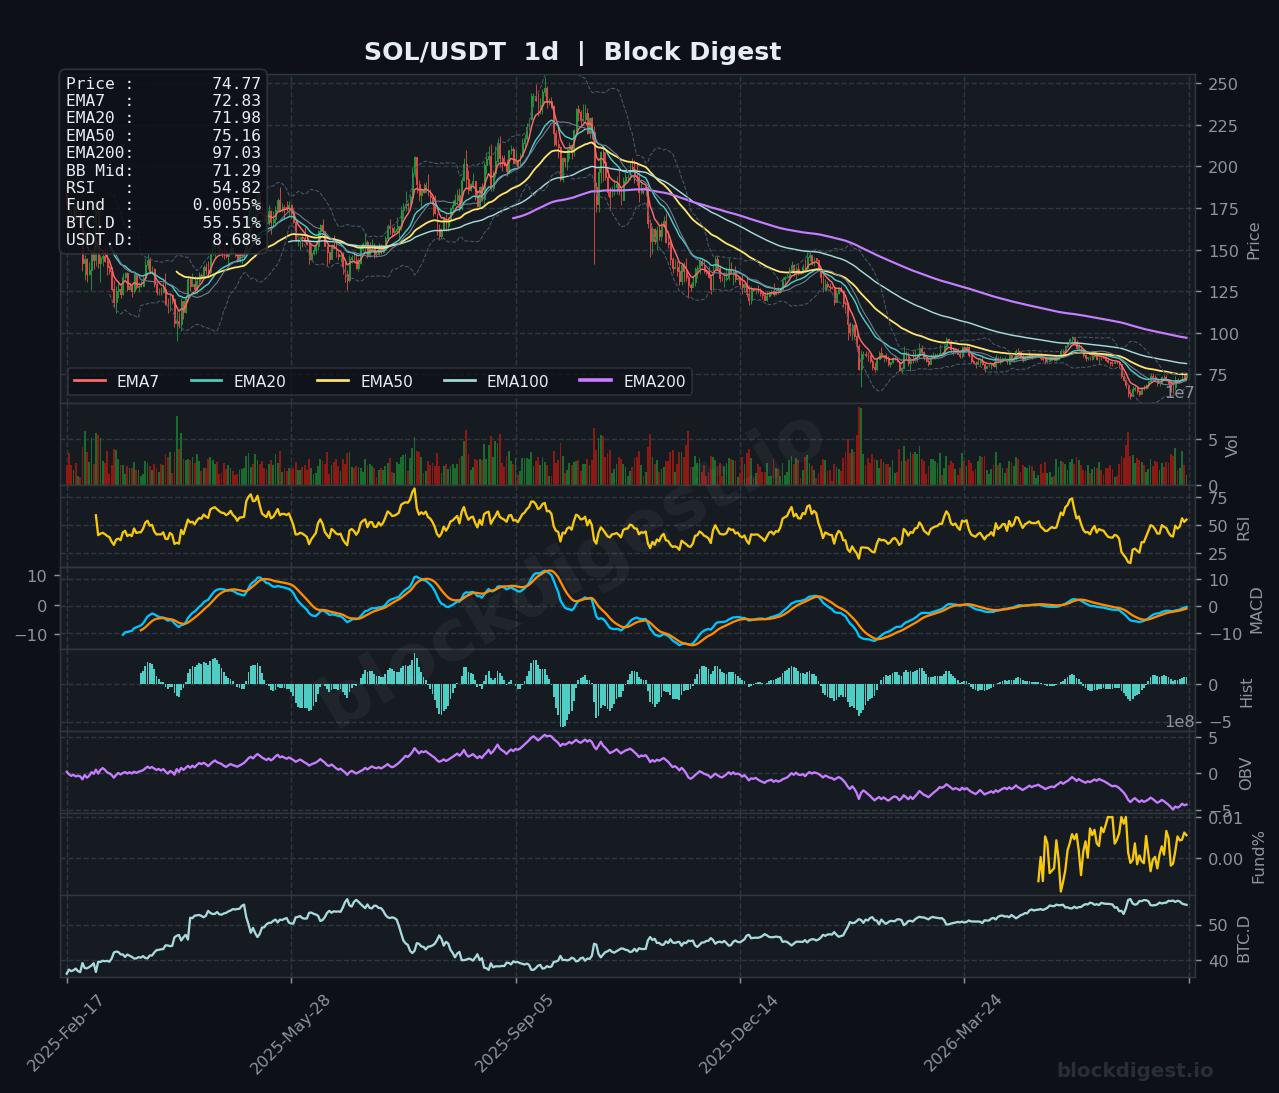
SOL is trading at $74.77, having staged a notable intraday recovery from lows near $64–65 seen in recent weeks, and is currently reclaiming all short-term EMAs on the 1h chart with the EMA7 at $74.66 and EMA20 at $74.21 providing immediate support. On the 4h timeframe, price is consolidating just above the EMA7 ($74.26) but remains well below the EMA200 ($73.09 on 4h), and the daily chart shows SOL still trading beneath its descending EMA50 at $75.16, which now acts as key overhead resistance. The 1h RSI at 56.99 and 4h RSI at 58.73 suggest recovering momentum without being overextended, while the OBV on the 1h has turned sharply higher, indicating genuine buying interest in the recent bounce. The daily RSI at 54.82 and a MACD beginning to flatten near zero on the daily suggest a tentative recovery attempt, but SOL needs a clean break above $75.16–$76.00 to shift its short-term bias from neutral to bullish.
XRP (XRP)
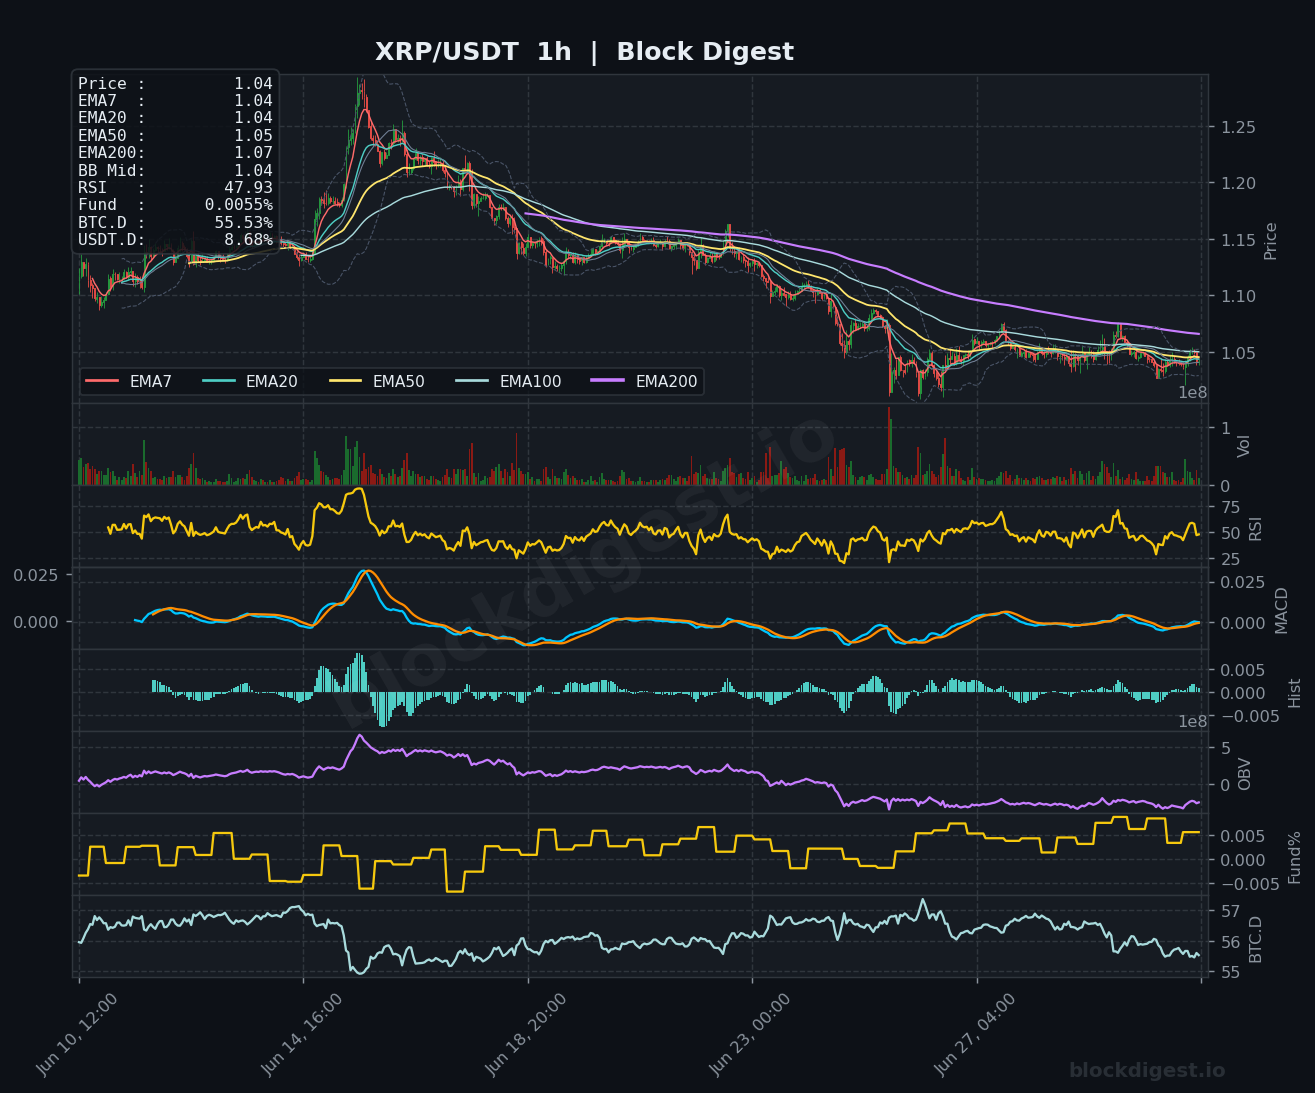
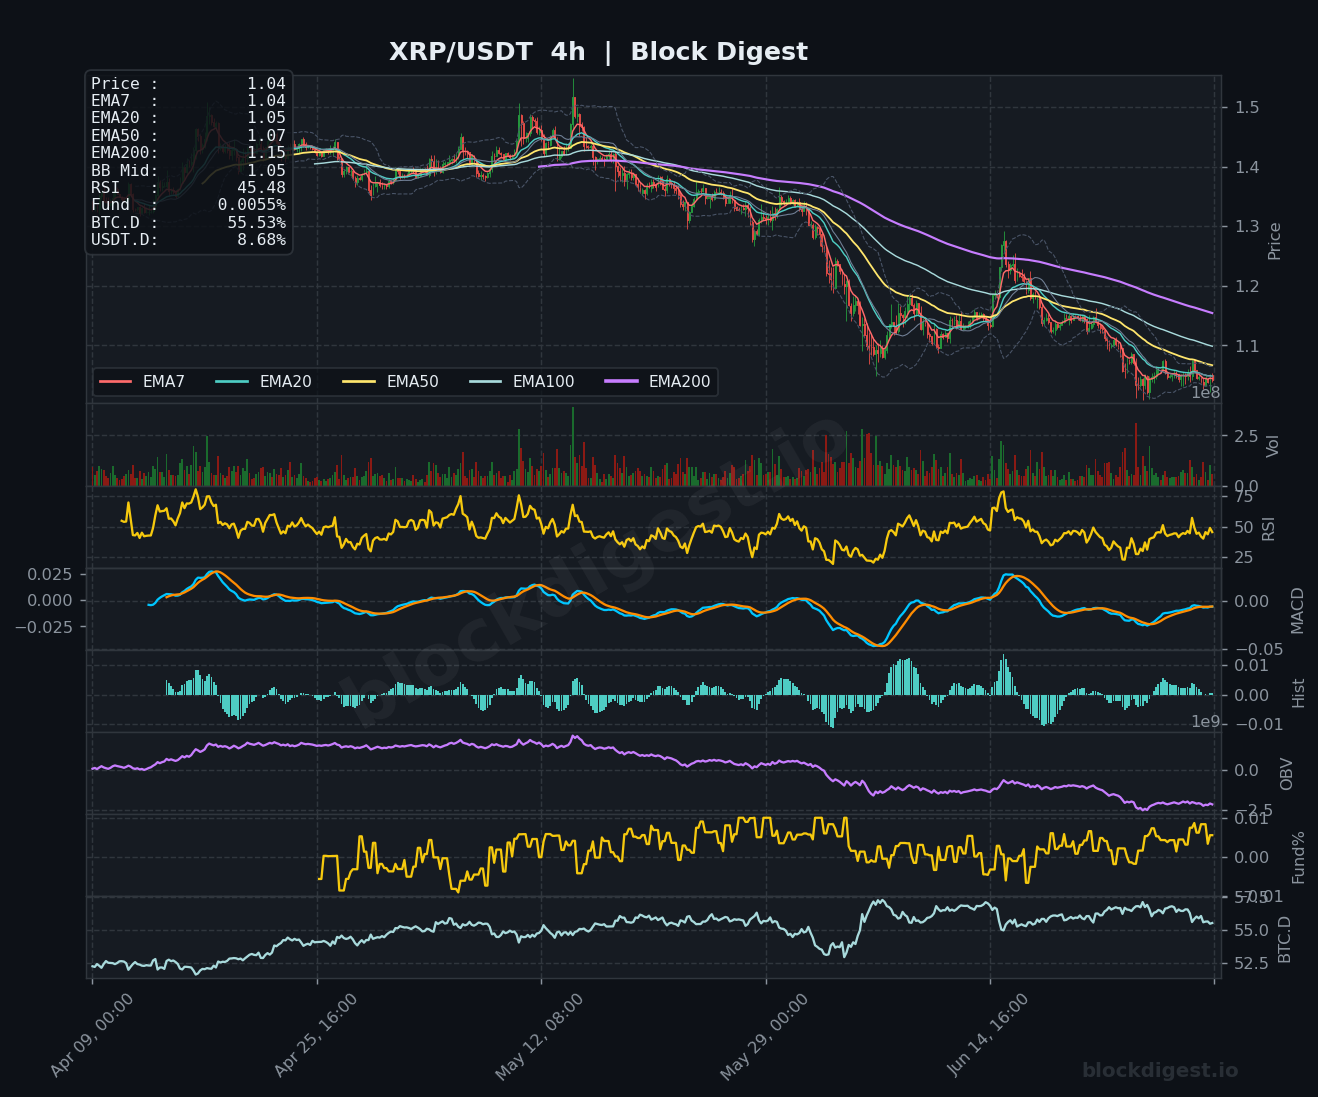
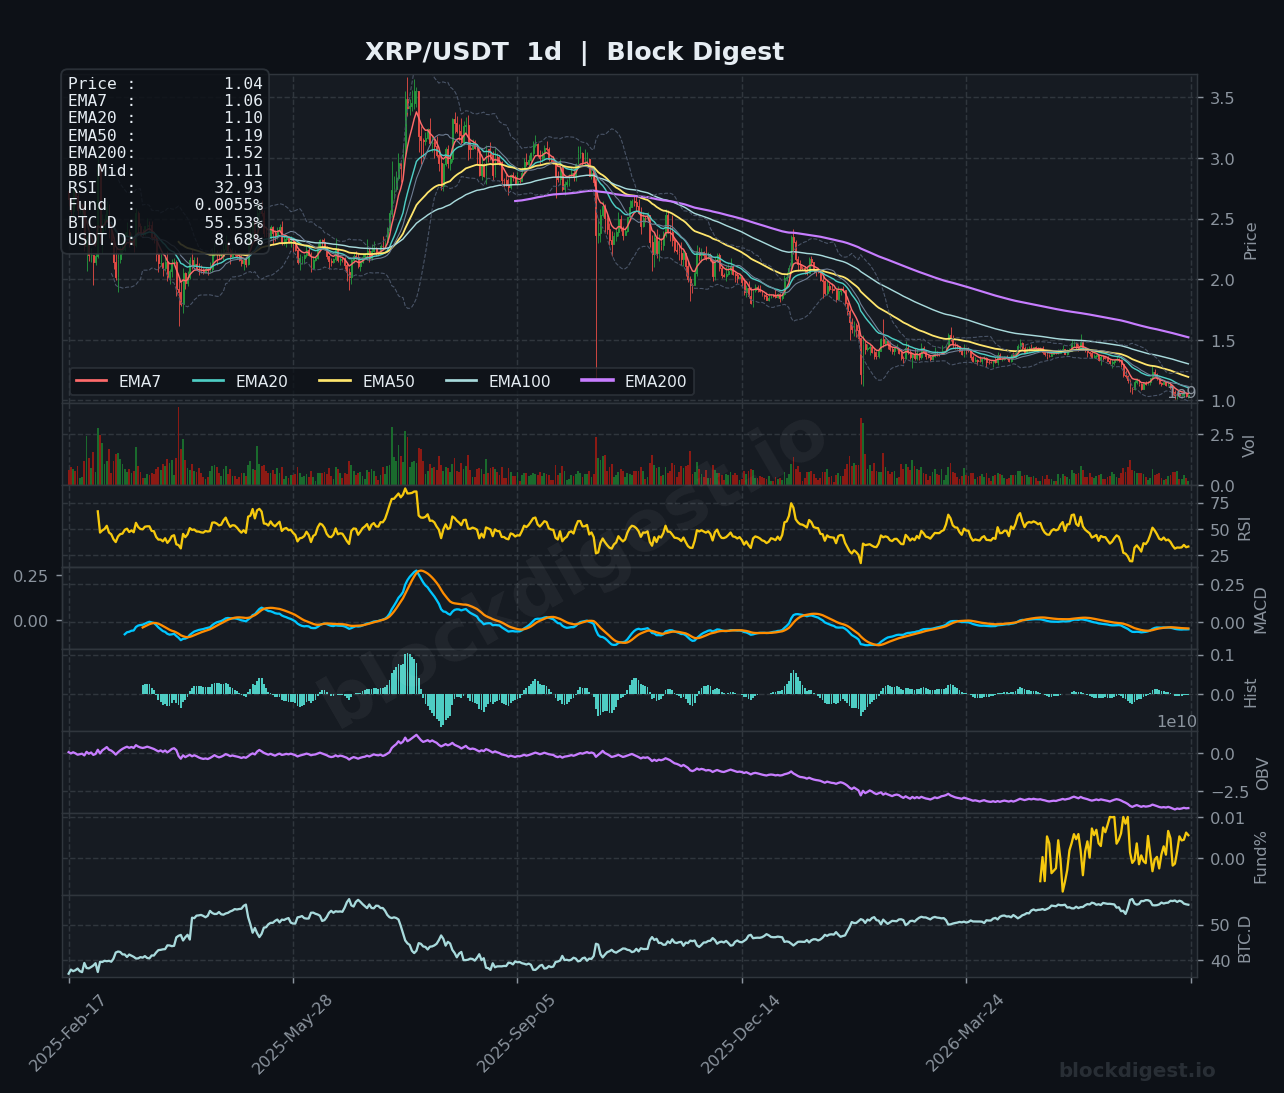
XRP is trading at $1.04, having experienced a sustained multi-week downtrend from highs above $3.50 on the daily chart, with price now compressing near the lower Bollinger Band and struggling to find footing above the $1.05 EMA50 on the 1h timeframe. The 4h RSI at 45.48 and daily RSI at a deeply depressed 32.93 indicate that XRP is approaching oversold territory on the higher timeframes, though no confirmed reversal signal has materialized yet. The 4h MACD remains in negative territory with a slight curl upward near zero, and the daily OBV continues to trend lower, reflecting persistent net distribution. Key support sits at the psychological $1.00 level, while overhead resistance is clustered between $1.05–$1.10; a bounce is plausible given oversold daily conditions, but the bias remains bearish until XRP can reclaim the $1.10–$1.15 range with volume.
BNB (BNB)
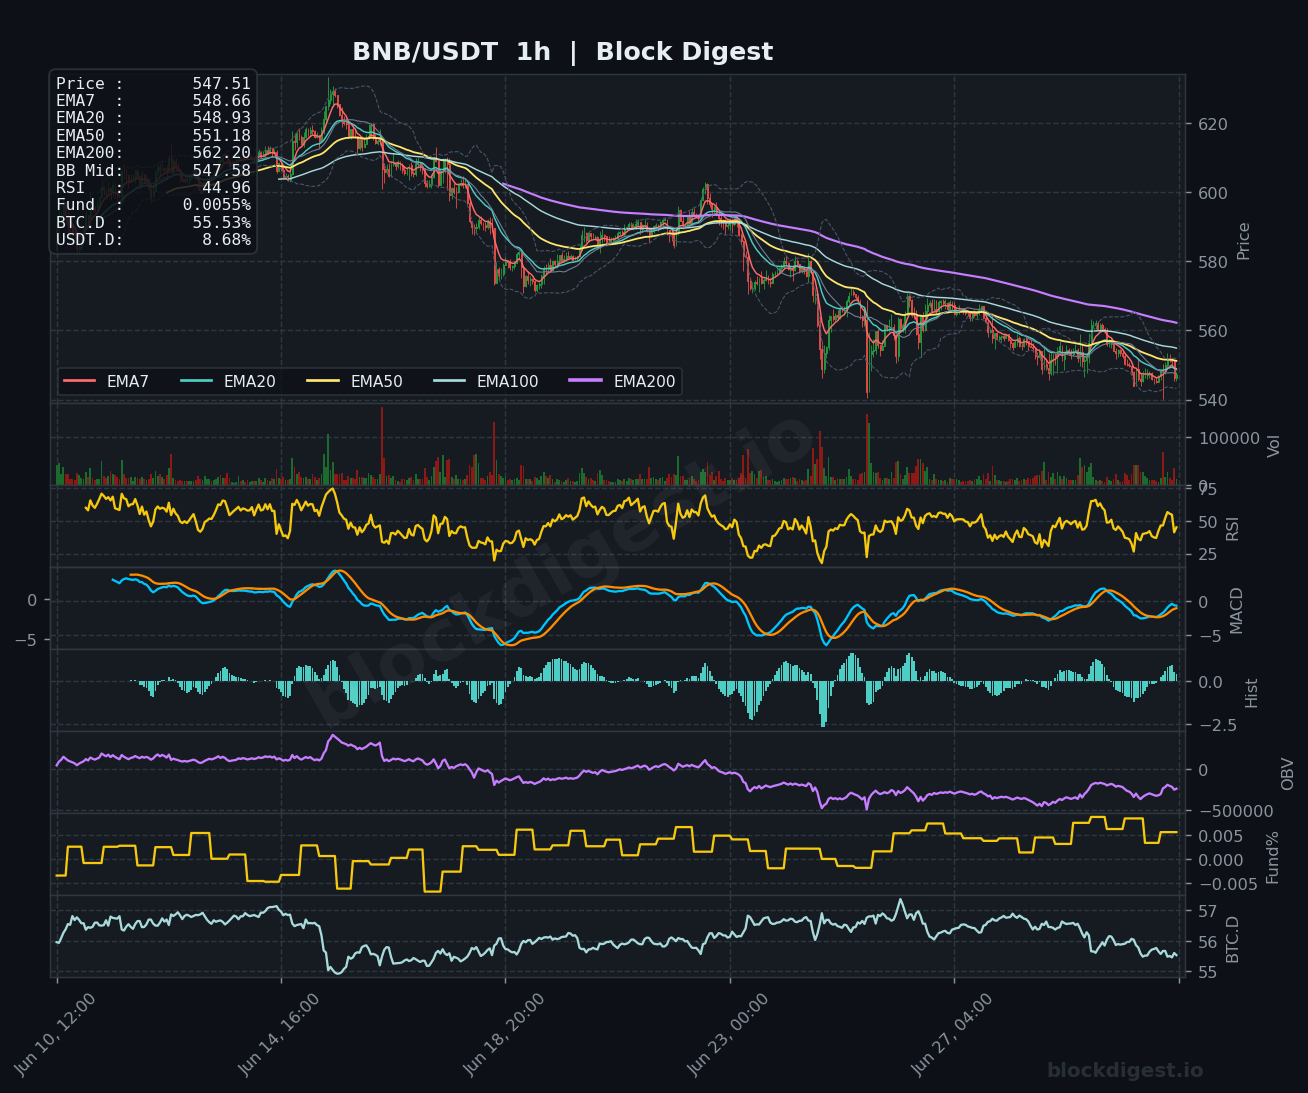
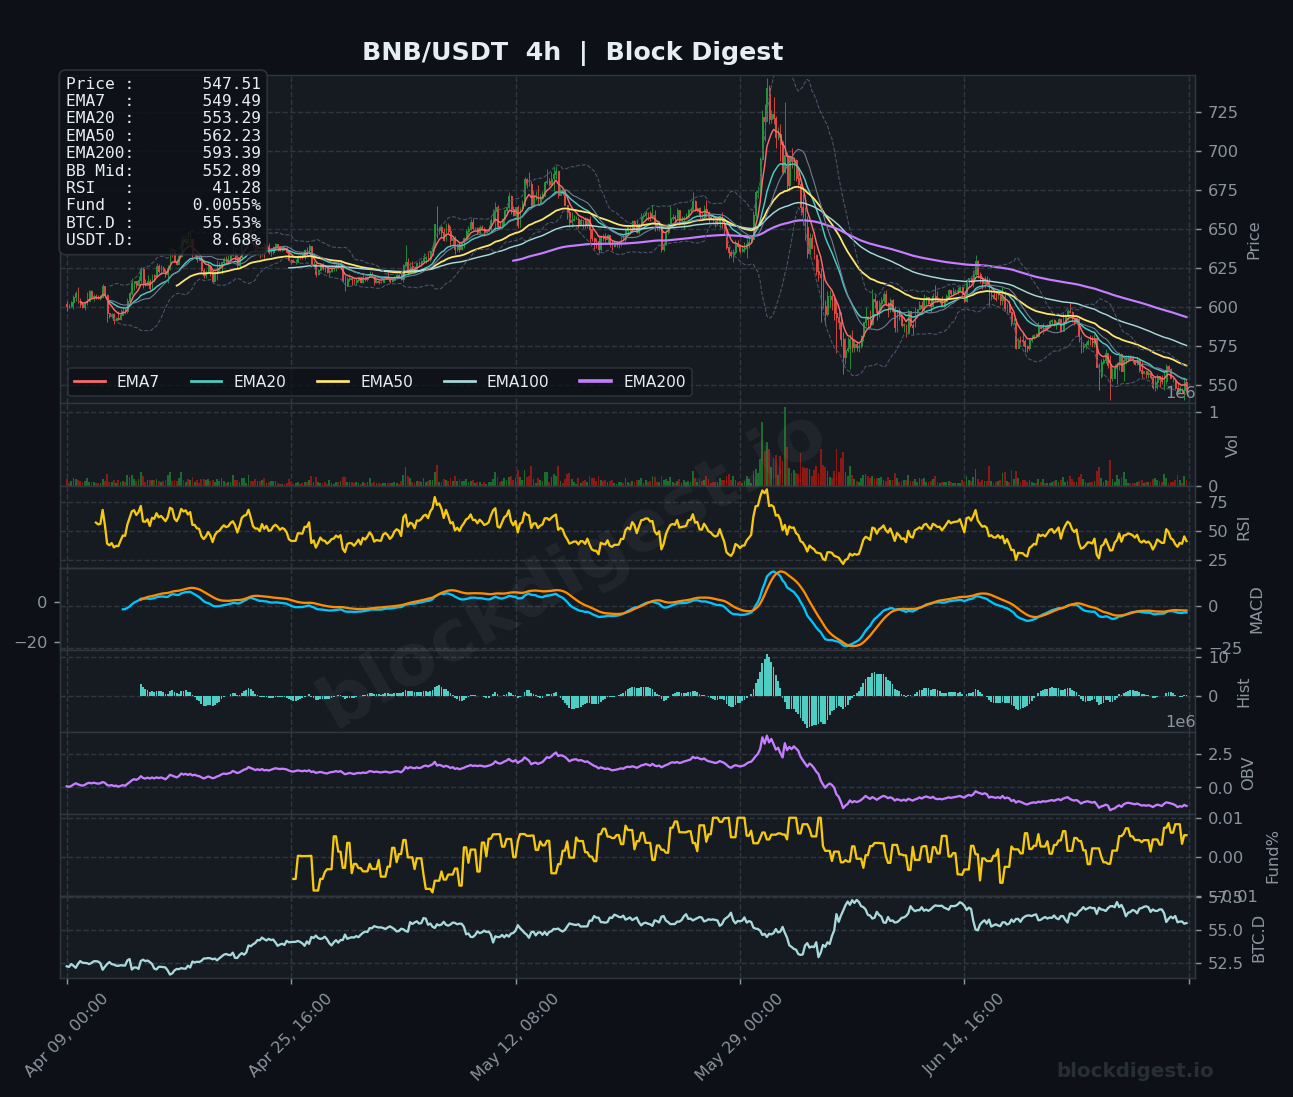
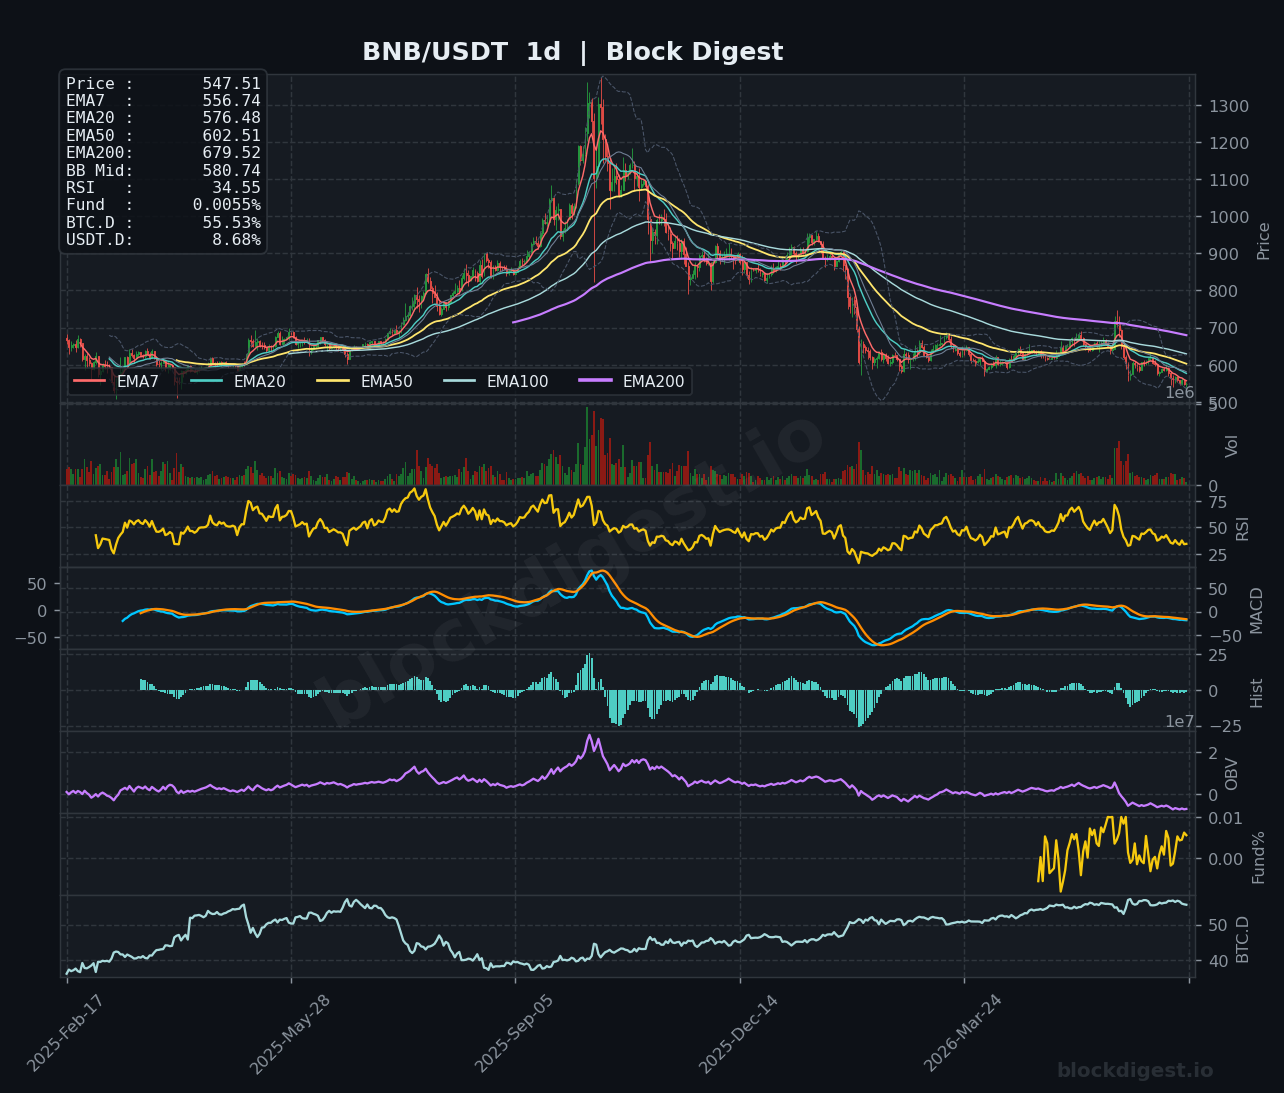
BNB is trading at $547.51, under significant pressure from all major EMAs on both the 1h and 4h frames — the EMA200 on the daily stands at $679.52, illustrating the magnitude of the broader downtrend from peak levels above $750. On the 1h chart, RSI reads 44.96 and MACD is hovering just below the zero line, indicating weak and consolidating momentum without directional conviction. The 4h RSI at 41.28 and daily RSI at 34.55 confirm that BNB is in bearish territory across all key timeframes, with the OBV on both daily and 4h frames declining steadily — a sign that sellers remain in control of the order flow. Immediate support is identified around $540–$545, and a failure to hold that zone could expose $520; resistance on the upside is stiff at the $560–$565 area where the EMA50 and EMA100 on the 1h converge.
Dogecoin (DOGE)
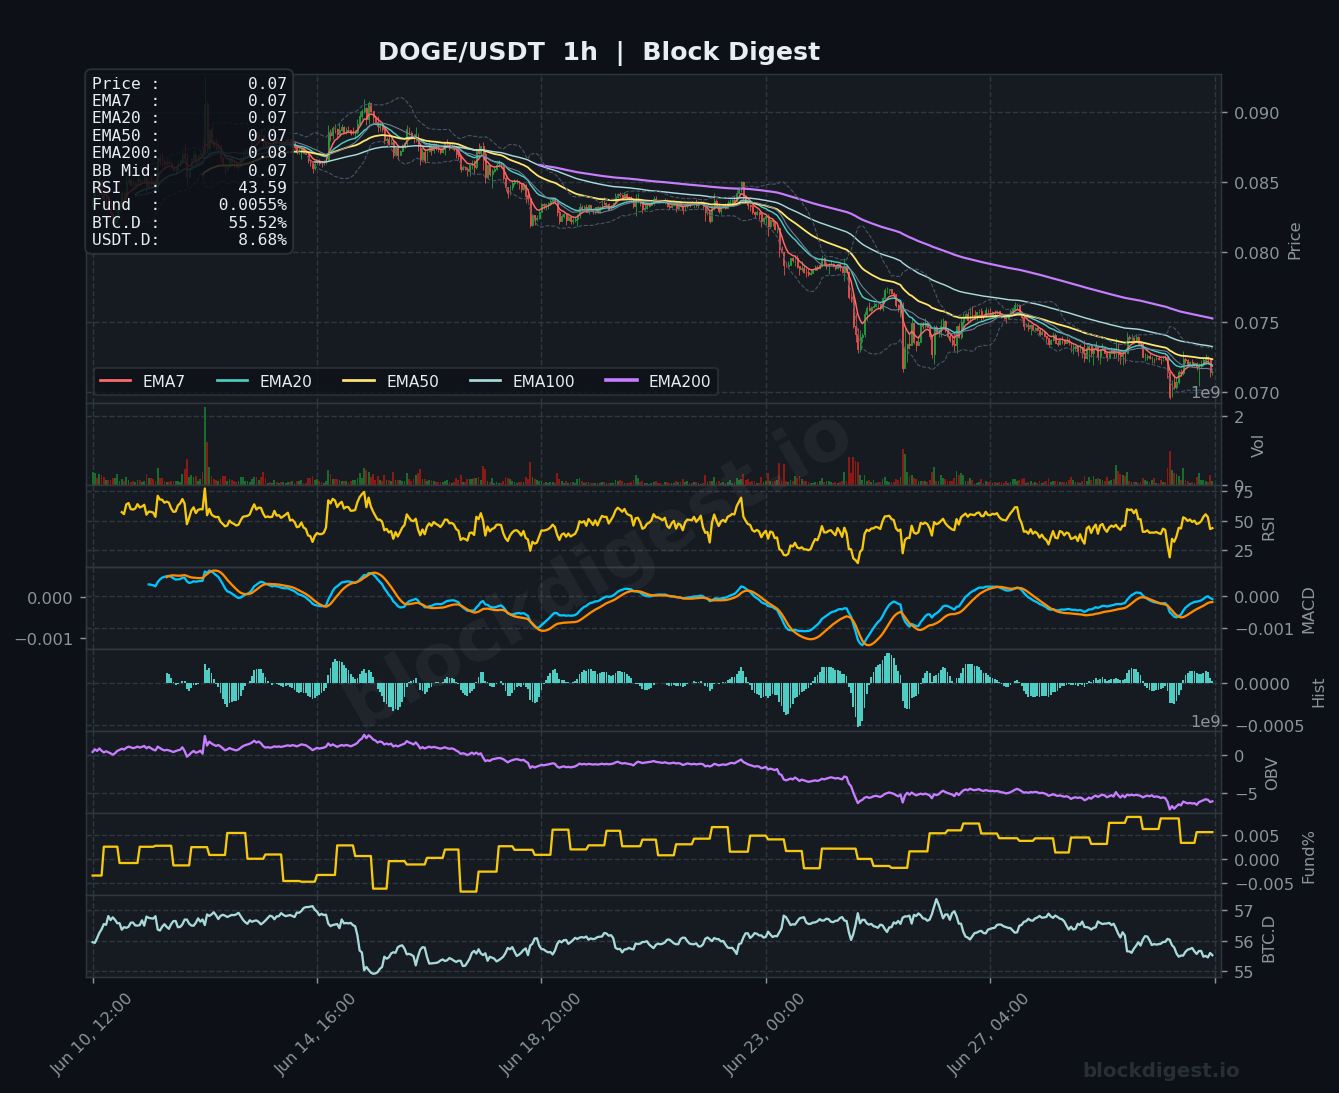
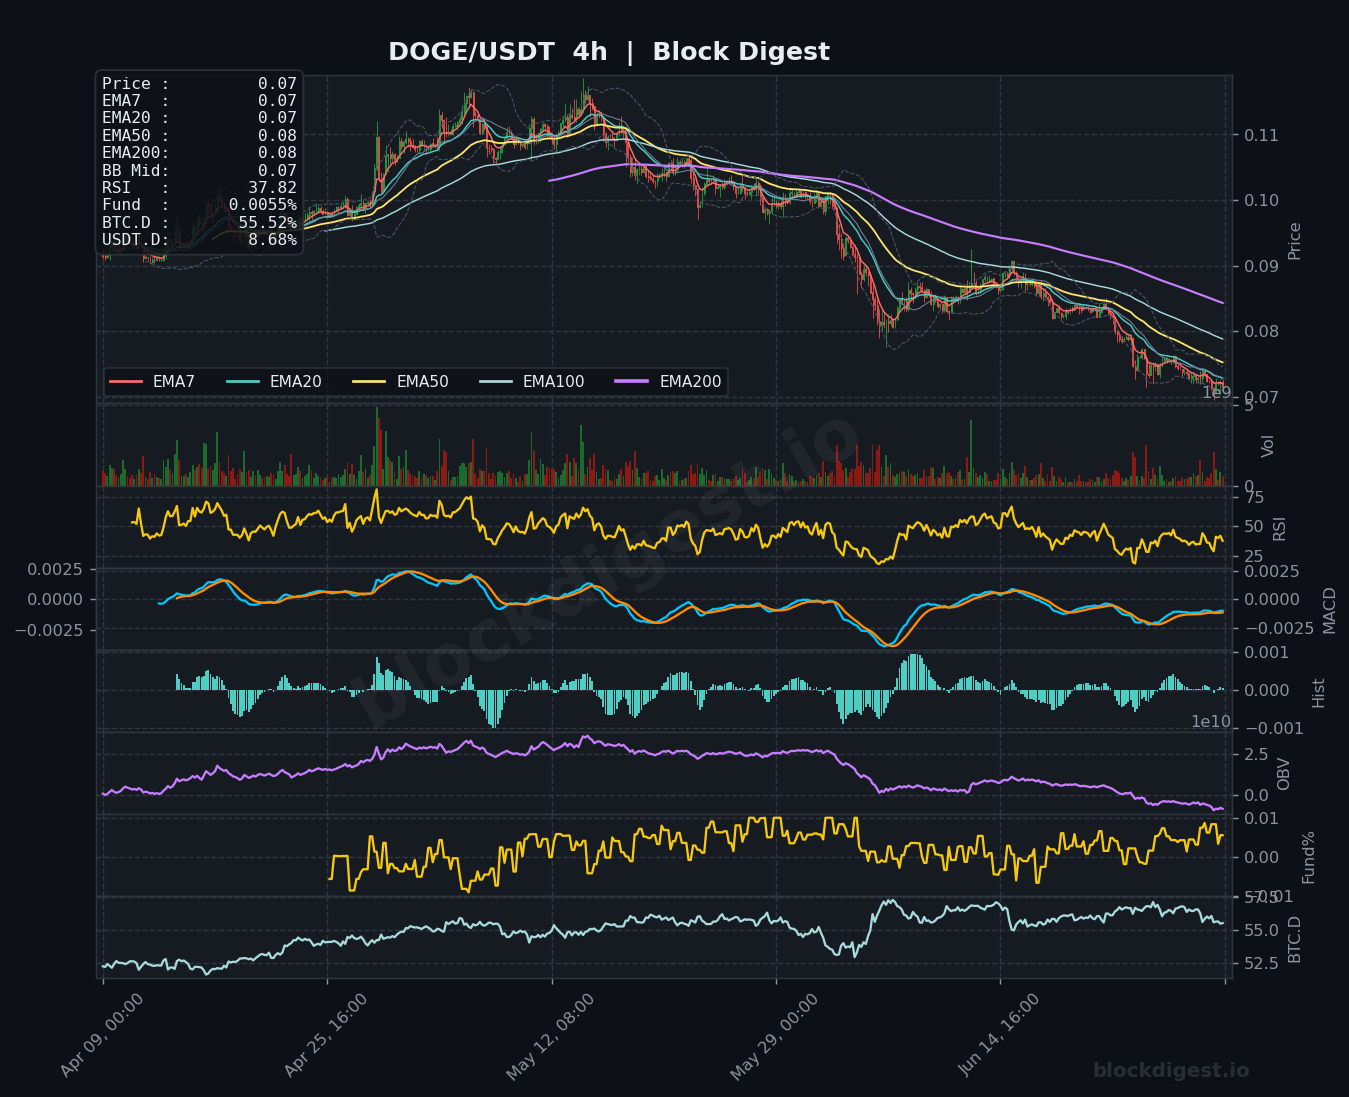
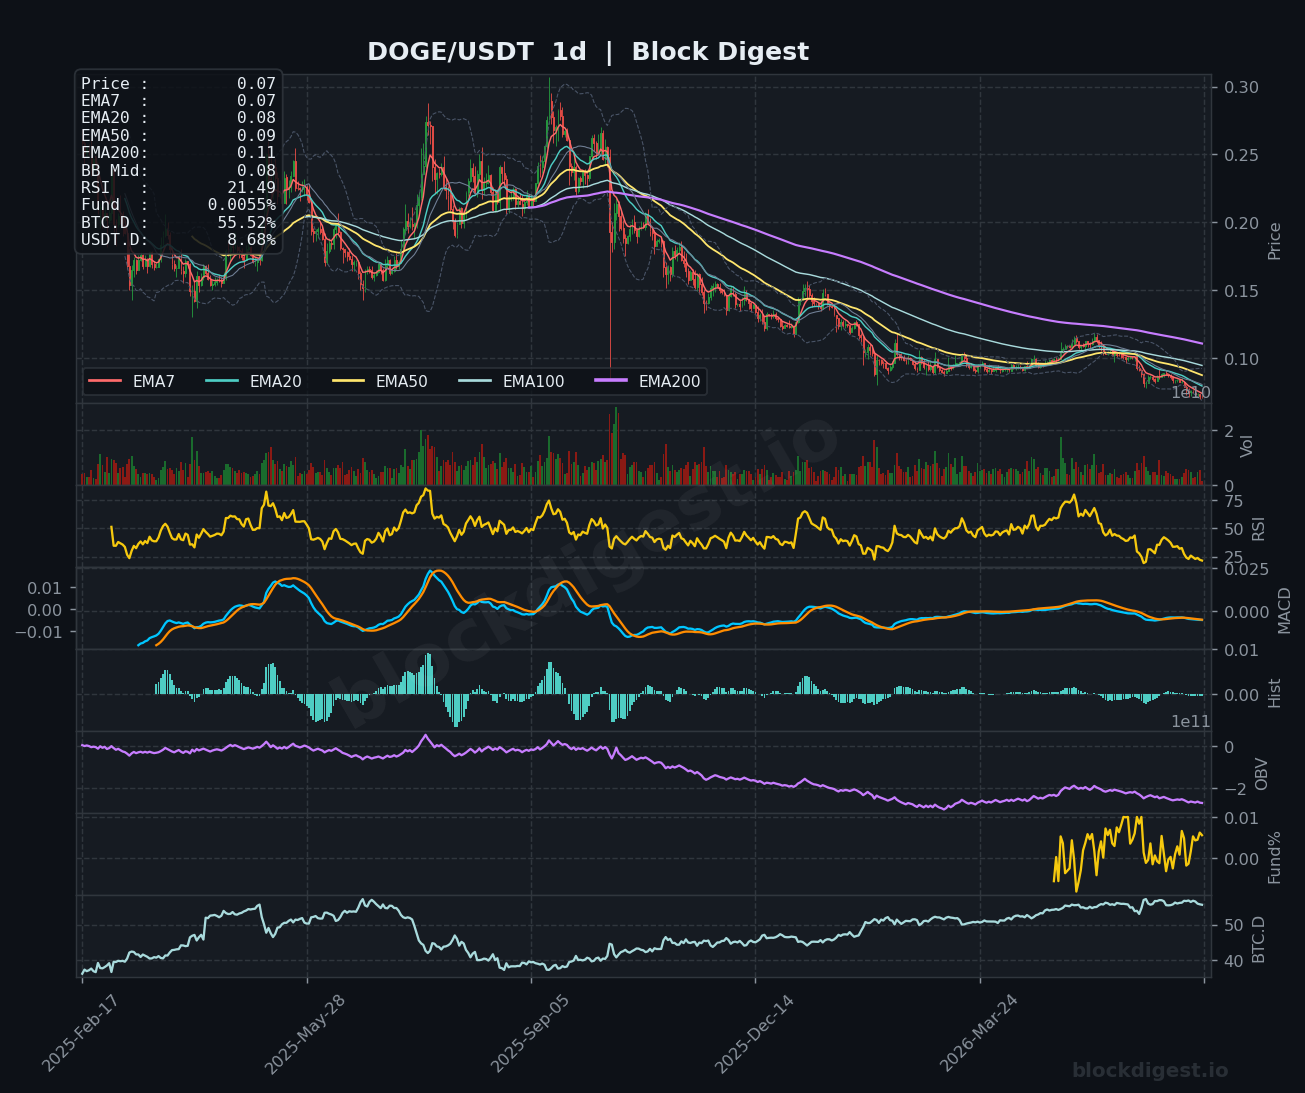
DOGE is trading at $0.07, deep in a structural downtrend that has seen the token shed the majority of its value from highs above $0.28 on the daily chart, with all EMAs on the daily and 4h frames stacked bearishly above the current price. The daily RSI at 21.49 is firmly in oversold territory — the most extreme reading of any coin in this roundup — suggesting that a technical relief bounce could develop, though oversold conditions alone are not sufficient to signal a bottom. On the 4h chart, RSI sits at 37.82 with a MACD that is attempting to flatten near zero after a deep trough, offering a faint glimmer of potential stabilization. Key support lies at the $0.068–$0.070 zone, and DOGE must convincingly reclaim $0.075 on the 4h to suggest any near-term relief; the bias remains firmly bearish with any bounce likely to face stiff selling pressure at the EMA20 ($0.08) and EMA50 ($0.09) levels.
Litecoin (LTC)
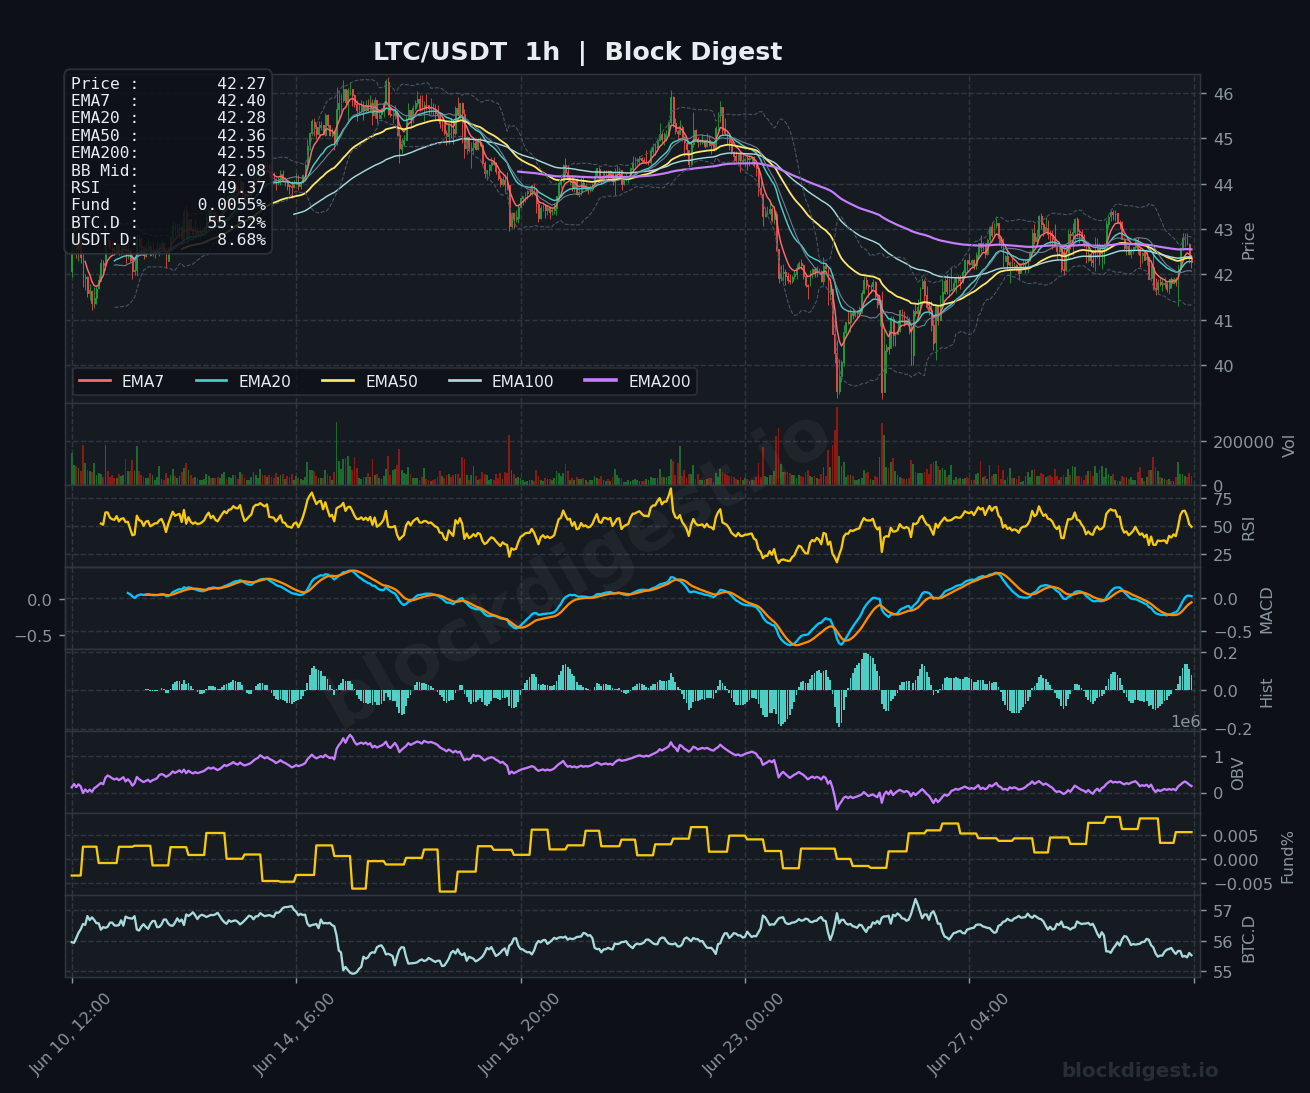
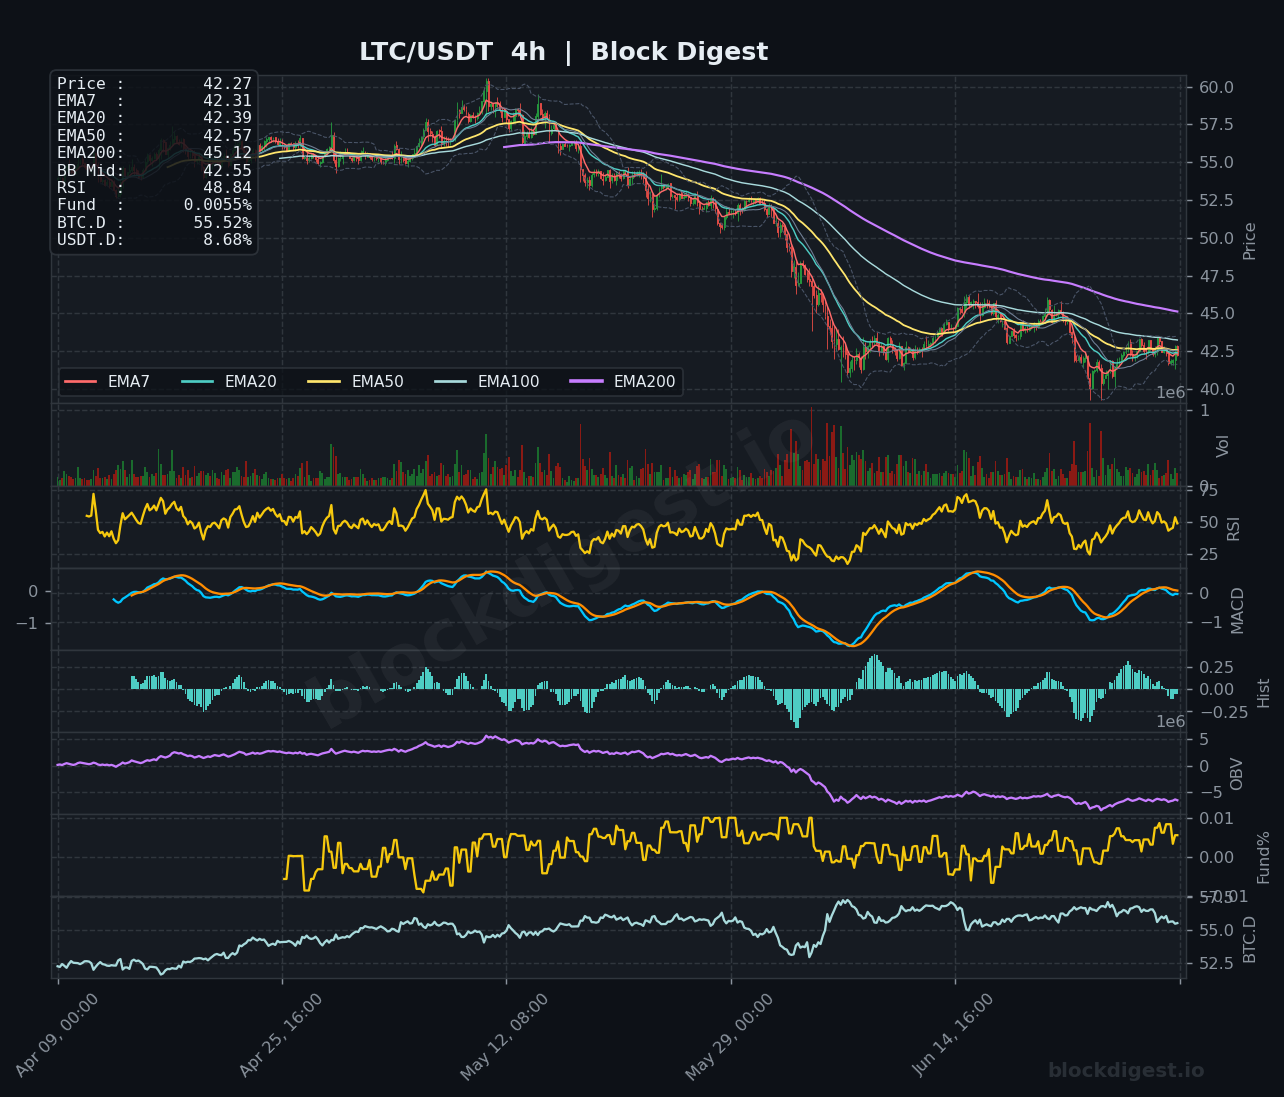
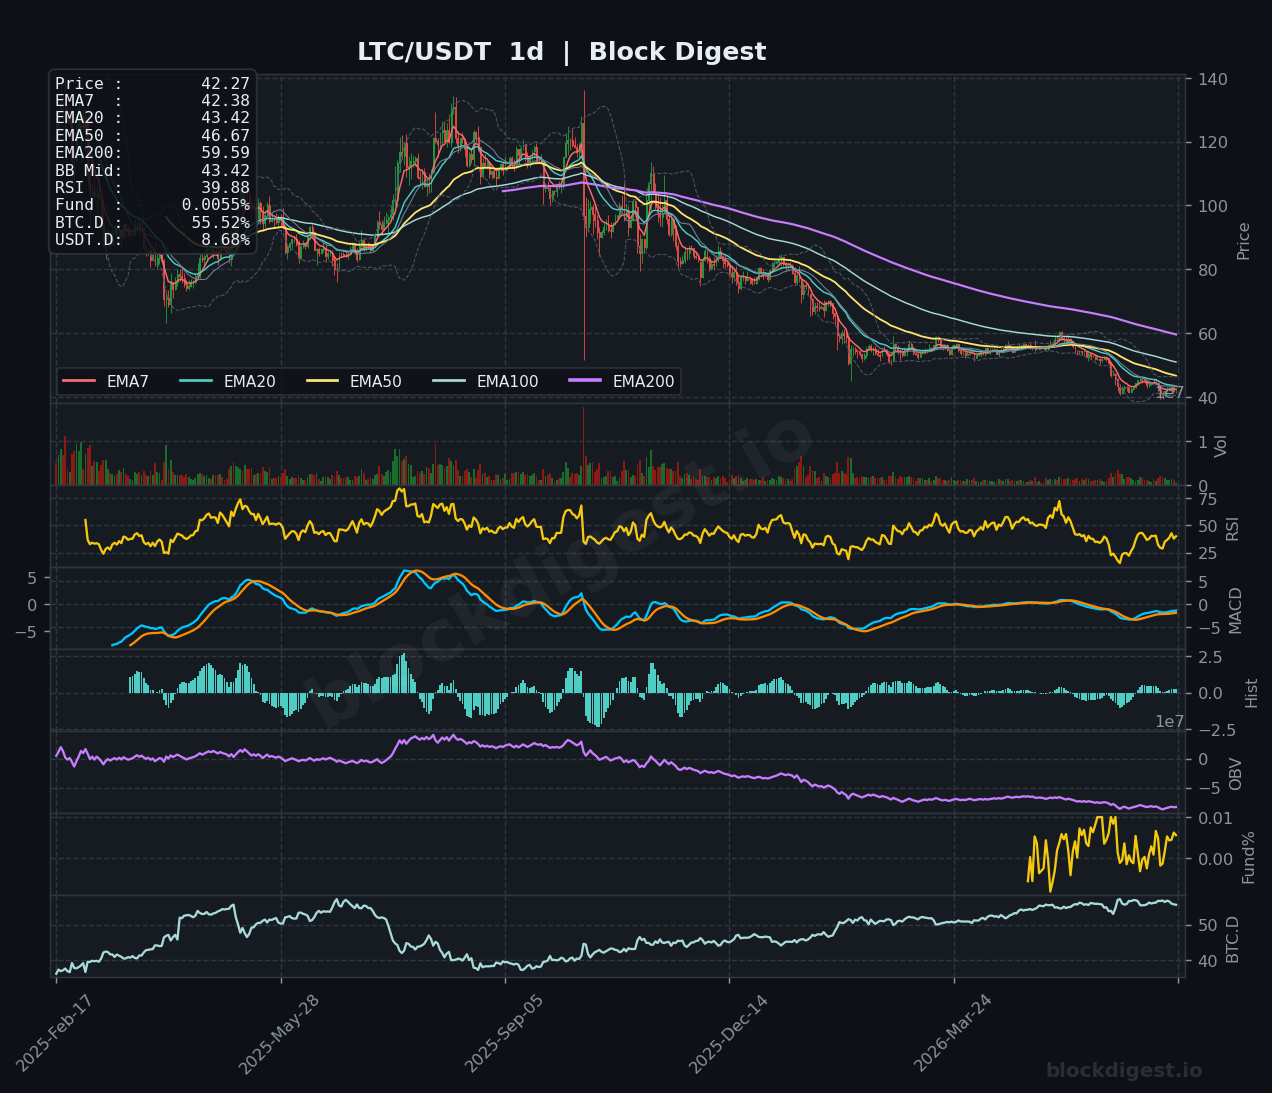
LTC is trading at $42.27, deeply beneath all major daily EMAs — with the EMA50 at $46.67 and EMA200 at $59.59 — highlighting an extended bearish macro trend that has accelerated since losing the $50 support level. On the 1h chart, RSI reads 49.37 and the MACD is approaching zero from below, suggesting a potential near-term neutral-to-slight-recovery posture at the very short-term horizon. The 4h RSI at 48.84 and a MACD curling up toward zero on the 4h frame indicate modest stabilization in momentum, though the daily RSI at 39.88 keeps the intermediate bias clearly bearish. Support is located between $41.00–$42.00, and LTC would need to clear the $43.42 daily EMA20 with follow-through volume to signal any meaningful shift; until then, the path of least resistance remains to the downside.
TRON (TRX)
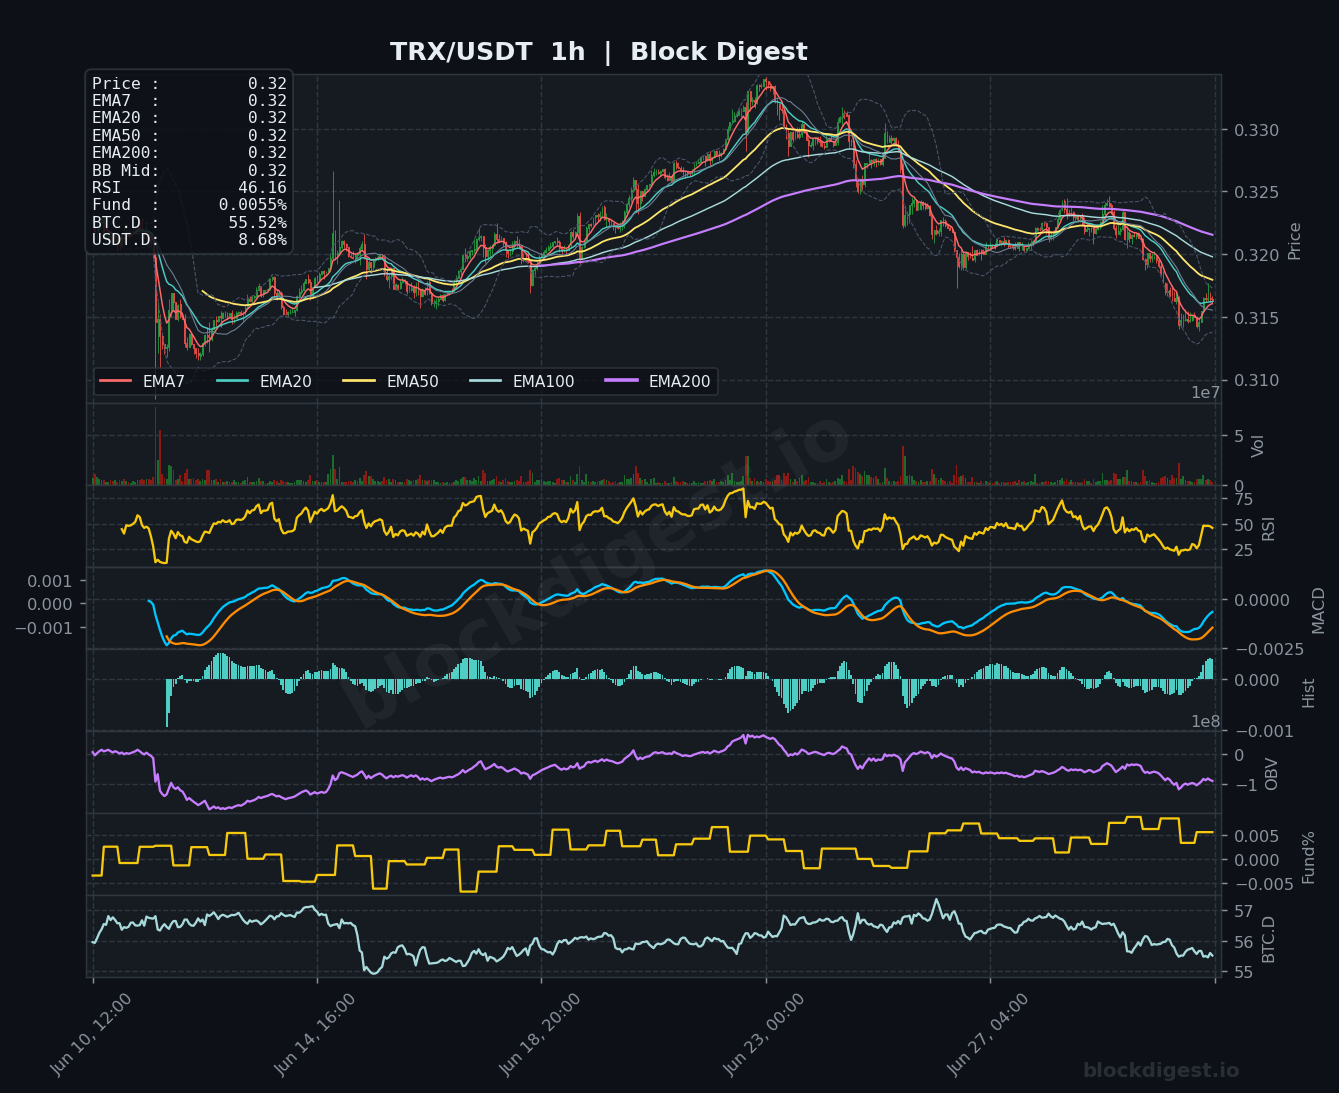
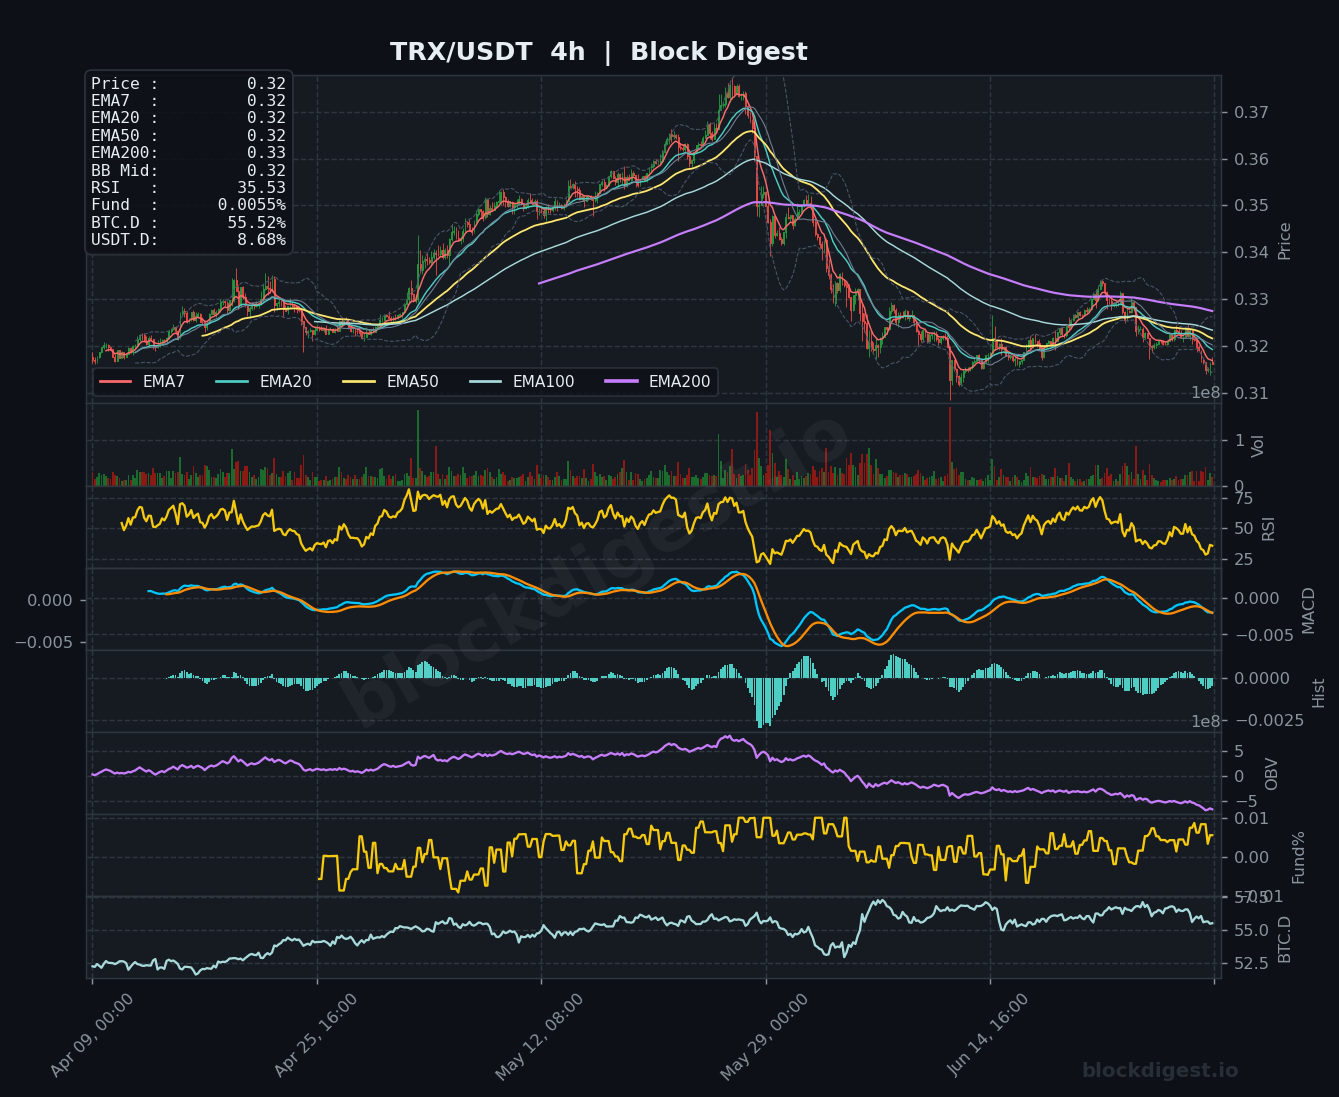
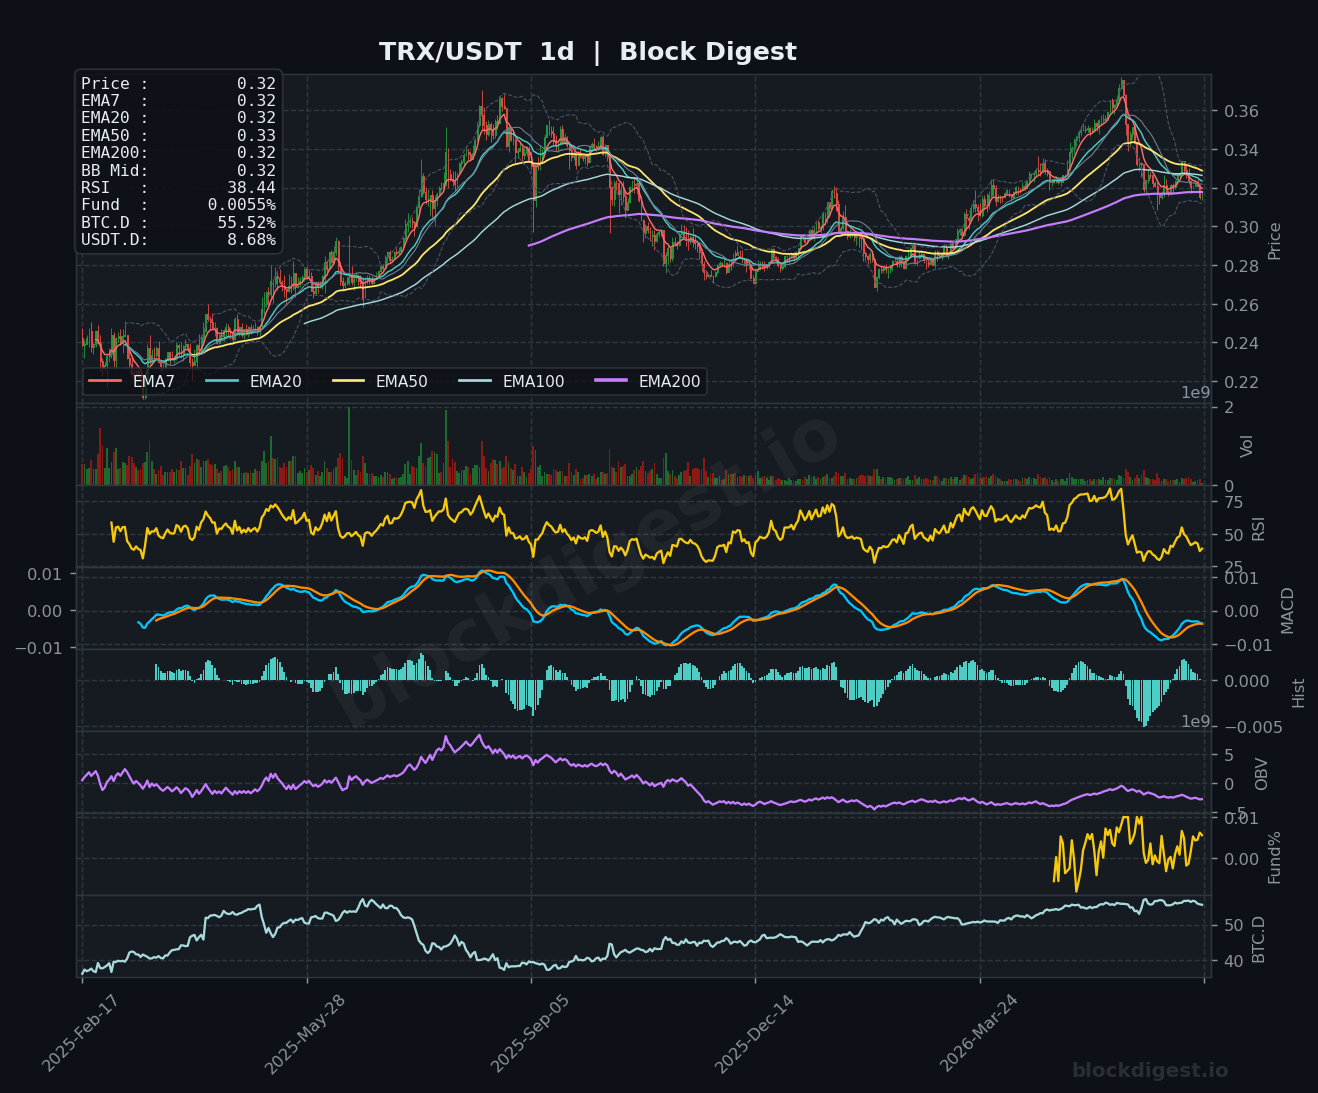
TRX is trading at $0.32, and uniquely among this group, the daily chart shows a far more constructive long-term structure — with price having risen from lows around $0.22 before reaching a peak near $0.37 and now pulling back to retest the EMA200 at $0.32 on the daily, which happens to coincide with current price. The 1h RSI at 46.16 and 4h RSI at 35.53 suggest near-term bearish momentum following the pullback from $0.37 highs, while the daily RSI at 38.44 reflects a corrective phase rather than a structural breakdown given TRX’s stronger base. The daily MACD is declining from a positive crossover and the histogram is turning negative, pointing to continued near-term selling pressure toward the $0.31–$0.32 support zone. A hold of the $0.31–$0.32 band — which aligns with the daily EMA200 and BB midline — would preserve TRX’s relatively stronger long-term setup compared to peers.
Altcoin Outlook
The altcoin landscape on July 1, 2026 is broadly bearish at the intermediate timeframe, with the majority of large-cap alts trading beneath all major daily EMAs and OBV indicators reflecting sustained distribution rather than accumulation. SOL presents the most constructive short-term setup, having bounced sharply with OBV confirming the move, while TRX stands out on the daily chart as holding the strongest relative structural position — still trading near its long-term EMA200 support rather than far below it. DOGE is the most technically distressed, with a daily RSI near 21, though this could attract short-term counter-trend traders if broader market sentiment shifts. Traders should watch for a decline in USDT.D below 8.50% and BTC.D below 55% as potential early signals of a rotation back into altcoins; until those conditions are met, rallies in the altcoin space are best treated as relief bounces within ongoing corrective trends.
Disclaimer: This analysis is for informational purposes only and does not constitute financial advice. Cryptocurrency markets are highly volatile and unpredictable. All trading decisions should be made based on your own research and risk tolerance. Block Digest is not responsible for any financial losses incurred as a result of acting on this content.
Stay Ahead of the Market
Follow BlockDigest for crypto market intelligence, research and real-time updates.


