Weekly Market Overview
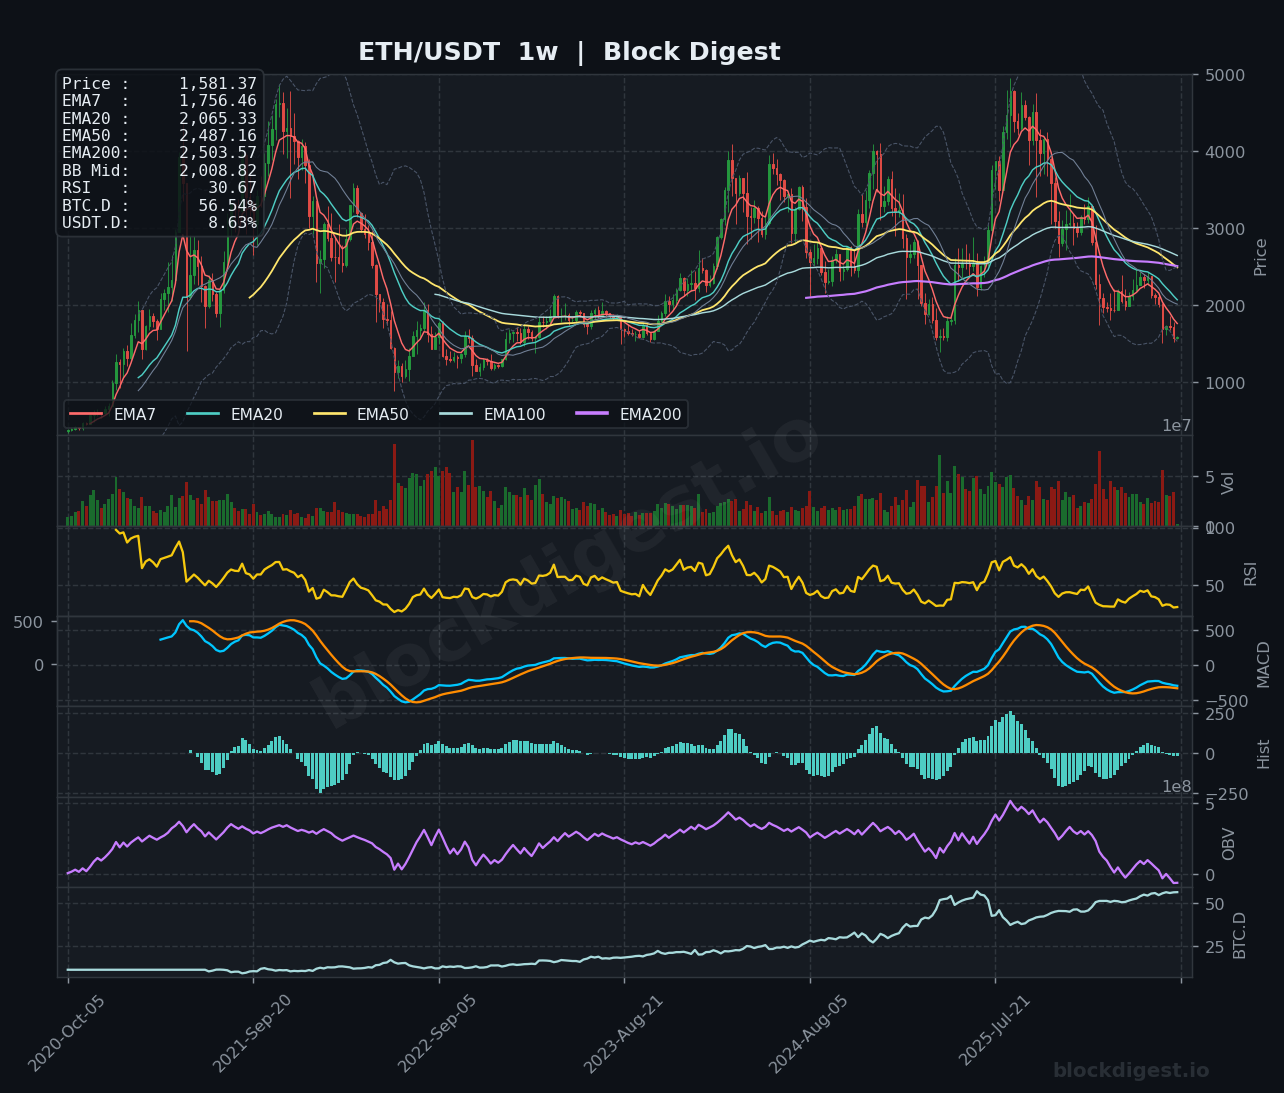
ETH/USDT closed the week ending June 29, 2026 at $1,581.37, continuing a protracted multi-month downtrend that has seen price shed well over 60% from its 2025 highs near $4,500. The weekly candle structure remains decisively bearish, with price printing fresh multi-year lows and finding no meaningful support on the descent. The broader macro context is unambiguous — ETH has been in a sustained distribution phase since early 2025, and the current weekly candle offers no technical evidence of a trend reversal. This week’s price action reinforces the dominance of sellers, with each attempted recovery swiftly faded back toward cycle lows.
Higher Timeframe Structure
On the weekly chart, the EMA stack is in full bearish cascade: price trades well below all major moving averages, with the EMA7 at $1,756, EMA20 at $2,065, EMA50 at $2,487, EMA100 in close proximity to the EMA200 at approximately $2,503, leaving a massive overhead resistance cluster spanning roughly $500. The weekly Bollinger Band midline sits at $2,008, acting as dynamic resistance that price has failed to reclaim for several consecutive weeks. Contextually, this price zone near $1,580 represents a critical macro level — a revisit of support last seen during the 2023 bear market lows — and a confirmed weekly close below this region would open the door to significantly deeper retracements. The weekly RSI at 30.67 is approaching oversold territory, a level that has historically preceded at minimum a relief bounce, though it does not by itself constitute a buy signal in a trending market.
Multi-Timeframe Confluence
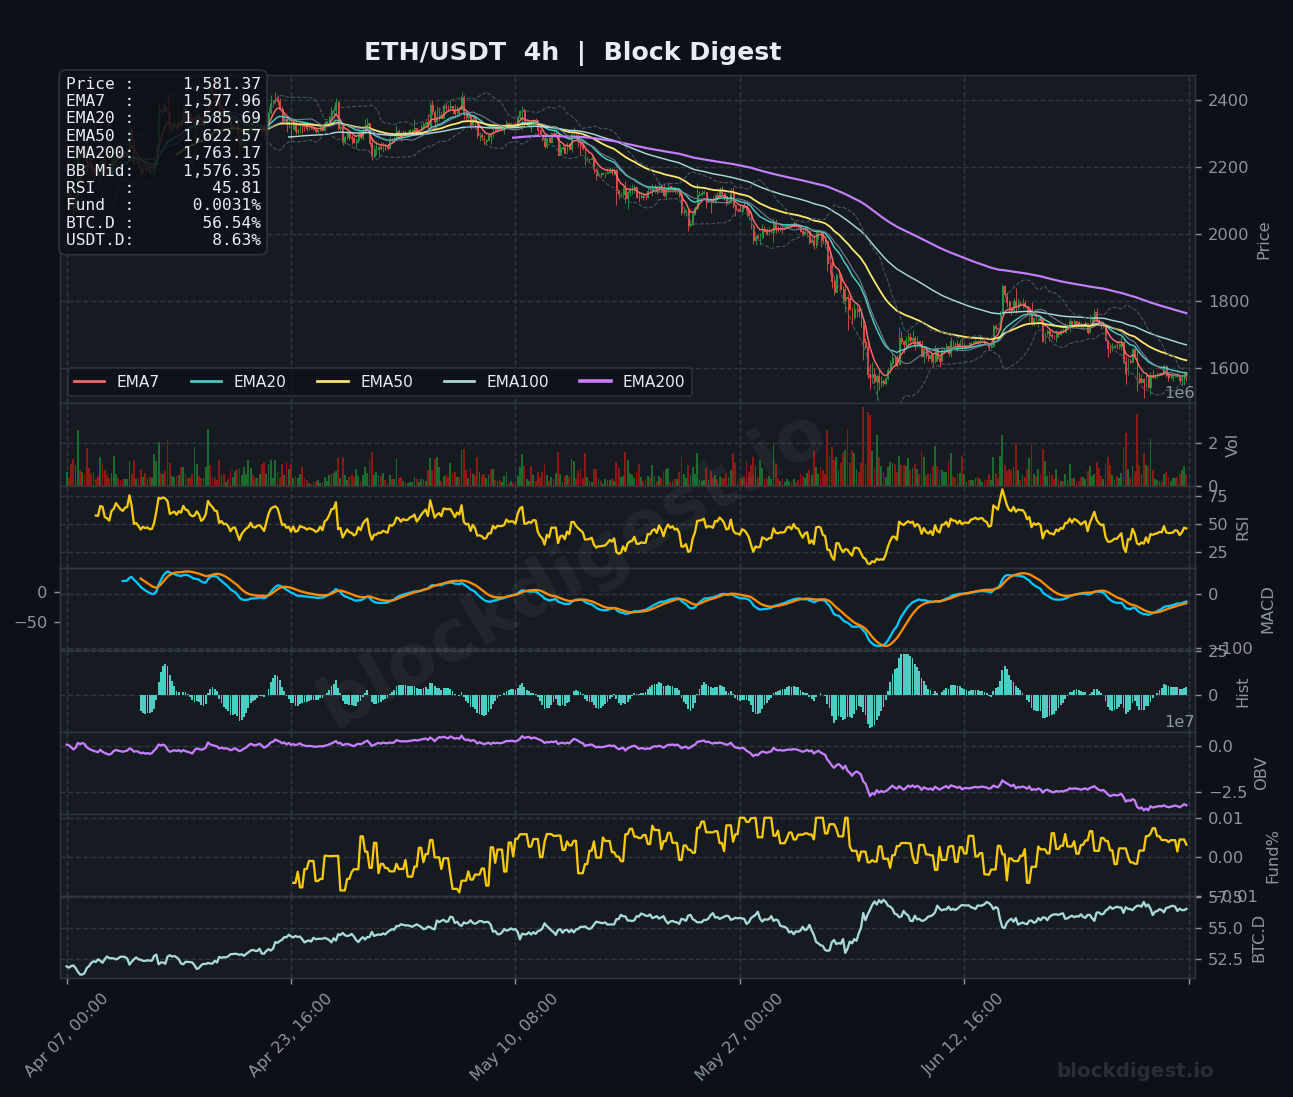
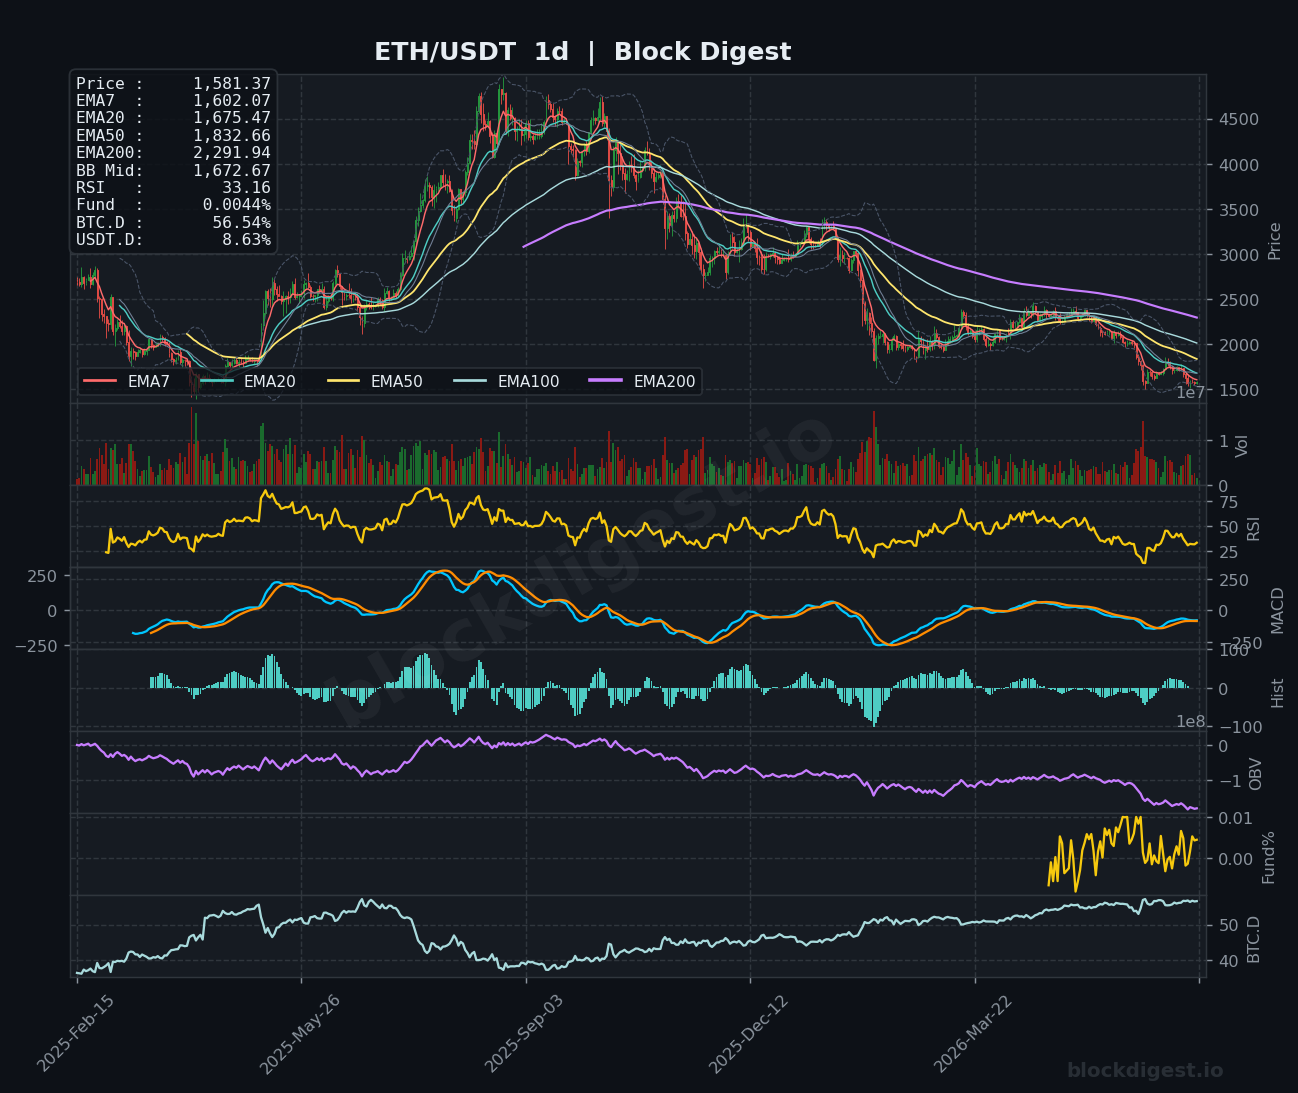
All three timeframes are aligned bearishly, presenting a rare but significant degree of top-down confluence. On the daily chart, price trades below all EMAs with the EMA7 at $1,602 and EMA200 at $2,291 serving as stacked resistance, while the BB midline at $1,672 caps any intraday recovery attempts. The 4-hour chart mirrors this structure precisely — EMA7 ($1,577), EMA20 ($1,585), and EMA50 ($1,622) are tightly compressed and bear-stacked above current price, confirming that even shorter-timeframe momentum remains in distribution mode. There is no meaningful timeframe divergence to suggest accumulation is occurring; intraweek bounces have consistently been sold into, validating the weekly bearish thesis.
Key Weekly Levels
- Weekly Resistance:
- $1,622 — 4H EMA50 and immediate overhead supply; first structural resistance any recovery must clear
- $1,672–$1,675 — Daily BB midline and daily EMA20; a key confluence zone where sellers have repeatedly reasserted control
- $1,756–$1,763 — Weekly EMA7 and 4H EMA200; reclaiming this level would be the minimum requirement to shift short-term bias neutral
- Weekly Support:
- $1,550–$1,560 — Psychological and technical proximity to current price; immediate downside if selling pressure continues
- $1,400–$1,420 — Major structural support from 2023 bear market accumulation zone; next significant demand area on the weekly chart
- $1,200–$1,250 — Deep macro support level aligning with the 2022–2023 cycle floor; extreme bear scenario target
Momentum & Volume Analysis
The weekly RSI at 30.67 is approaching the oversold threshold but has not yet generated a confirmed bullish divergence, suggesting momentum remains pointed lower with no clear exhaustion signal. On the daily timeframe, RSI has dropped to a more severe 33.16, indicating that selling pressure has been consistent and relentless without the typical oscillation that precedes a meaningful recovery. The 4H RSI at 45.81 has attempted brief recoveries but has consistently failed to push above the neutral 50 level, confirming that even short-term momentum is capped. The OBV indicator across all three timeframes tells a particularly damning story — weekly OBV has declined sharply from its 2025 peak and is approaching levels not seen since 2023, while daily and 4H OBV continues to trend lower, indicating sustained net selling volume without absorption. The funding rate sits at a near-neutral 0.0031%–0.0044% across timeframes, suggesting the market is not yet at extreme short crowding — meaning there is less potential for a violent short squeeze to drive price recovery organically.
BTC Dominance & Altcoin Implications
BTC dominance at 56.54% remains elevated and in a clear uptrend across all timeframes, compressing the space available for altcoin capital rotation. The USDT dominance reading of 8.63% indicates a meaningful portion of market capital remains parked in stablecoins, reflecting broader risk-off sentiment and a lack of confidence in deploying capital into altcoins like ETH at current levels. Until BTC.D shows a confirmed rollover and USDT.D begins declining, the structural environment for ETH outperformance remains deeply unfavorable, and any rallies should be treated as relief bounces within a larger dominance-driven bear trend for the altcoin complex.
Risk Scenarios
- Bull case: A weekly close back above $1,756 (weekly EMA7) would be the first credible signal of trend exhaustion, potentially triggering a relief rally toward the $2,008 BB midline and subsequently the $2,065 EMA20 cluster. For this scenario to materialize, daily RSI would need to reclaim 40–45 with expanding green volume, and BTC.D would need to show concurrent weakness, suggesting capital rotation back into ETH.
- Bear case: Failure to hold the $1,550–$1,560 zone on a weekly closing basis would confirm a continuation of the macro downtrend with the next meaningful target at the $1,400–$1,420 structural support. A sustained break below that level — particularly if accompanied by rising USDT.D and continued OBV deterioration — would expose the $1,200 cycle floor as a realistic medium-term target.
Weekly Outlook
Heading into the week of June 29, the path of least resistance for ETH remains to the downside, with the overall technical picture offering little immediate basis for optimism. The primary directive for the week is monitoring whether price can hold the $1,550 psychological zone on a closing basis, as a failure here would escalate the bearish thesis considerably. Critical levels to watch on the upside are the EMA20/EMA7 cluster between $1,577 and $1,602 — a reclaim of this zone with volume would at minimum shift the 4H bias to neutral and offer scalp opportunities. Macro catalysts including any developments in broader crypto regulation, ETH ETF flow data, and BTC’s own price action relative to its key supports will be pivotal in determining whether this is a final capitulation zone or simply another leg in an ongoing bear phase. Risk/reward for new short positions is increasingly unfavorable given proximity to weekly RSI oversold levels, but no evidence of accumulation yet warrants long exposure without confirmation — patience and disciplined level monitoring remain the highest-value trade this week.
Disclaimer: This analysis is for informational purposes only and does not constitute financial advice. Cryptocurrency markets are highly volatile and unpredictable. All trading decisions should be made based on your own research and risk tolerance. Block Digest is not responsible for any financial losses incurred as a result of acting on this content.
Stay Ahead of the Market
Follow BlockDigest for crypto market intelligence, research and real-time updates.