
Market Context
Bitcoin dominance sits at approximately 56.56% as of June 29, 2026, reflecting a market environment where capital continues to favor BTC over the broader altcoin field — a headwind for sustained altcoin rallies. USDT dominance at 8.63% remains elevated, indicating that a meaningful portion of sidelined capital has yet to rotate back into risk assets. The overall altcoin landscape presents a mixed-to-bearish picture, with most major assets trading well below their medium-term moving averages on the daily timeframe and momentum indicators failing to generate convincing recovery signals.
Solana (SOL)
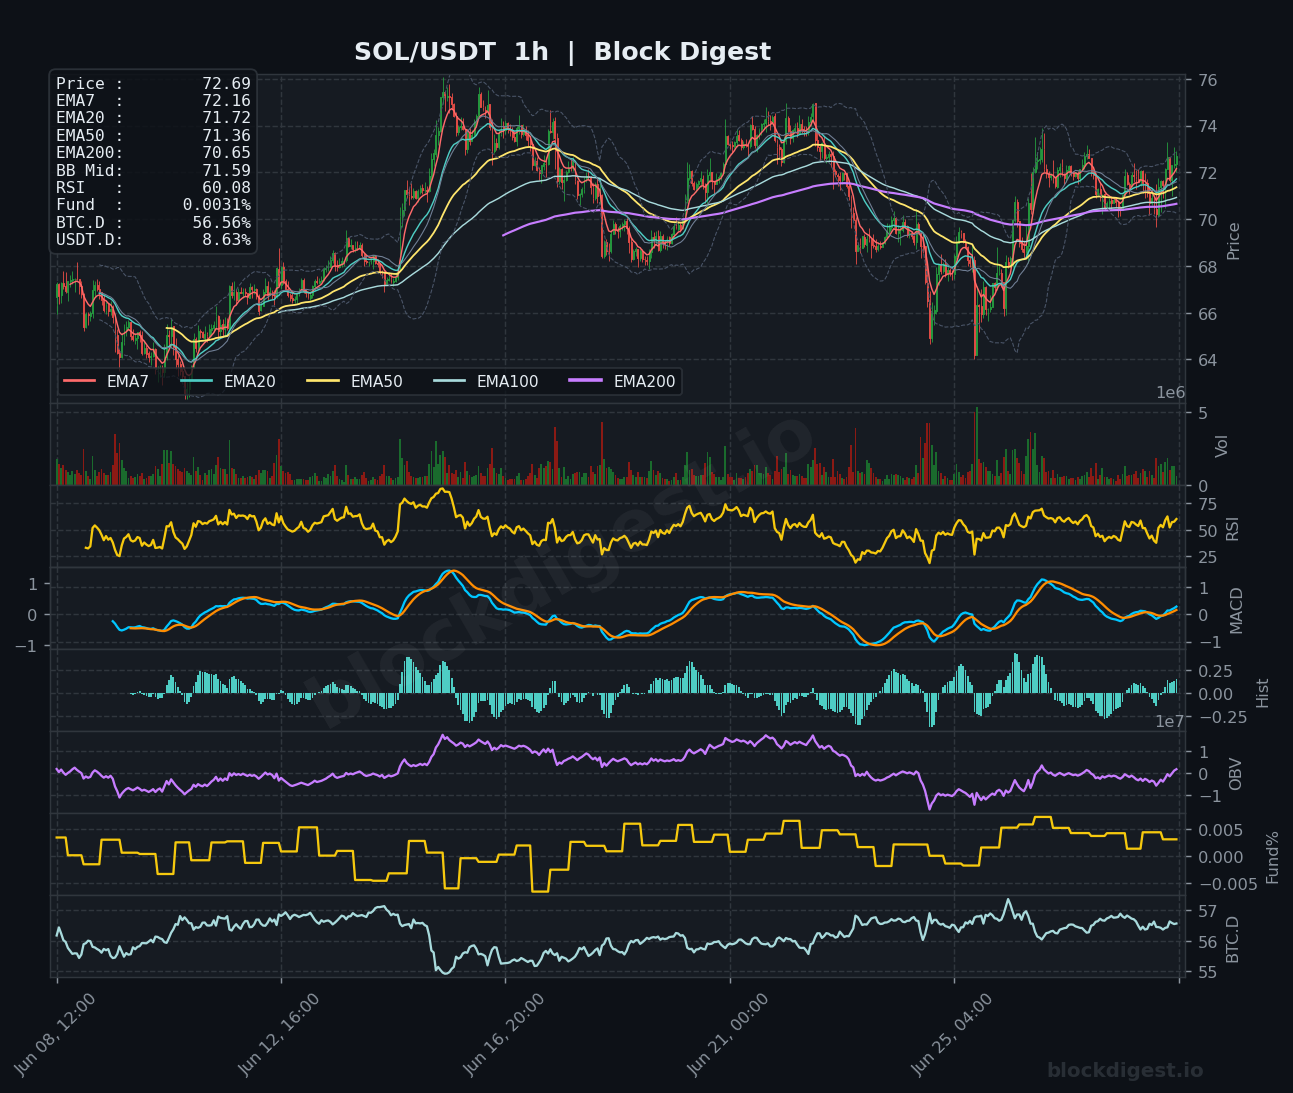
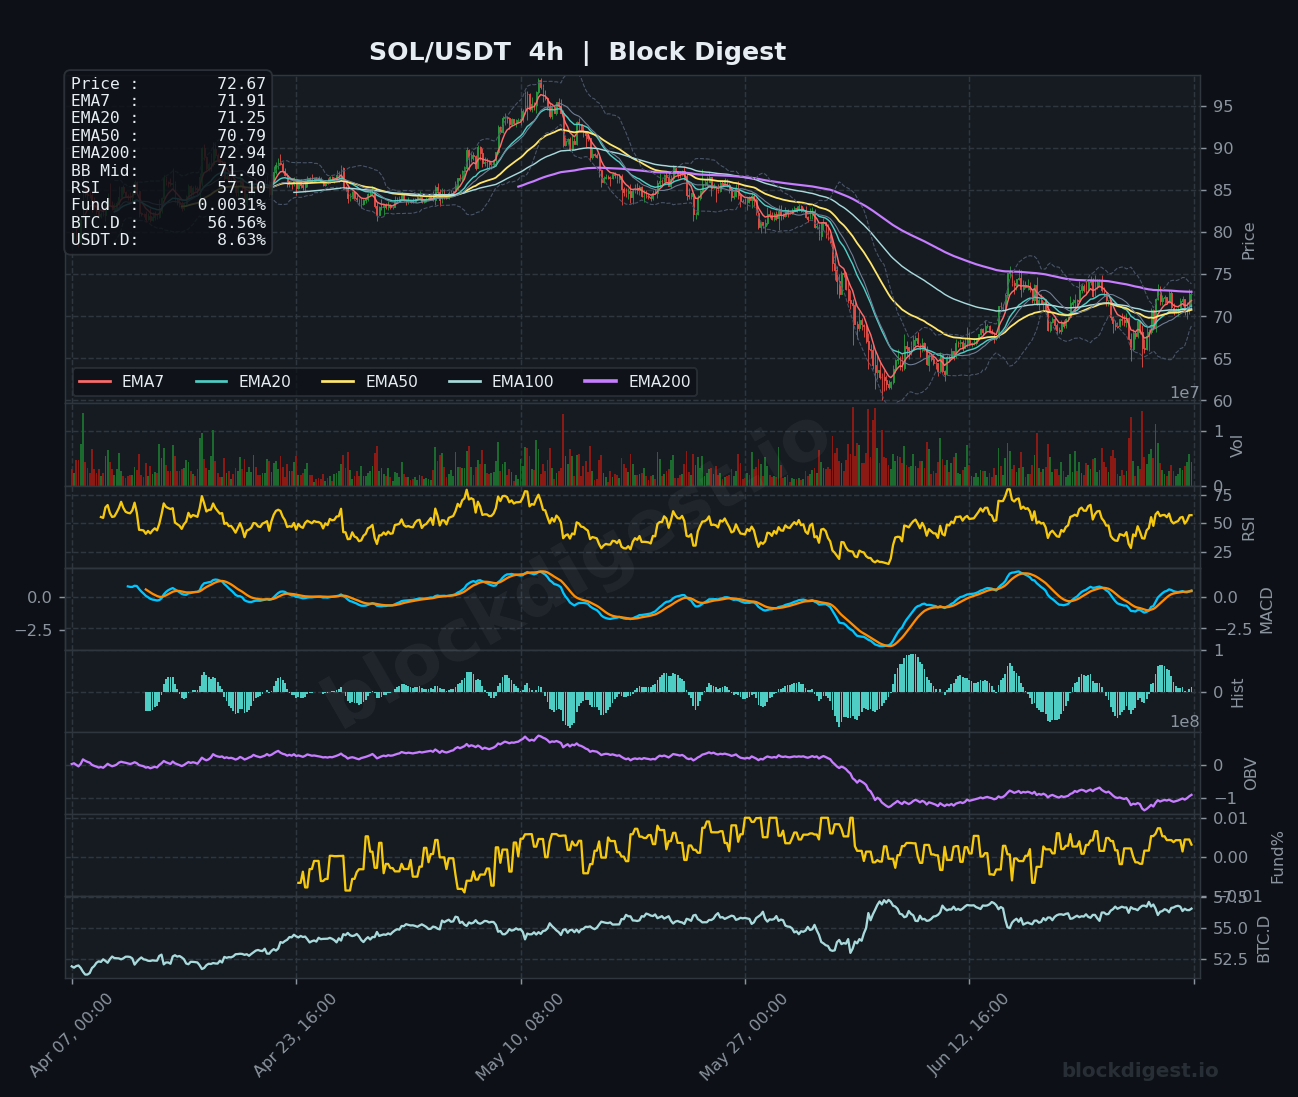
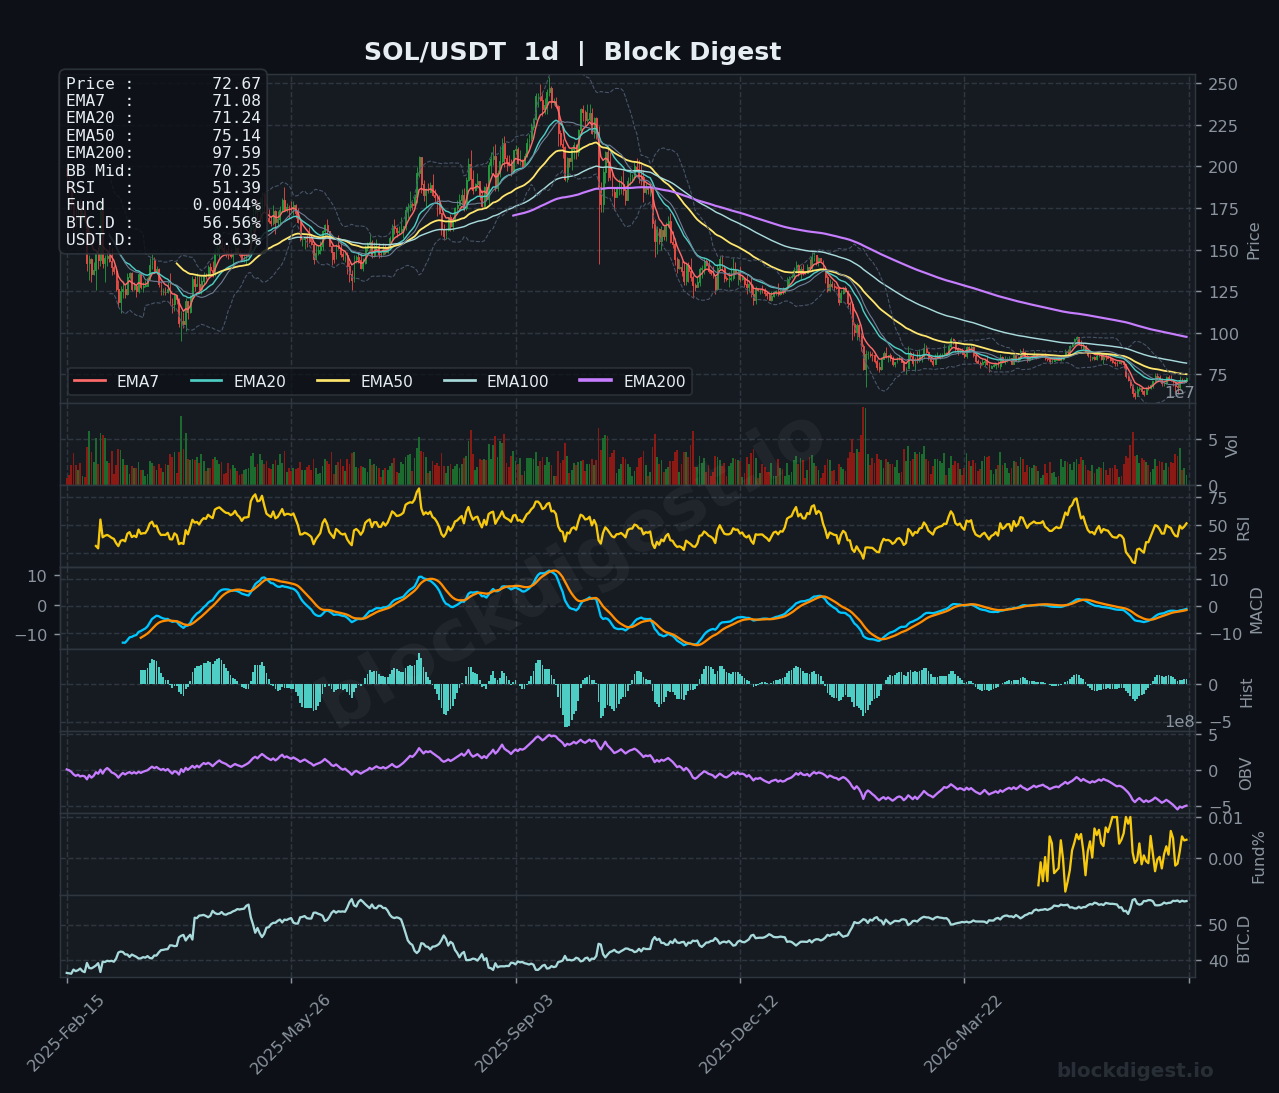
SOL is trading at $72.67, showing a modest near-term recovery attempt after a sharp multi-week decline from the $95+ range seen in mid-May. On the 1-hour chart, price has reclaimed all short-term EMAs (EMA7 at $72.16, EMA20 at $71.72), with the RSI reading 60.08 — the strongest short-term momentum reading across the altcoins surveyed today. However, the 4-hour structure remains technically compromised, with price still well below the EMA200 at $72.94, which now acts as immediate overhead resistance. On the daily chart, the EMA50 at $75.14 and EMA200 at $97.59 loom as significant barriers, while the daily RSI at 51.39 sits in neutral territory, suggesting the recovery lacks conviction. Short-term bias is cautiously bullish while price holds above $71, but the broader daily trend remains structurally bearish.
XRP (XRP)
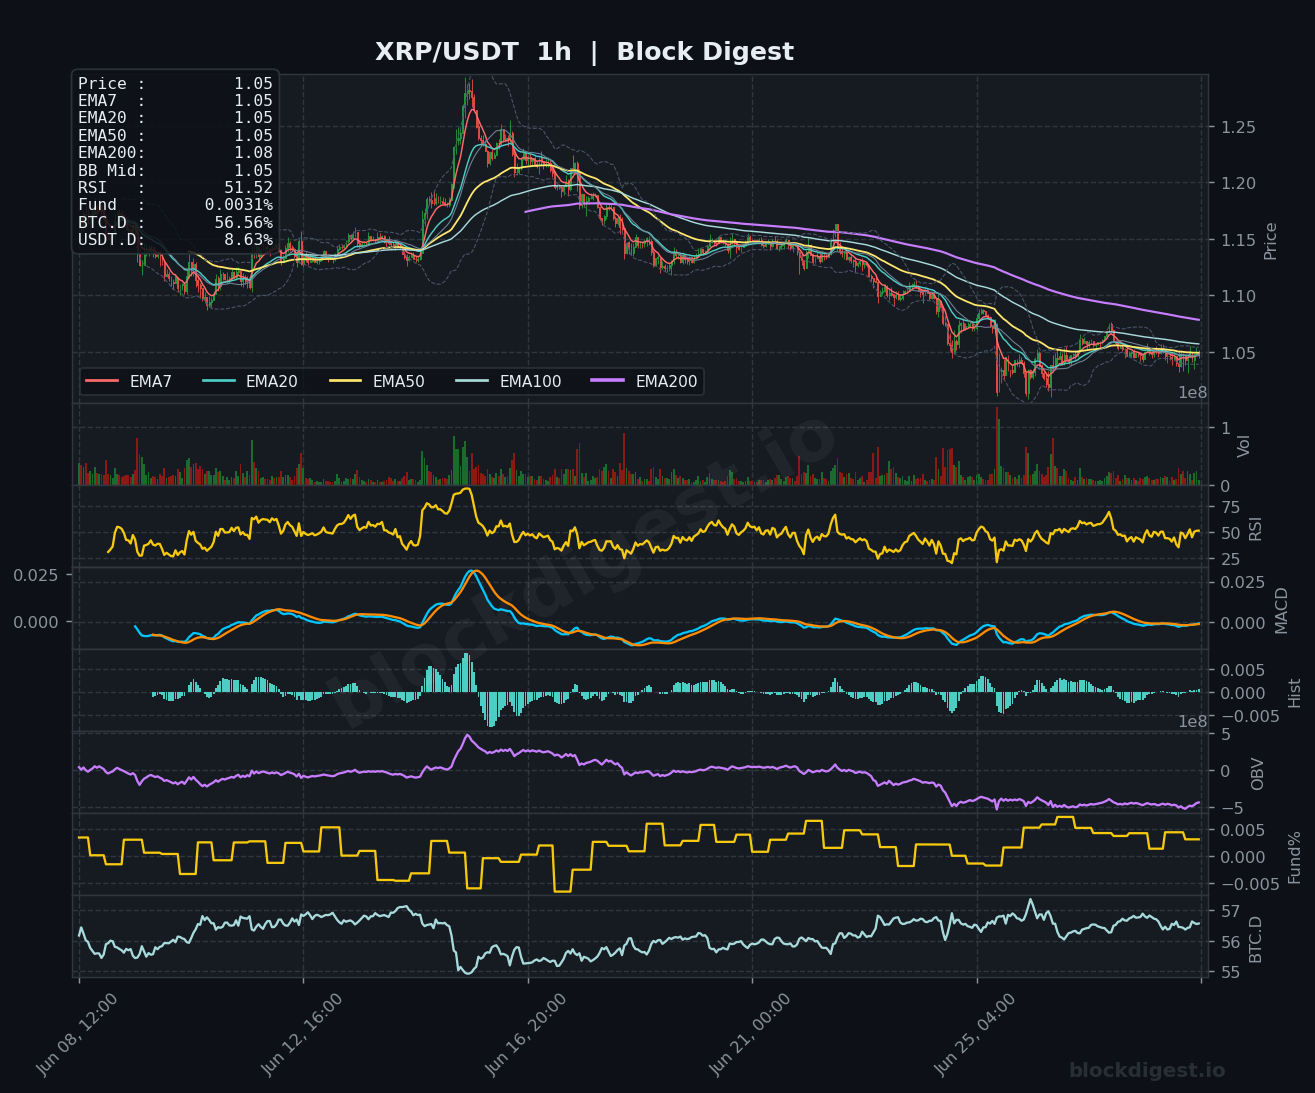
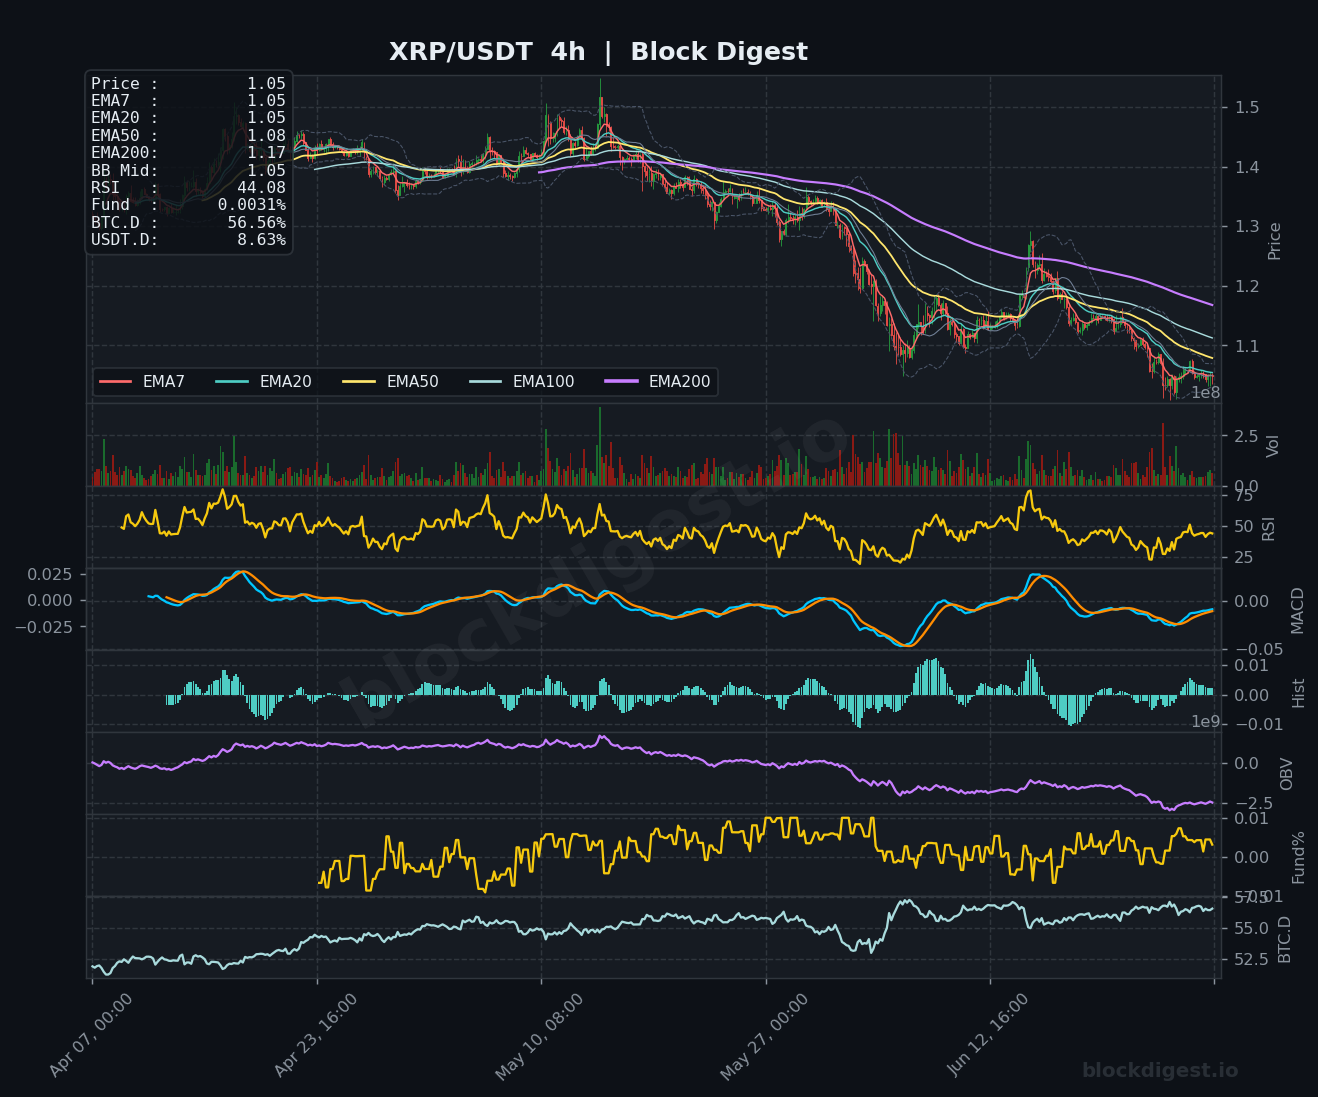
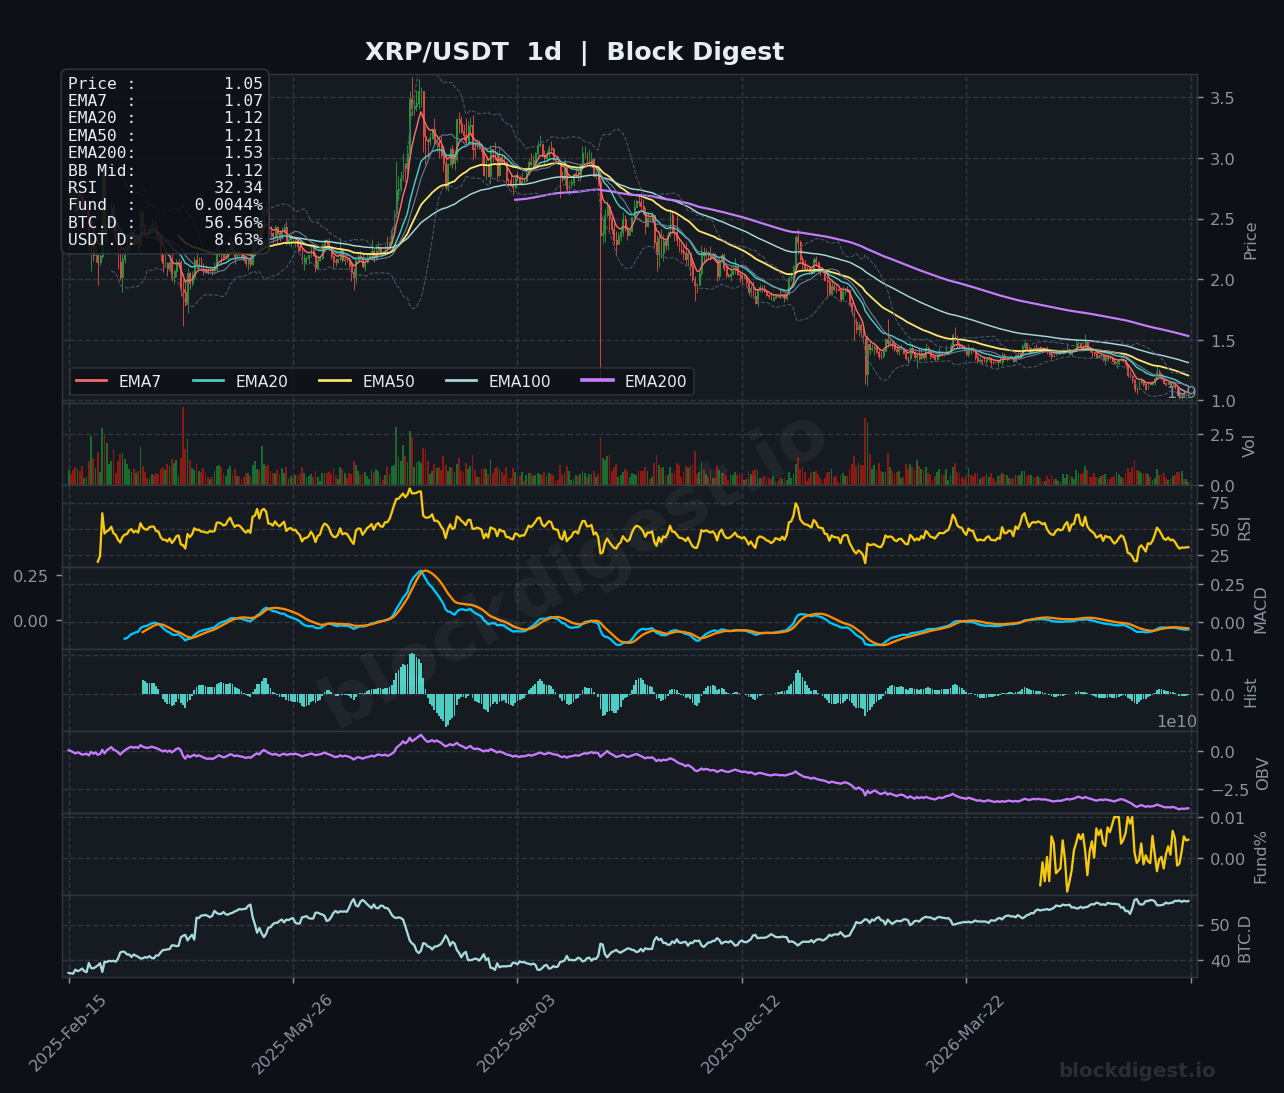
XRP is trading at $1.05, pressing against a zone of compressed EMAs on the 1-hour chart where EMA7, EMA20, and EMA50 are all converged at $1.05, signaling extreme indecision and a lack of directional momentum. The 4-hour RSI at 44.08 sits in mild bearish territory, with the MACD still negative and showing no clear bullish crossover, while price trades beneath a steeply declining EMA200 at $1.17. The daily chart is the most concerning of the group: RSI has dropped to 32.34, approaching oversold territory, and price is trading well below all major moving averages — including the EMA200 at $1.53 — with sustained OBV deterioration confirming persistent distribution pressure. Immediate support sits near $1.02–$1.03; any bounce needs to reclaim $1.10 to improve the short-term outlook, and the bias remains bearish.
BNB (BNB)
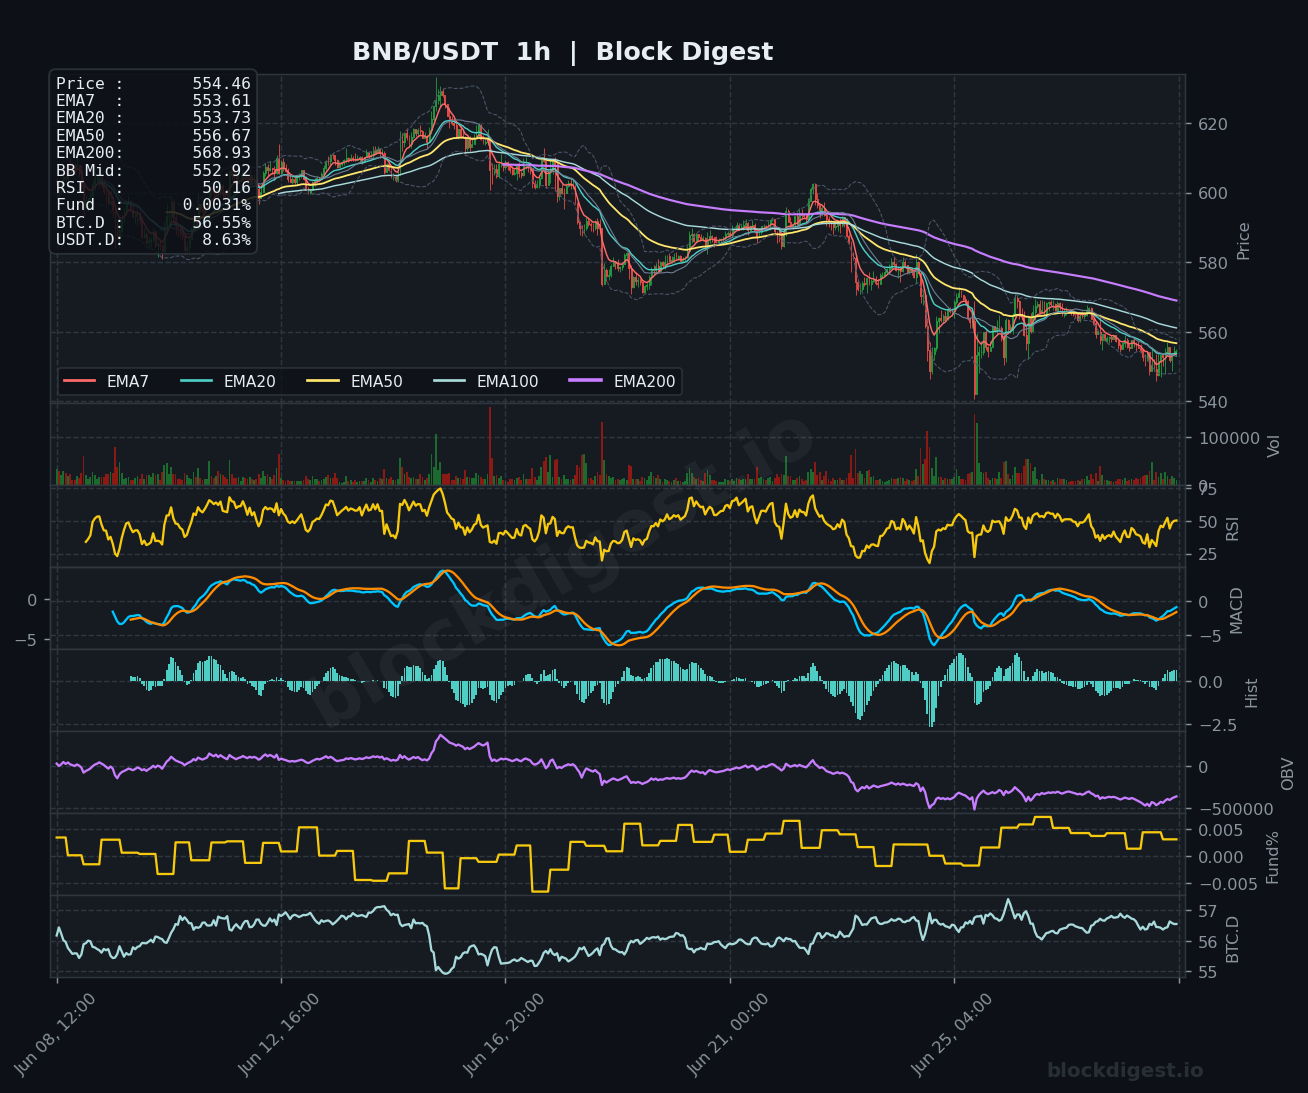
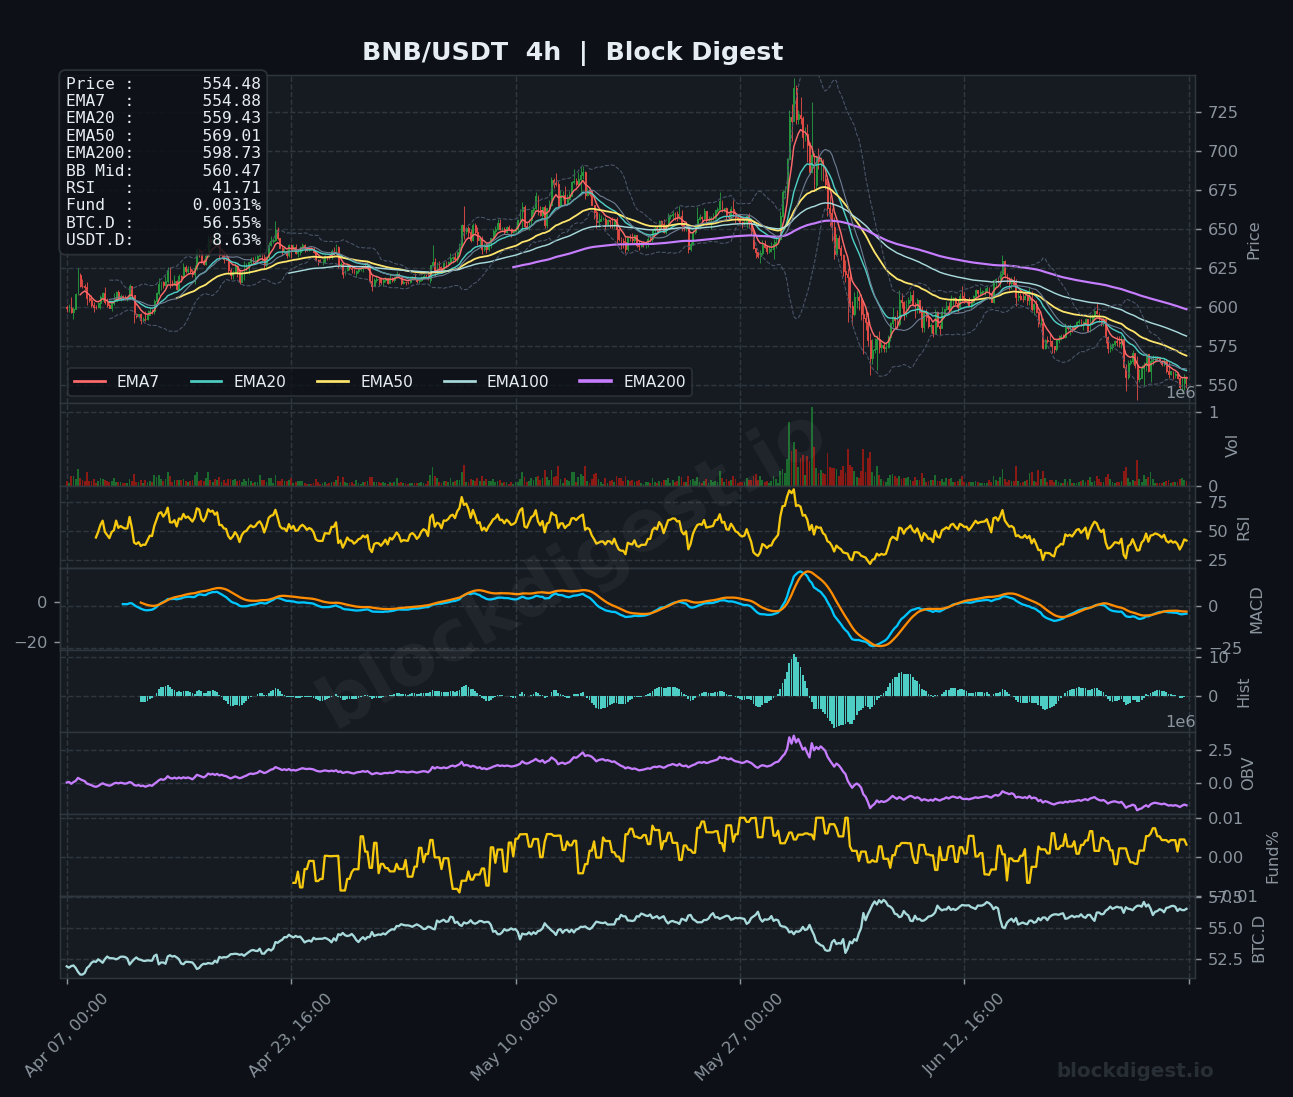
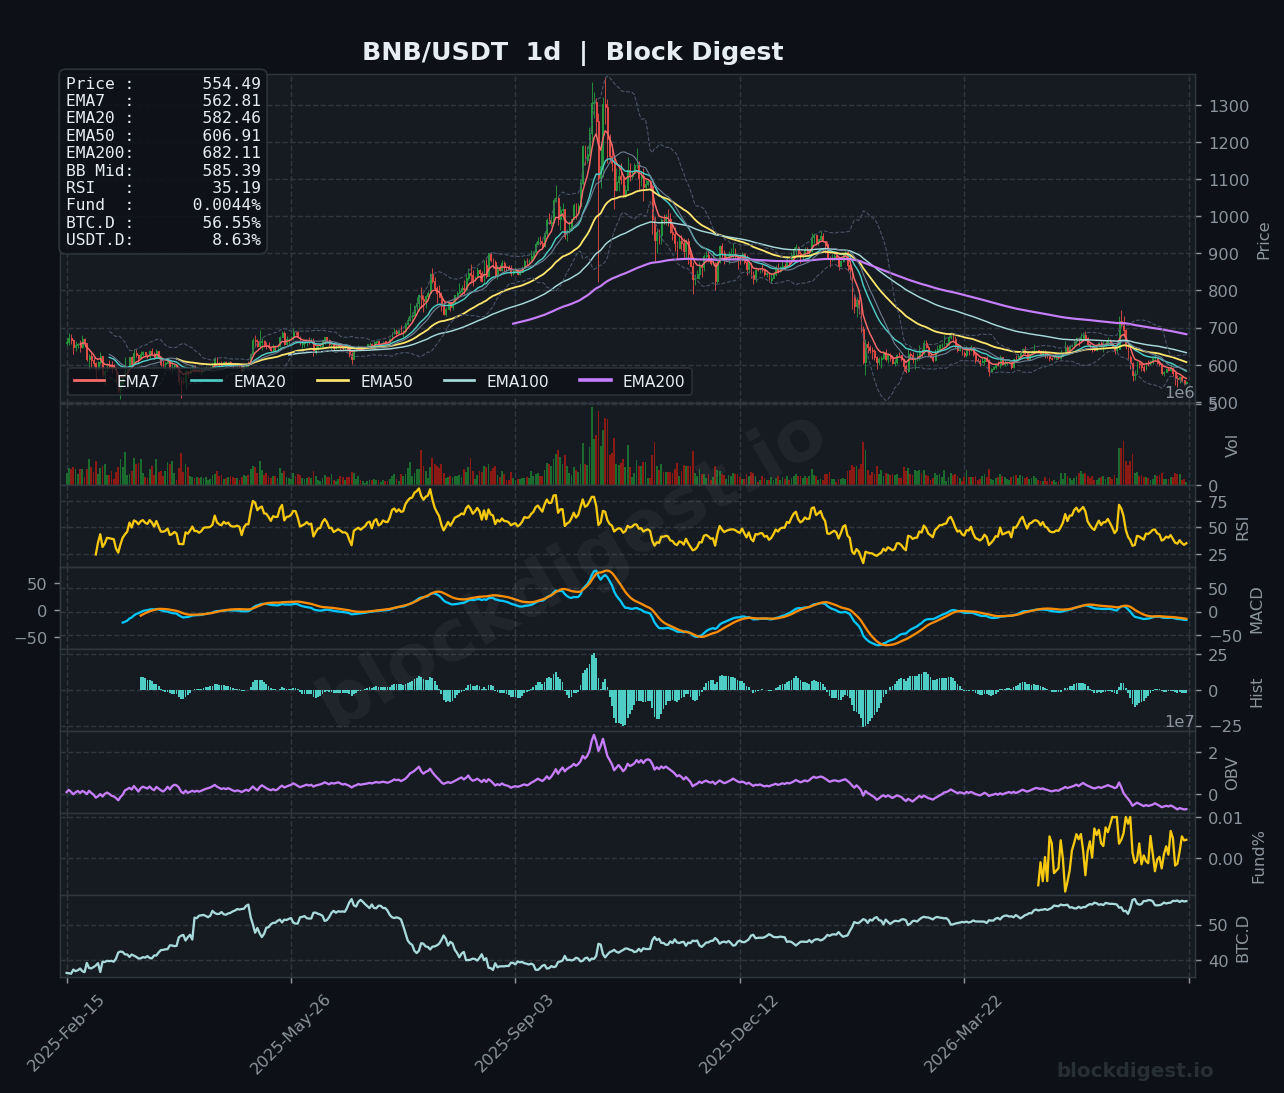
BNB is trading at $554.46, consolidating in the lower portion of its recent range after a dramatic decline from the $725 peak seen in late May. The 1-hour RSI at 50.16 reflects a neutralized short-term momentum environment, with price currently hugging the EMA7 ($553.61) and EMA20 ($553.73) in a tight cluster, while the EMA50 at $556.67 caps immediate upside. On the 4-hour timeframe, the RSI reads 41.71 and the MACD remains in bearish territory below zero, confirming that the intermediate trend has not yet turned. The daily chart RSI at 35.19 indicates sustained selling pressure without yet reaching technical oversold levels, and price is trading well beneath the EMA50 ($606.91) and EMA200 ($682.11). Key support to monitor is the $540–$545 zone; a failure there could open the door to further downside, and the short-term bias is neutral-to-bearish.
Dogecoin (DOGE)
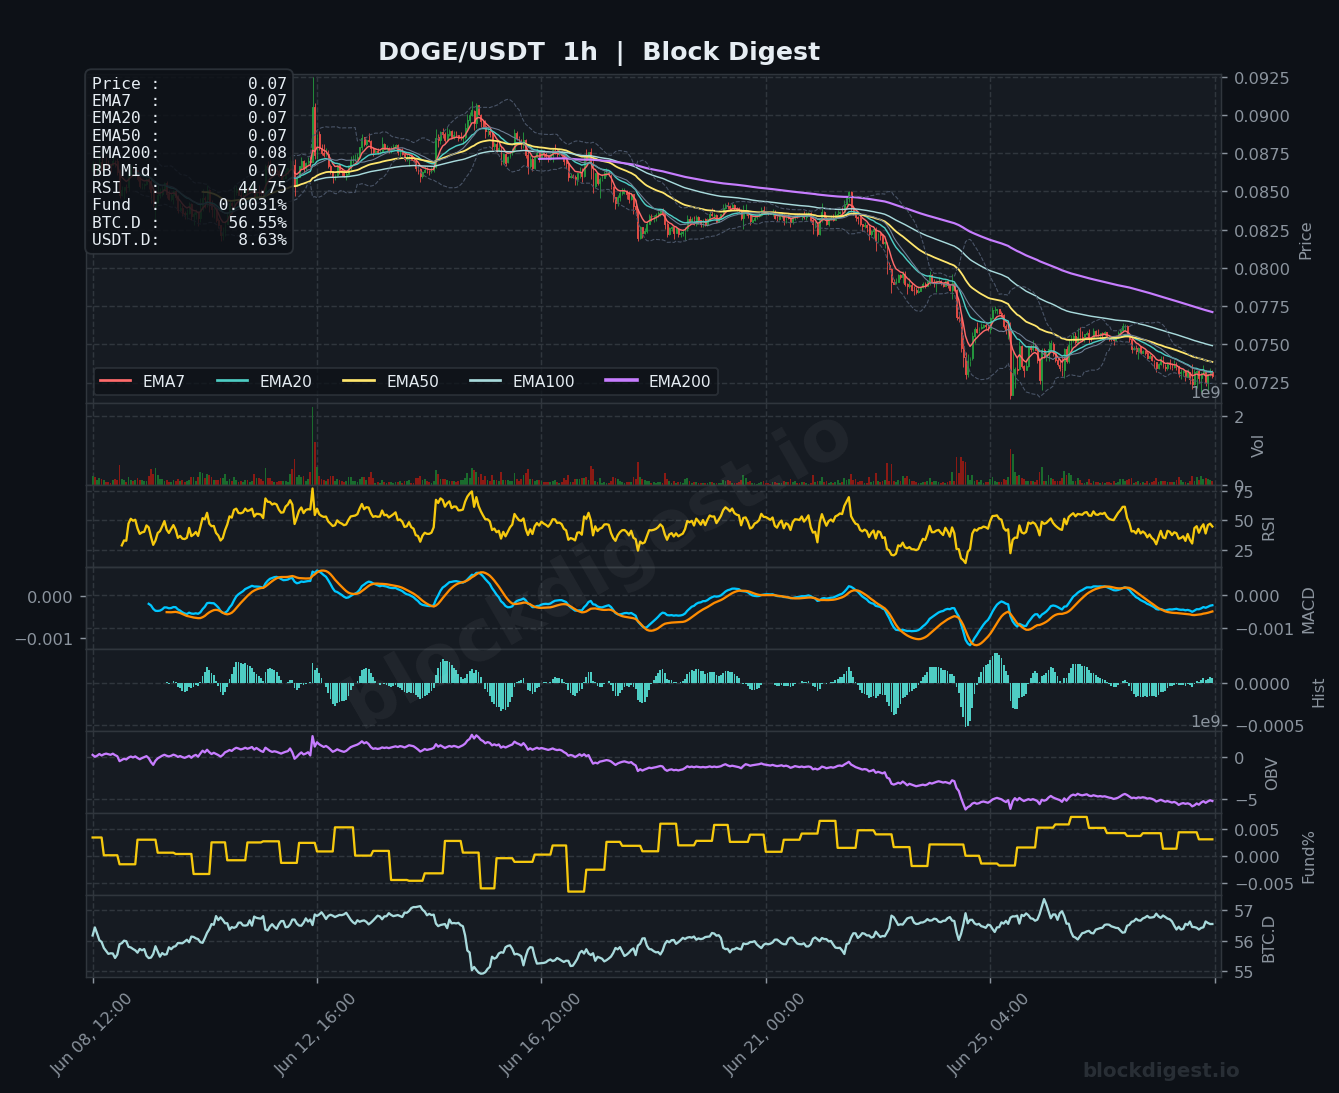
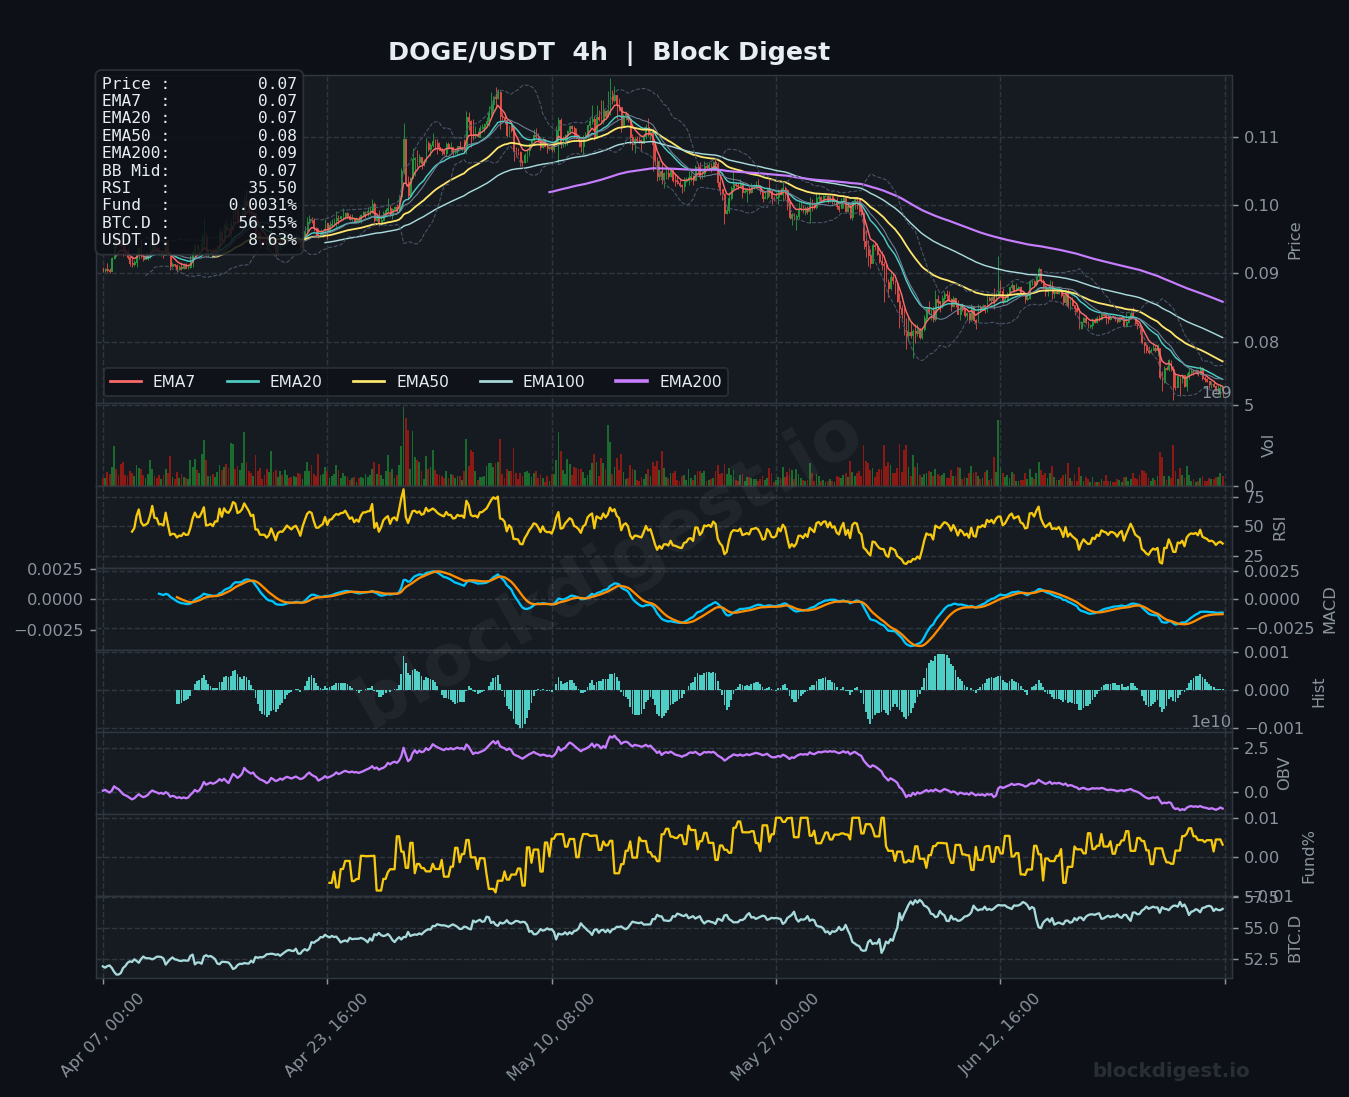
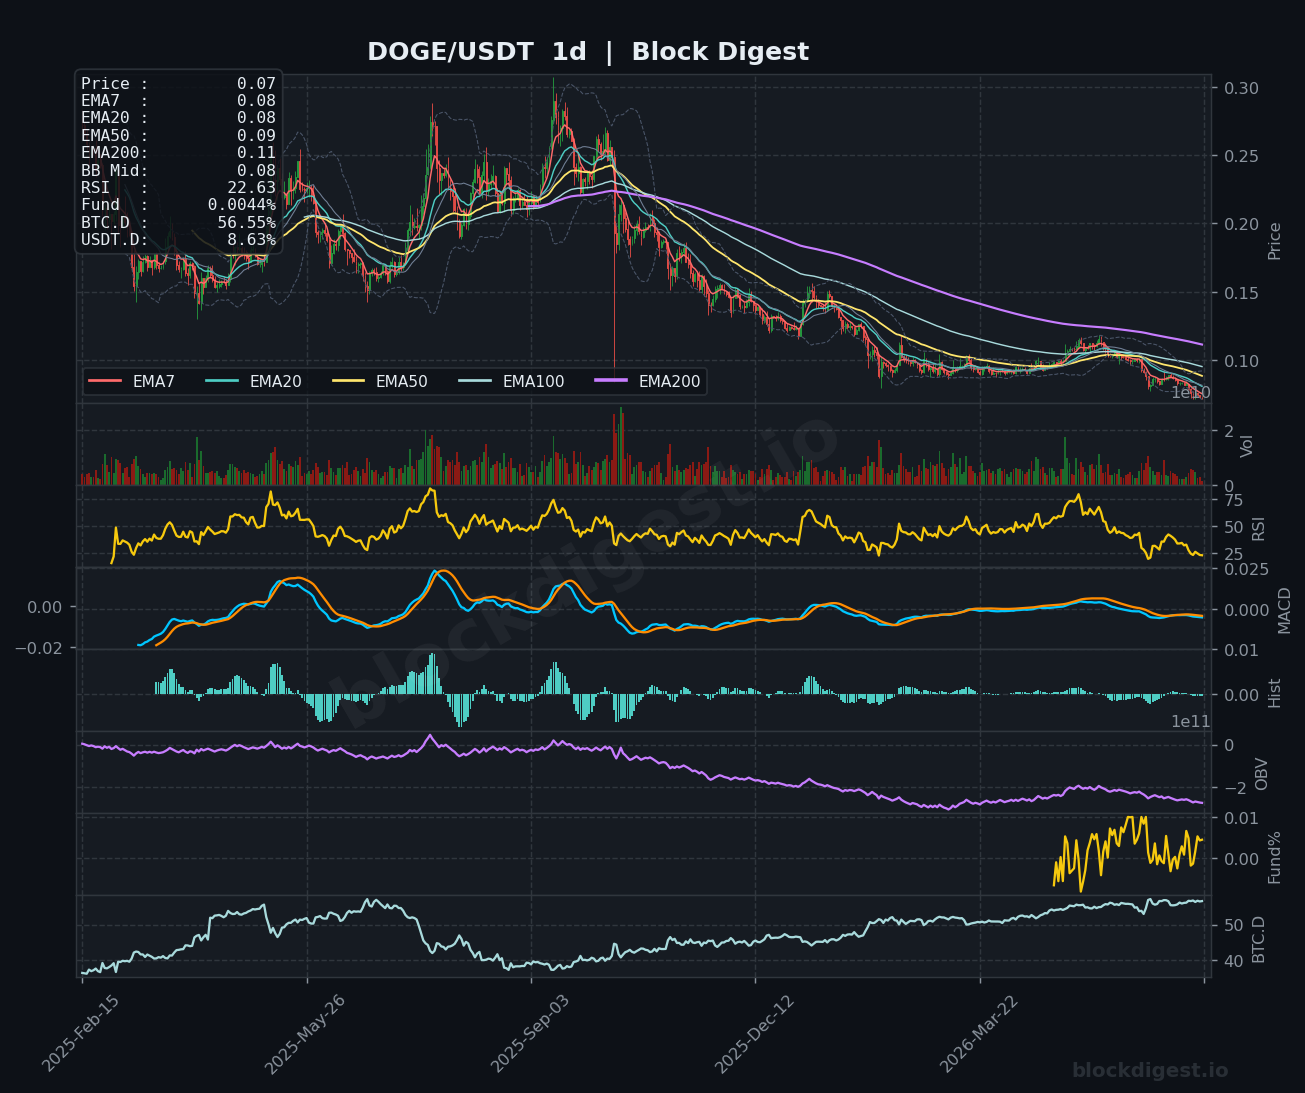
DOGE is trading at $0.0700, sitting at multi-month lows and representing one of the weakest setups in today’s survey. The 1-hour RSI at 44.75 and the 4-hour RSI at 35.50 both reflect persistent bearish pressure, with all EMAs on the 4-hour chart in a bearish cascade — EMA7 and EMA20 at $0.07, EMA50 at $0.08, and EMA200 at $0.09 — acting as successive resistance levels overhead. The daily chart is particularly concerning, with RSI collapsing to 22.63, entering deeply oversold territory, which could trigger a short-term technical bounce but does not negate the dominant downtrend. OBV across all timeframes continues to slope lower, confirming that sellers remain in control; the $0.068–$0.070 zone is critical support, and the short-term bias is bearish with a watch for an oversold bounce.
Litecoin (LTC)
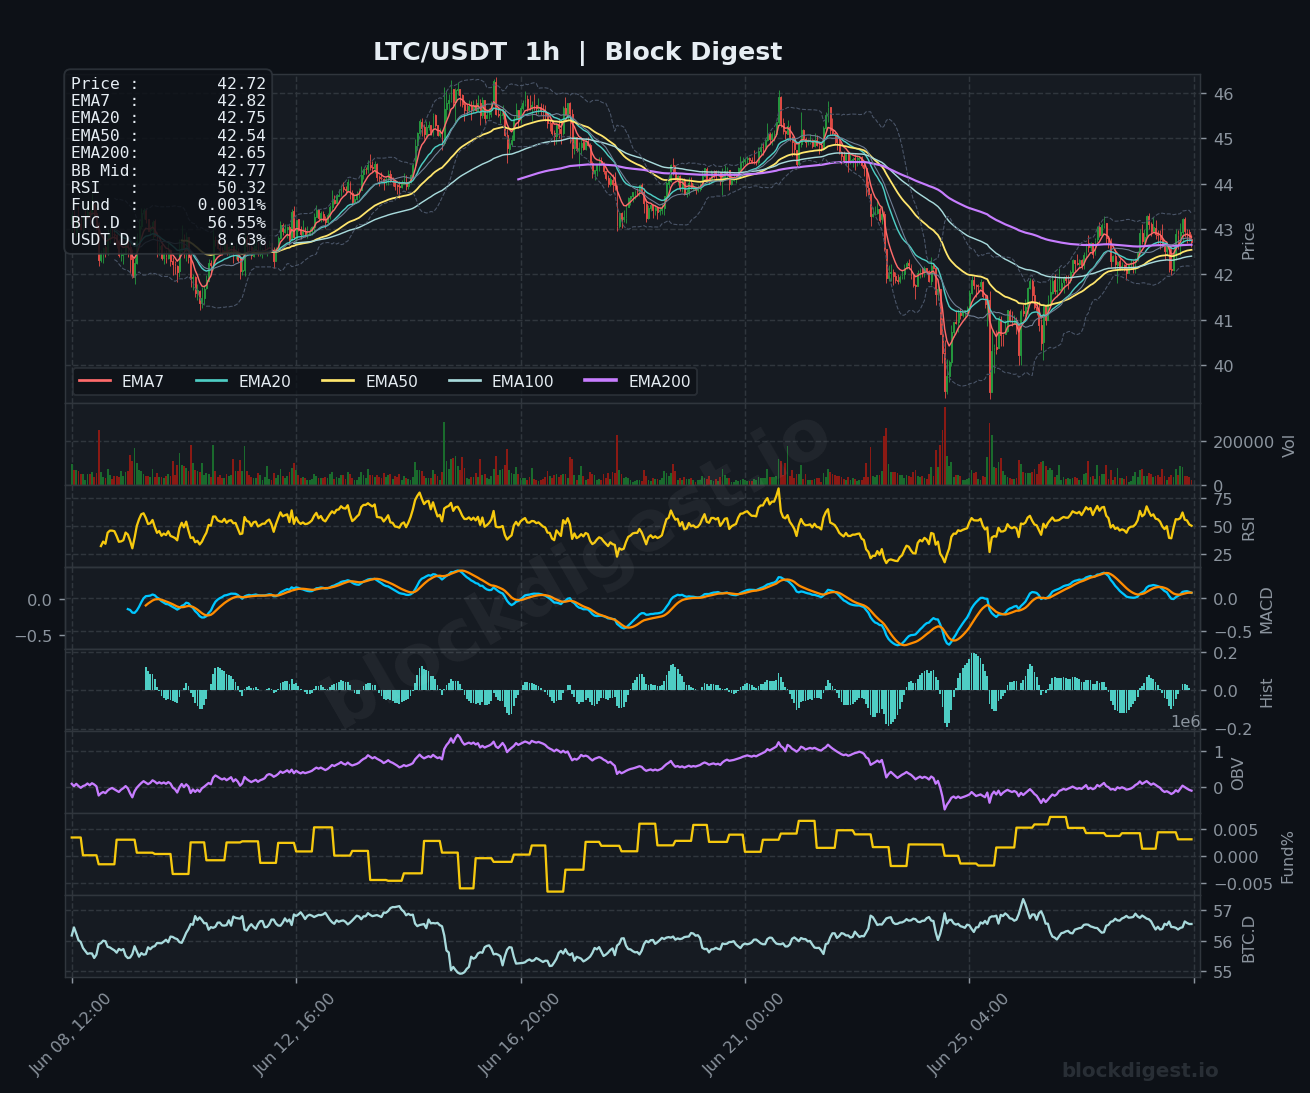
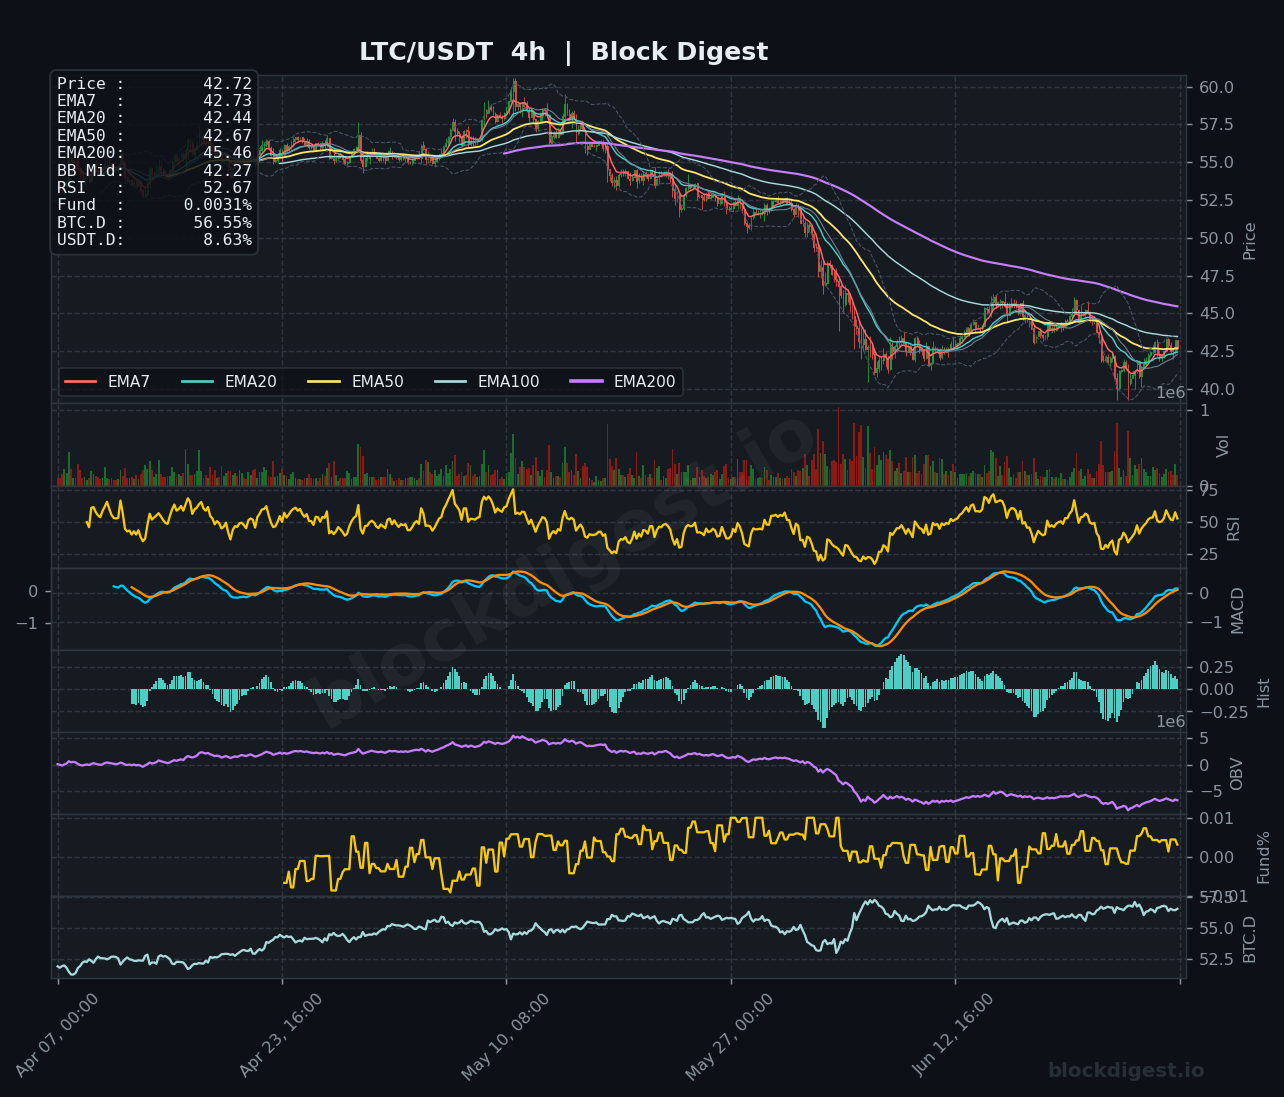
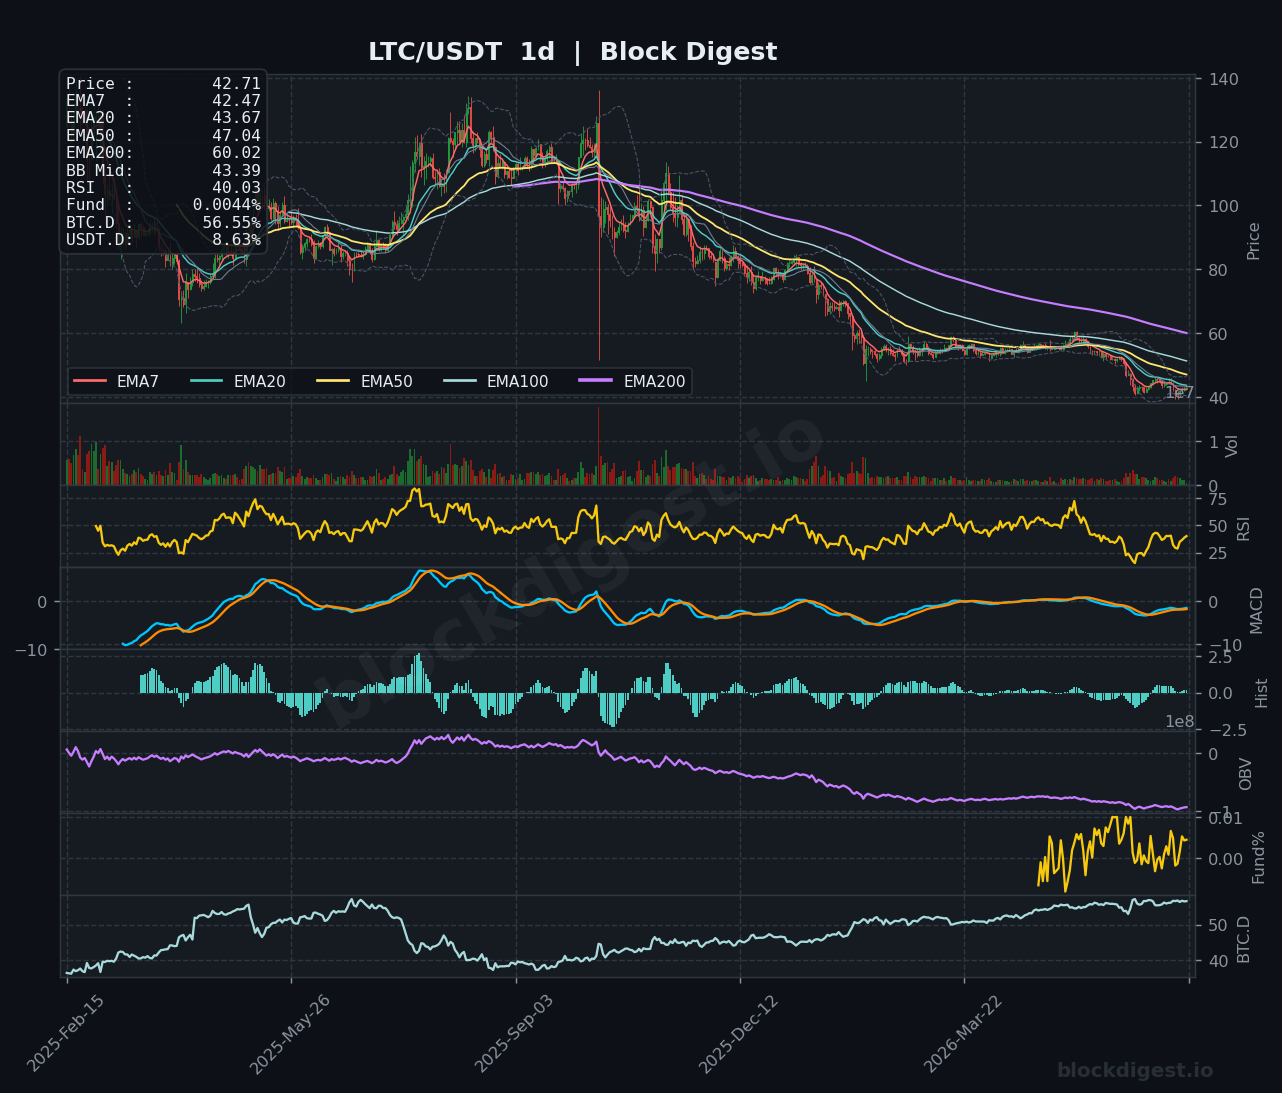
LTC is trading at $42.72, having staged a partial recovery from recent lows near $40 but still struggling for directional clarity. On the 1-hour chart, the RSI at 50.32 and a tight EMA cluster (EMA7 $42.82, EMA20 $42.75, EMA50 $42.54, EMA200 $42.65) all converging near spot price suggests a potential inflection point, with the 4-hour MACD recently attempting a bullish crossover near zero. The 4-hour RSI at 52.67 is the most constructive intermediate reading among the bearish altcoins in this review, hinting that LTC may be finding relative footing after its sharp decline from the $58+ area. However, the daily chart still paints a gloomy picture — RSI at 40.03, price below the EMA50 ($47.04) and EMA200 ($60.02), and a declining OBV — keeping the medium-term bias firmly bearish with a neutral short-term posture.
TRON (TRX)
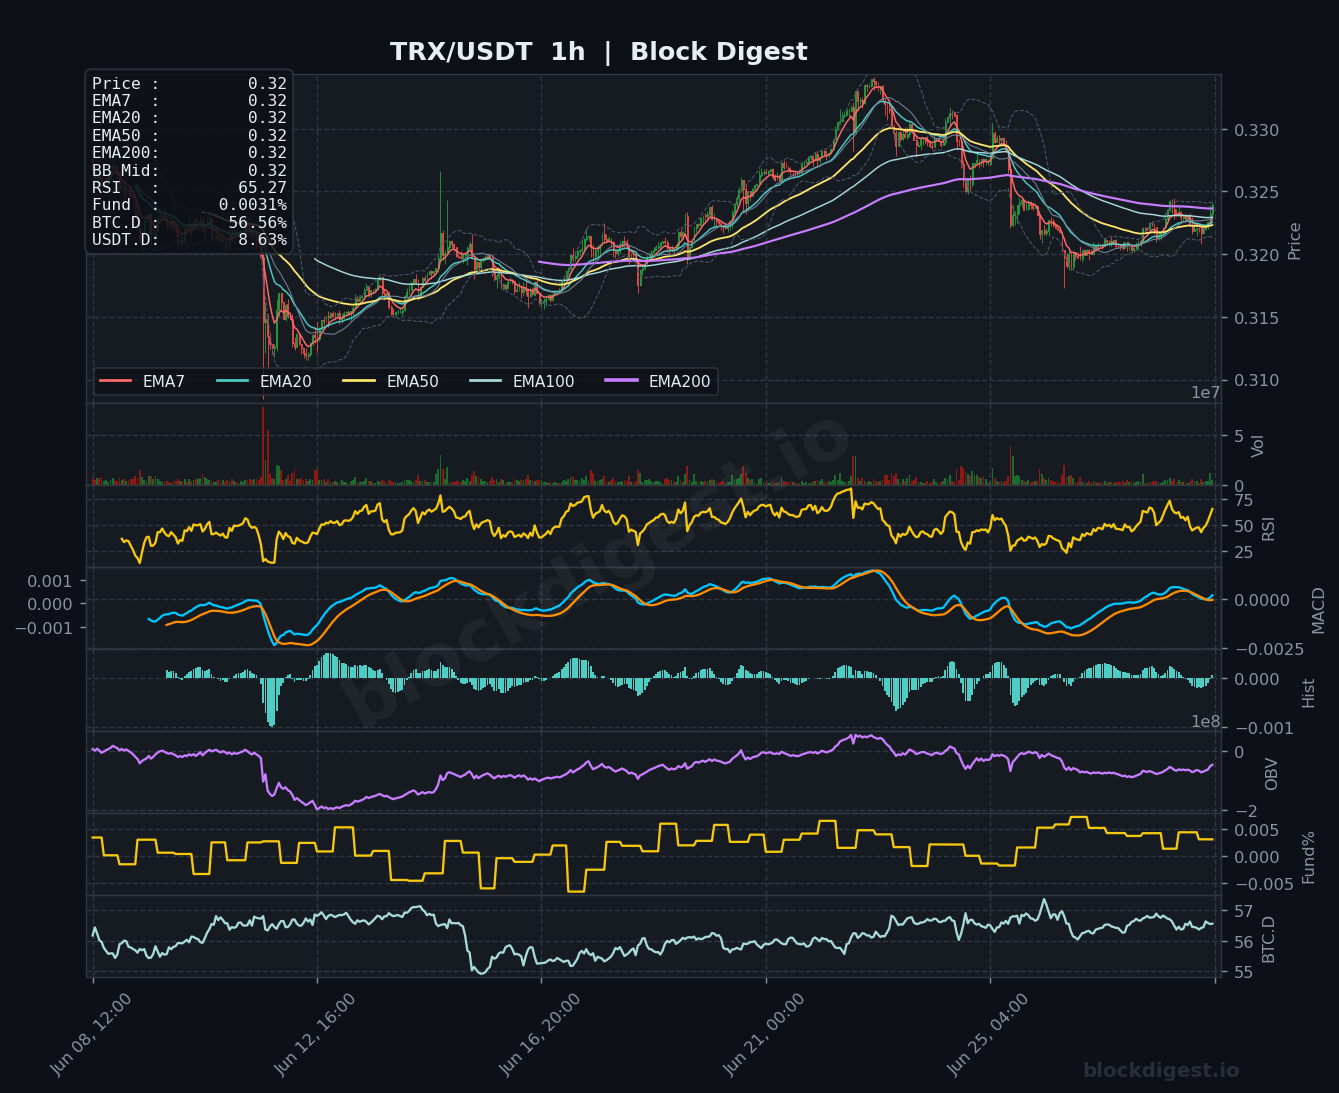
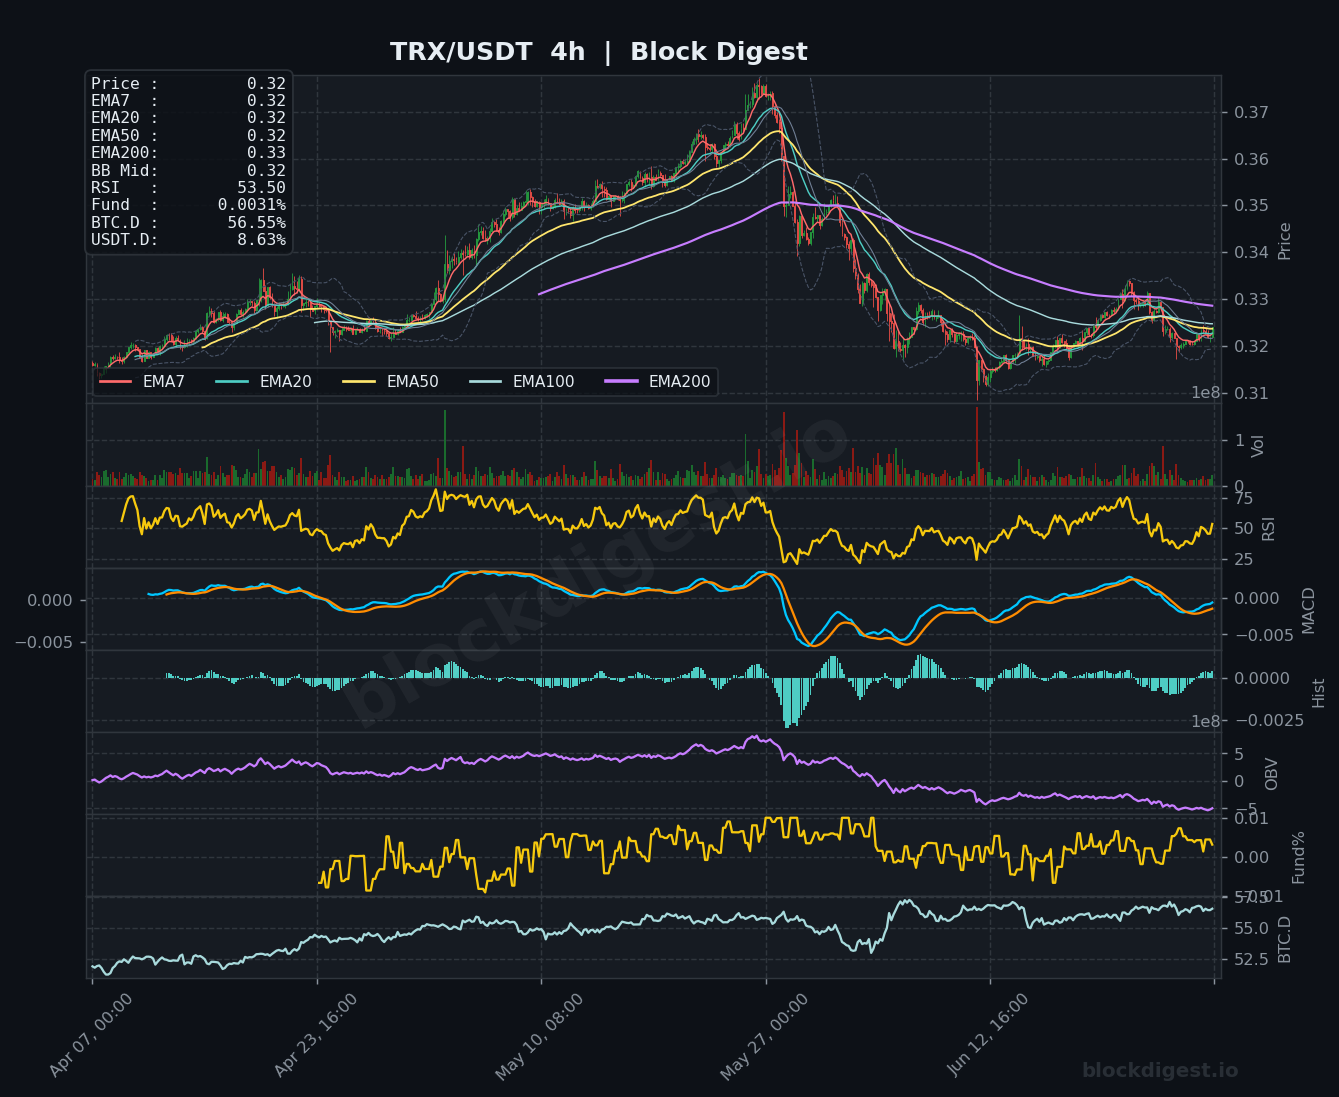
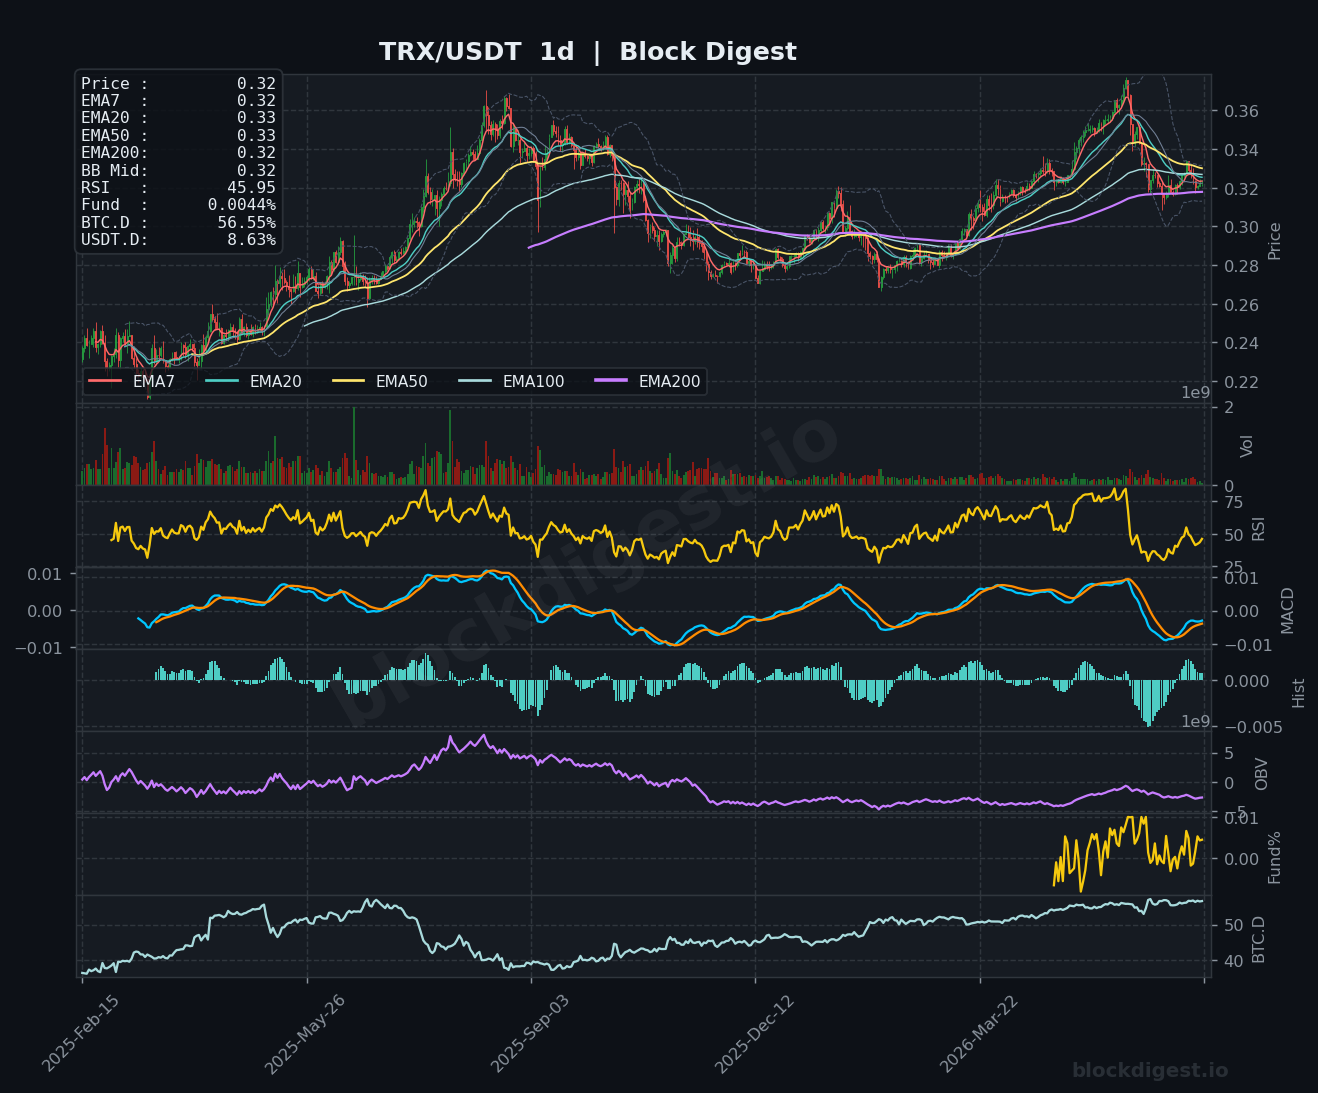
TRX stands out as the relative outperformer in today’s roundup, currently trading at $0.32 with a 1-hour RSI of 65.27 — the highest among all assets surveyed — reflecting ongoing near-term buying momentum. On the 4-hour chart, RSI sits at 53.50 with the MACD attempting to stabilize near zero after a sharp corrective phase from the $0.37 peak, and the short-term EMAs (EMA7, EMA20, EMA50) are all tightly clustered at $0.32, with the EMA200 at $0.33 serving as the next near-term resistance target. The daily chart shows TRX’s EMA200 at $0.32 is now effectively at current price — a significant level — while the daily RSI at 45.95 reflects a cooling-off from recent highs but does not yet indicate a structural breakdown. Support is well-defined at $0.315–$0.318, and TRX carries the most constructive short-term bias of the six assets covered today.
Altcoin Outlook
The broader altcoin space remains under structural pressure heading into the final days of June 2026, with BTC dominance elevated and USDT.D readings keeping the risk-appetite environment subdued. TRX is the clear standout among today’s assets — displaying the strongest near-term momentum and the most intact price structure — while DOGE and XRP present the weakest setups, with daily RSI readings approaching or in oversold territory and OBV in sustained decline across all timeframes. LTC and SOL show tentative signs of near-term stabilization, but both face formidable resistance from declining medium-term moving averages that would need to be reclaimed to shift the broader bias. Traders should watch USDT.D closely for any meaningful rotation back into risk, and monitor whether the $1.02 XRP and $0.068 DOGE support levels hold — a breakdown in either could signal renewed broad altcoin weakness.
Disclaimer: This analysis is for informational purposes only and does not constitute financial advice. Cryptocurrency markets are highly volatile and unpredictable. All trading decisions should be made based on your own research and risk tolerance. Block Digest is not responsible for any financial losses incurred as a result of acting on this content.
Stay Ahead of the Market
Follow BlockDigest for crypto market intelligence, research and real-time updates.


