
Market Overview
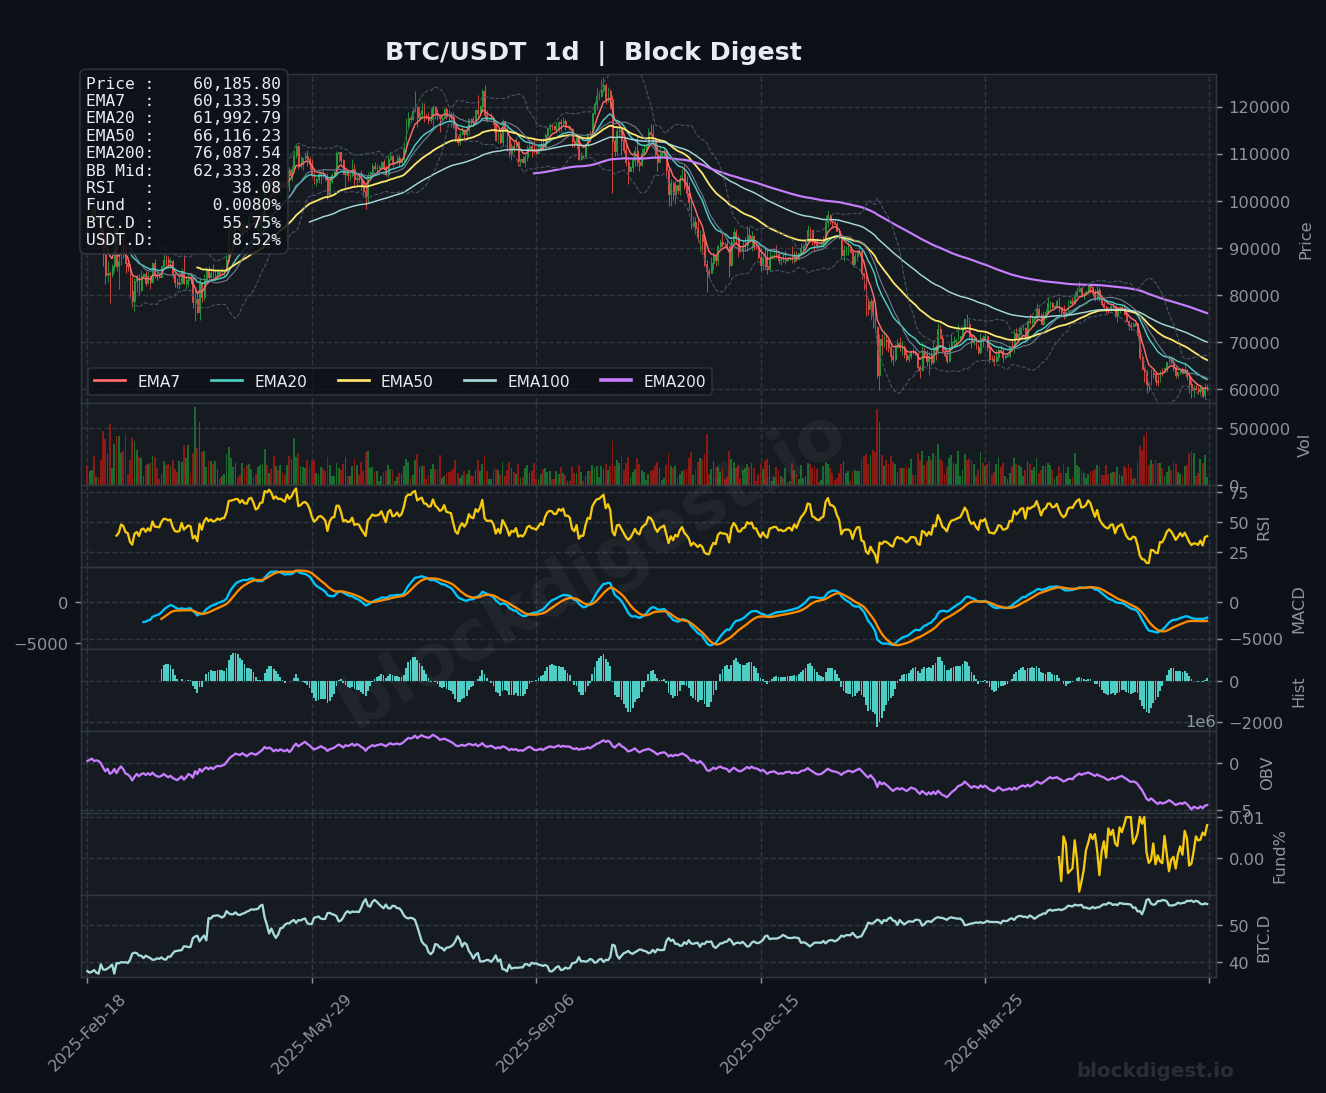
Bitcoin is trading at approximately $60,185 as of July 2, 2026, navigating a structurally damaged macro environment following a decline of more than 50% from its October 2025 peak near $126,000. On the daily timeframe, price is currently sitting well below all major EMAs — the EMA20 at $61,992, EMA50 at $66,116, EMA200 at $76,087 — confirming that the dominant trend remains firmly bearish. Price is also trading below the Bollinger Band midline of $62,333 on the daily chart, keeping BTC in lower-band territory and signaling persistent selling pressure. The recent 3% intraday bounce offers some short-term relief, but does not yet constitute a structural reversal.
Multi-Timeframe Confluence
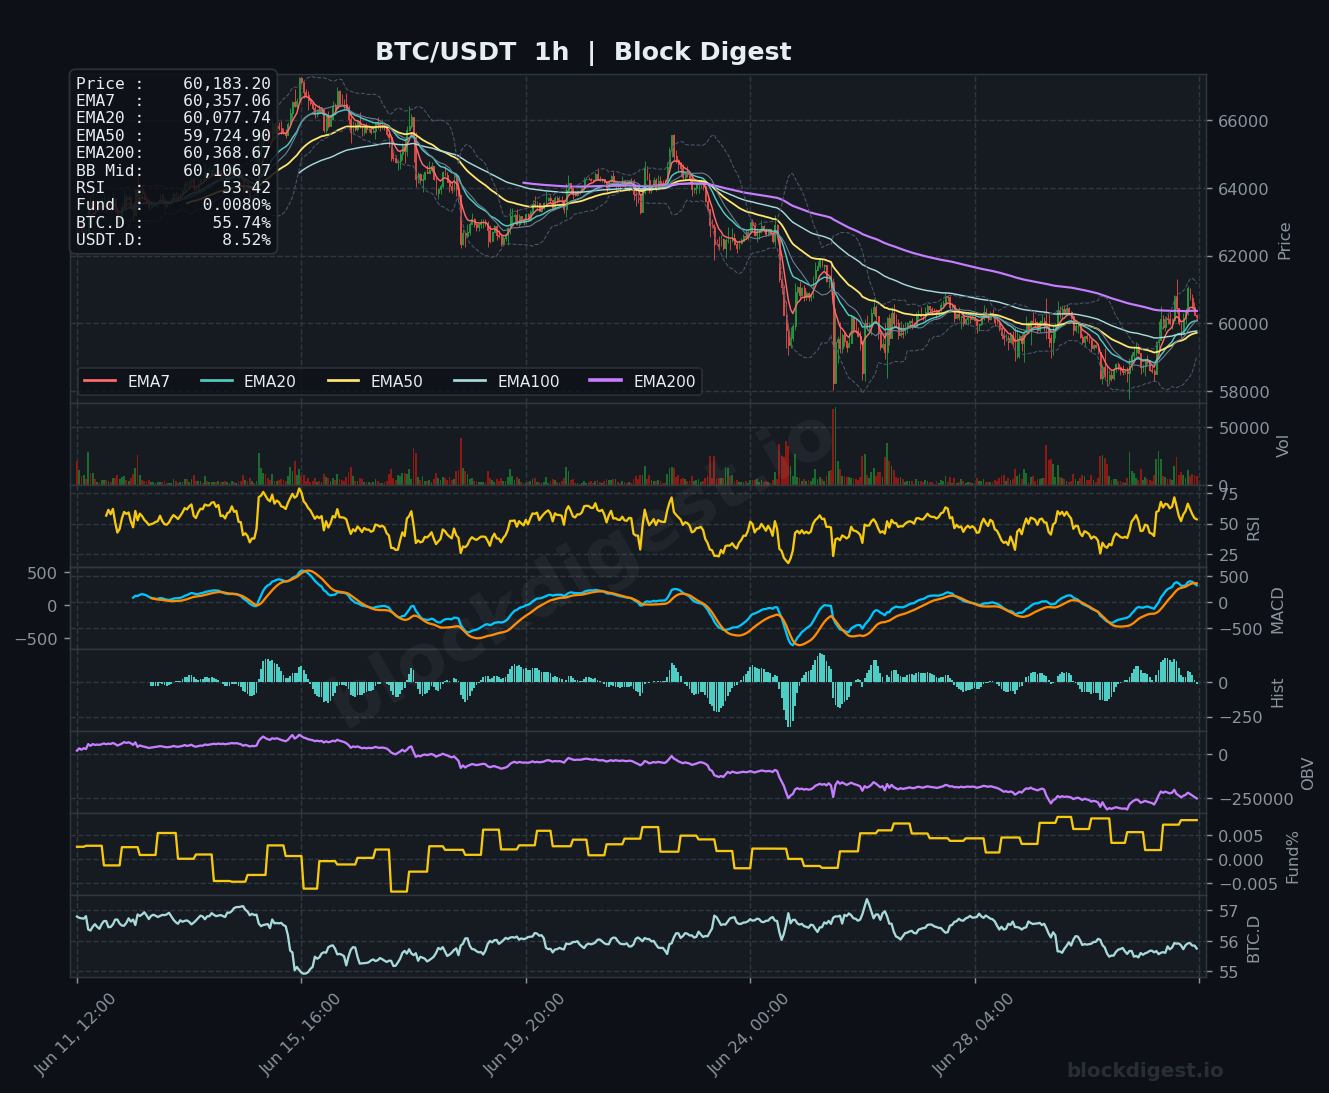
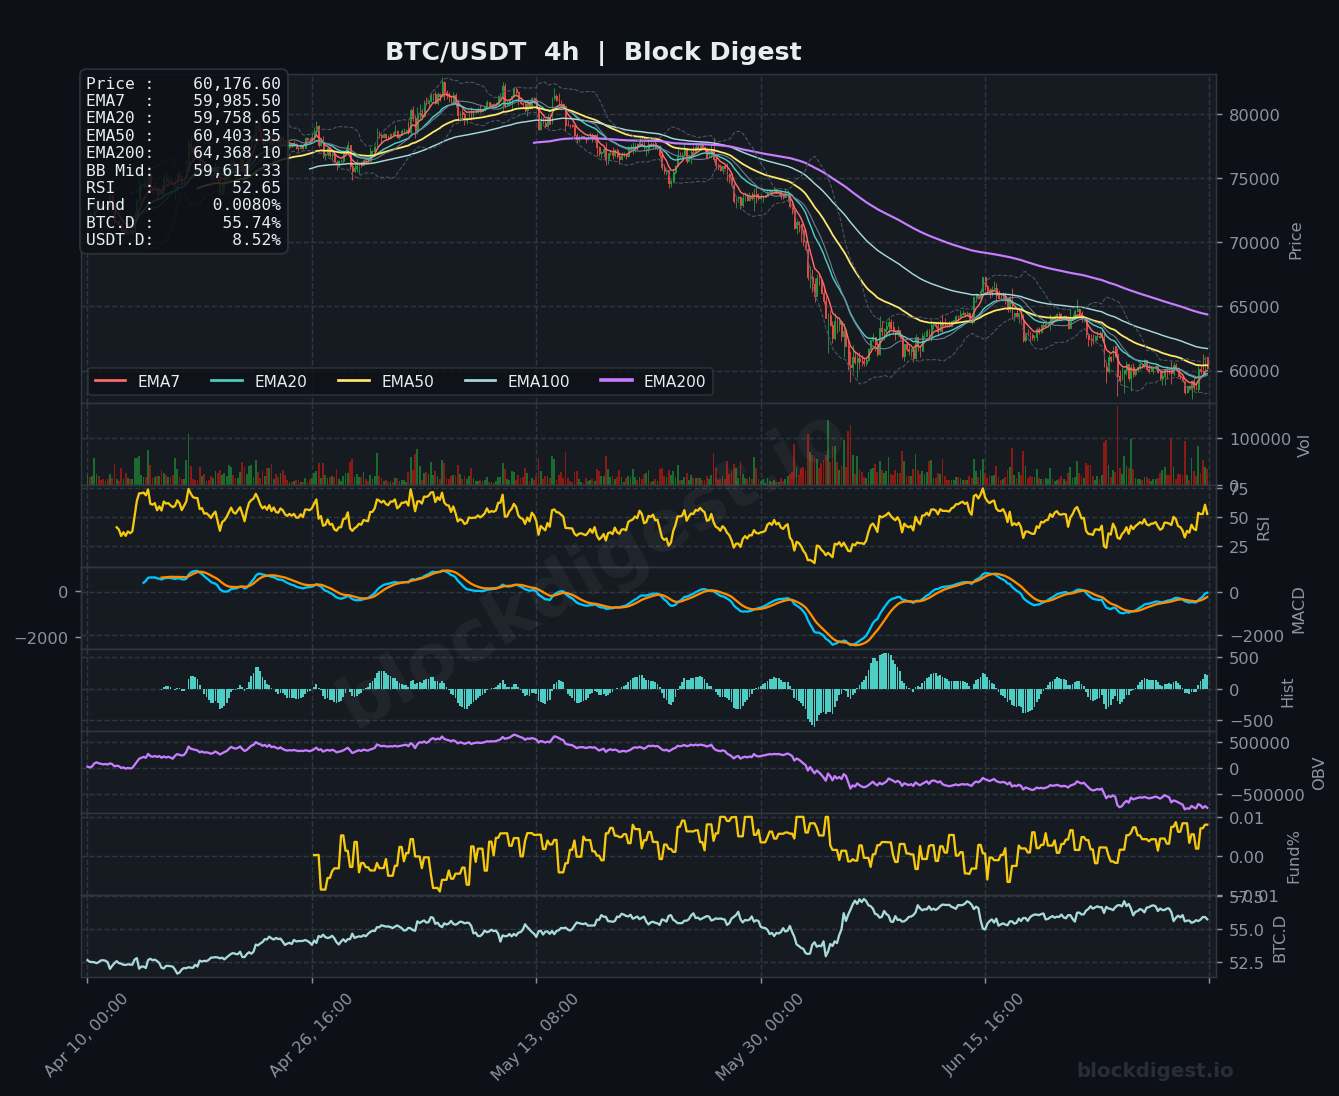
On the 1-hour chart, price has bounced sharply off recent lows near $58,200 and is attempting to reclaim the cluster of short-term EMAs (EMA7 at $60,357, EMA20 at $60,077, EMA50 at $59,724), which is mildly constructive in the near term. However, the 4-hour chart tells a more cautious story — price remains below the EMA50 at $60,403 and massively below the EMA200 at $64,368, with all EMAs in a bearish descending stack. The daily timeframe reinforces this bearish structure with every major moving average acting as overhead resistance. The brief alignment of the 1-hour EMAs into a potential bullish curl is directly contradicted by the higher timeframe downtrend, suggesting any bounce is likely corrective rather than impulsive.
Key Levels to Watch
- Resistance: $60,400 — the 4-hour EMA50, which has capped recent recovery attempts and represents the first meaningful hurdle for bulls.
- Resistance: $61,992 — the daily EMA20, a dynamic level that has consistently rejected price during the broader downtrend and would need to be reclaimed for any credible recovery narrative.
- Resistance: $64,368 — the 4-hour EMA200, a macro resistance zone that defined the lower boundary of the prior consolidation range before the June breakdown.
- Support: $59,724 — the 1-hour EMA50, which is now acting as immediate intraday support following the recent bounce; losing this level would re-expose lower prices.
- Support: $58,200 — the recent swing low from the late-June capitulation sell-off; a retest and break of this level would accelerate downside momentum.
- Support: $56,000–$57,000 — a broader psychological and structural demand zone that aligns with prior consolidation lows; the next meaningful area of buyer interest below current price.
Momentum & On-Chain Signals
The 1-hour RSI at 53.42 and 4-hour RSI at 52.65 are both hovering near the neutral 50 level, reflecting indecision rather than directional conviction following the bounce. The daily RSI at 38.08 is the most telling reading — it remains in bearish territory but has not yet reached the oversold threshold near 30, suggesting further downside room exists before a technical exhaustion point is reached. MACD on the 4-hour chart shows the signal lines beginning to converge near the zero line, with a modestly positive histogram, though this is still within the context of a macro bearish cross. The OBV on both the 4-hour and daily charts continues to trend downward, confirming persistent distribution and a lack of genuine accumulation even during the current bounce. The funding rate at 0.0080% is mildly positive, indicating slight long bias among perpetual futures traders — this could pose a short-term headwind if a flush of leveraged longs occurs.
BTC Dominance & Market Sentiment
BTC dominance sits at 55.74%–55.75%, a relatively elevated reading that suggests capital is not rotating into altcoins in any significant way — investors appear to be either holding BTC or moving to stablecoins rather than diversifying into risk-on assets. USDT dominance at 8.52% remains elevated, consistent with a risk-off market posture where participants are maintaining significant dry powder on the sidelines. Together, these readings reinforce a cautious macro sentiment: BTC is not benefiting from a flight to quality within crypto, and the broader market is not in an expansionary risk-on cycle.
Risk Scenarios
- Bullish case: A decisive 4-hour close above $60,400 (the 4-hour EMA50), followed by a reclaim of $61,992 (daily EMA20) on meaningful volume, would shift the short-term bias to neutral-to-bullish, with an initial target toward the $63,500–$64,368 resistance zone.
- Bearish case: Failure to hold the $59,724 level on a retest, particularly if accompanied by declining volume and a rollover in the 1-hour MACD, would likely signal a return toward the $58,200 swing low — and a break below that opens the door to the $56,000–$57,000 demand zone.
Outlook
The overall bias remains cautiously bearish, with BTC trapped in a multi-month downtrend and all higher-timeframe moving averages stacked bearishly above current price. The near-term bounce is technically plausible given oversold short-term conditions and the bounce off $58,200 lows, but the weight of evidence — declining OBV, sub-40 daily RSI, record ETF outflows, and macro EMA resistance — does not yet support a conviction long. The critical trigger to watch over the next 24–48 hours is whether BTC can sustain trade above $60,000 and reclaim the 4-hour EMA50 at $60,403; failure here would quickly reintroduce downside risk. Until the daily EMA20 near $61,992 is reclaimed with conviction, this market remains one for cautious positioning and disciplined risk management.
Disclaimer: This analysis is for informational purposes only and does not constitute financial advice. Cryptocurrency markets are highly volatile and unpredictable. All trading decisions should be made based on your own research and risk tolerance. Block Digest is not responsible for any financial losses incurred as a result of acting on this content.
Stay Ahead of the Market
Follow BlockDigest for crypto market intelligence, research and real-time updates.


