
Author: BD Research Desk
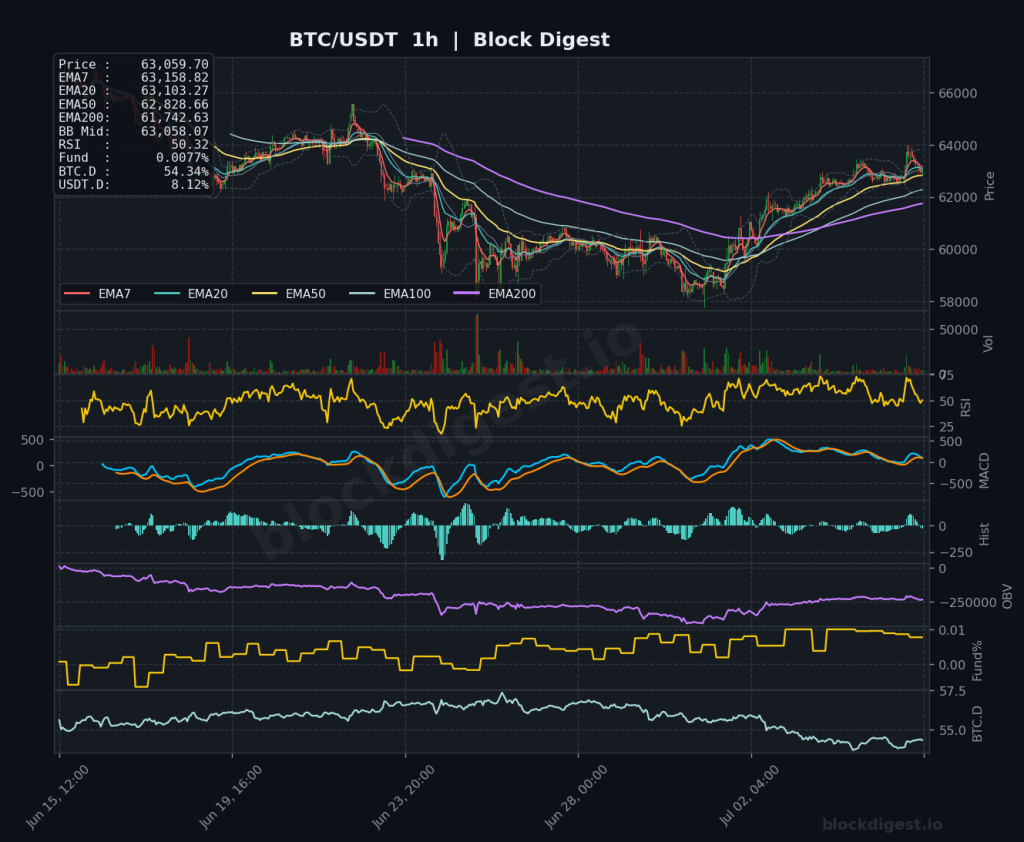
Bitcoin Daily Analysis: Bitcoin at $63K Between Key Moving Averages
Market Overview Bitcoin is currently trading at $63,059.70, sitting just above the Bollinger Band midline on the daily chart ($61,916.33) while remaining well beneath the descending EMA50 ($65,715.33) and far below the EMA200 ($75,596.59). The dominant daily trend remains bearish, with price having declined from all-time highs and all major EMAs stacked in a bearish...
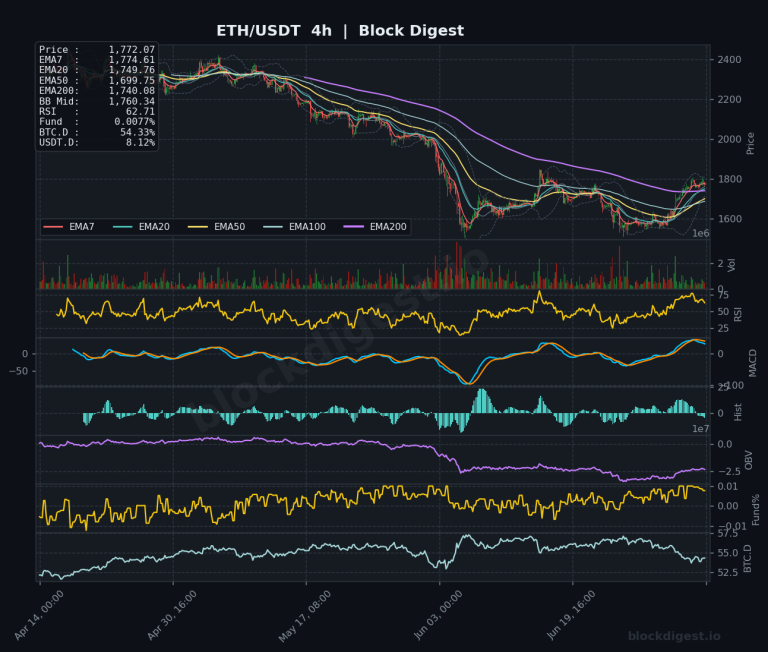
Ethereum Weekly Analysis: Ethereum Closes $1,772 with 10% Weekly Gain
Weekly Market Overview Ethereum closed the week near $1,772, posting a gain of approximately 10% week-over-week — a meaningful recovery from the multi-month lows carved out in late May and early June. Price action has been constructive, with ETH pushing back above the $1,700 psychological handle and reclaiming several short-term moving averages on the 4-hour...
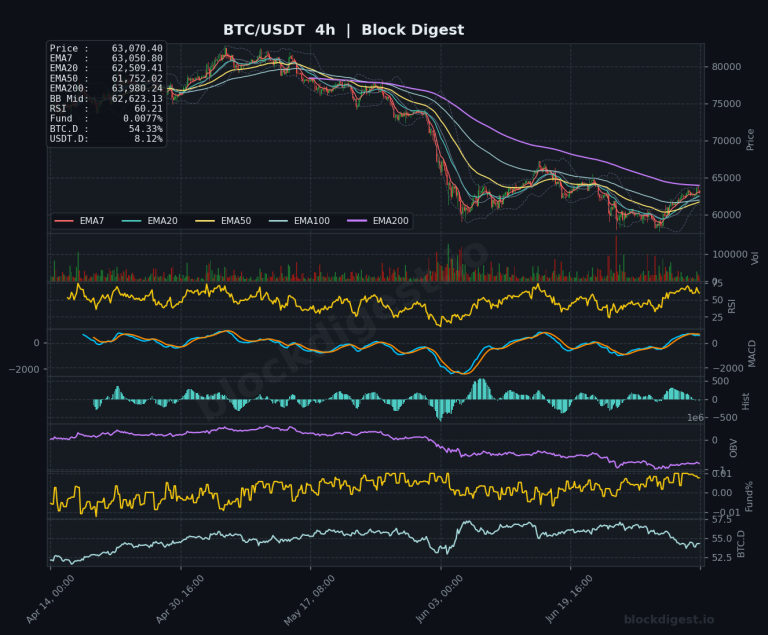
Bitcoin Weekly Analysis: Bitcoin Capitulation Wick at $57,950, Recovery to $63K
Weekly Market Overview Bitcoin endured one of its most punishing monthly closes in recent memory, shedding approximately 20% through June before staging a tentative mid-week recovery. Price briefly touched a 652-day low near $57,950 before rebounding sharply through the July 4th holiday session, reclaiming the $63,000 handle on thin volume. The weekly candle structure reflects...
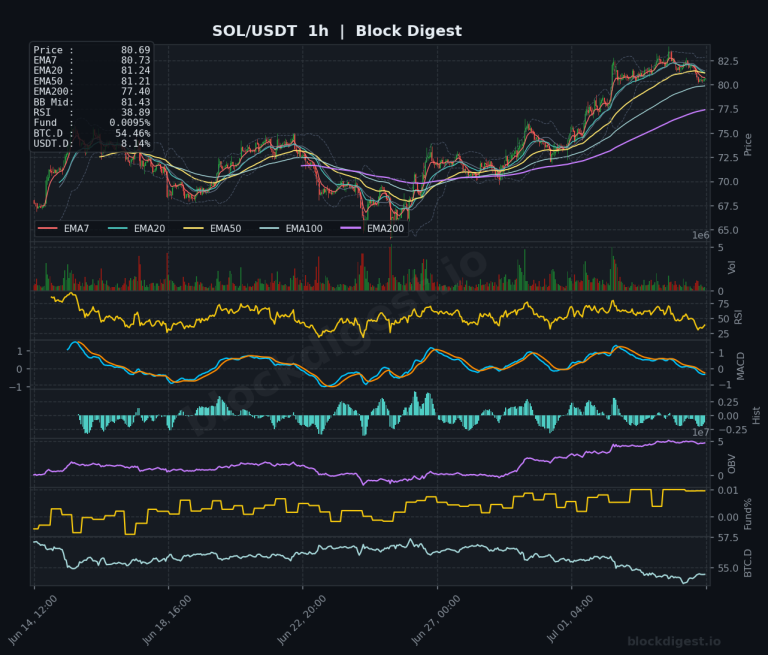
Altcoin Daily Analysis: BTC Dominance 54.46% Caps Altcoin Upside
Market Context The altcoin market is navigating a cautious recovery phase as BTC dominance sits at 54.46–54.48%, reflecting a still-elevated Bitcoin preference that continues to cap broad altcoin upside. USDT.D at 8.14% suggests meaningful sidelined capital remains on the bench, though the metric has been drifting lower — a tentative signal that risk appetite is...
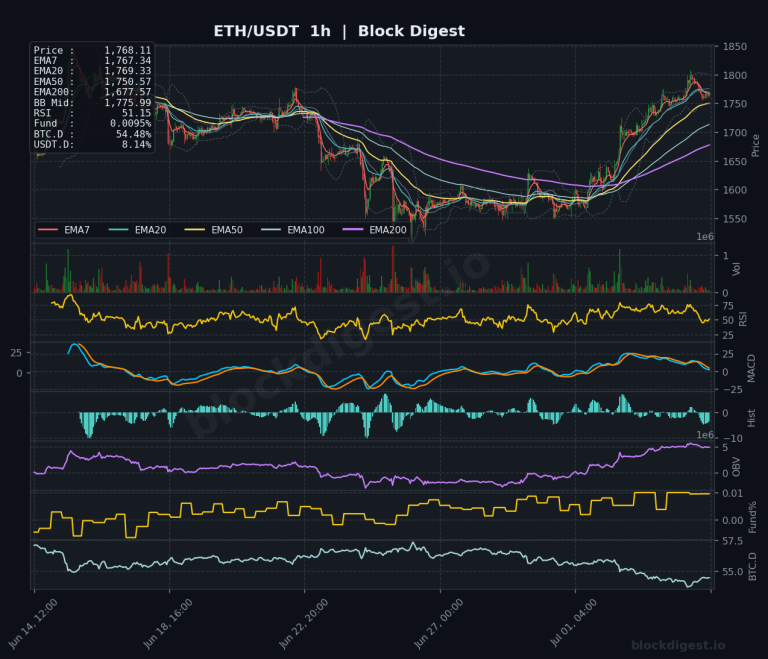
Ethereum Daily Analysis: ETH consolidates at $1,767 above EMA7 support
Market Overview ETH/USDT is currently trading at approximately $1,767–$1,768, consolidating near the upper end of its recent recovery range after a significant June selloff that saw prices bottom near the $1,540–$1,560 zone. On the daily timeframe, price has reclaimed both the EMA7 ($1,709) and EMA20 ($1,692) from below, signaling improving short-term structure, but remains firmly...
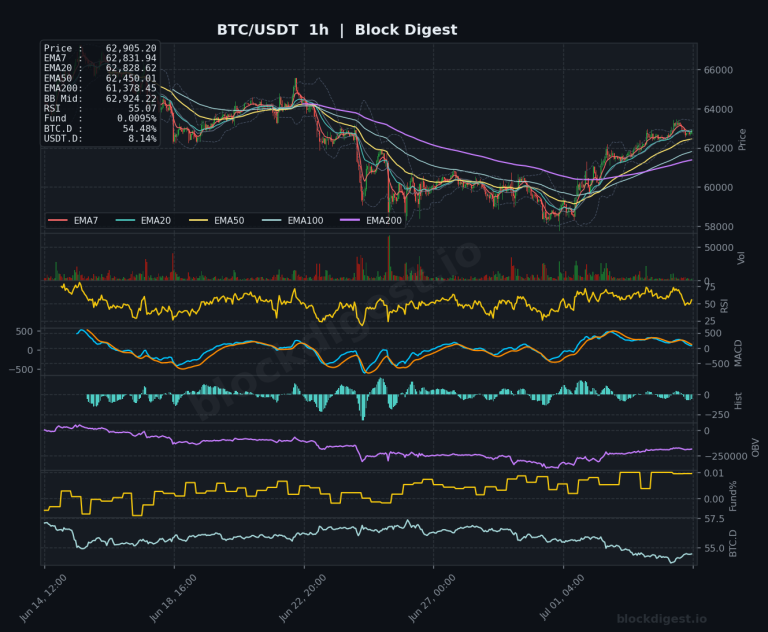
Bitcoin Daily Analysis: Consolidation at $62.9K Below EMA50 Critical Level
Market Overview Bitcoin is trading at approximately $62,902–$62,905 as of July 5, 2026, consolidating near a critical inflection point following a significant bear market drawdown from the $126,000 all-time high reached in October 2025. On the daily timeframe, price remains firmly below the EMA50 ($65,795) and EMA200 ($75,712), confirming that the macro trend structure is...
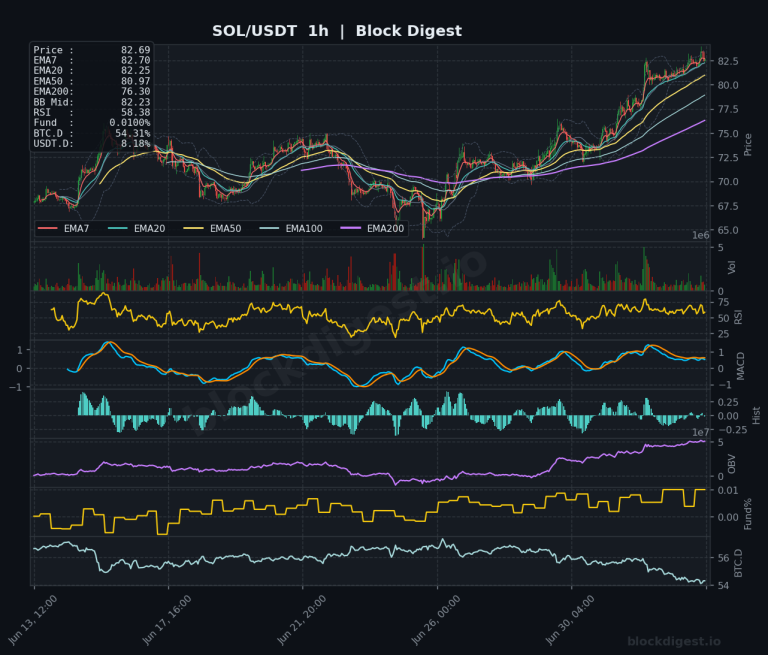
Altcoin Daily Analysis: Bitcoin dominance elevated as altcoins gain regulatory tailwind
Market Context Bitcoin dominance sits at 54.31% — elevated but showing a gradual downtrend on the shorter timeframes — while USDT dominance at 8.18% signals that a meaningful portion of capital remains on the sidelines, tempering the enthusiasm behind this week’s altcoin bounce. The Digital Asset Market CLARITY Act clearing the Senate Banking Committee has...
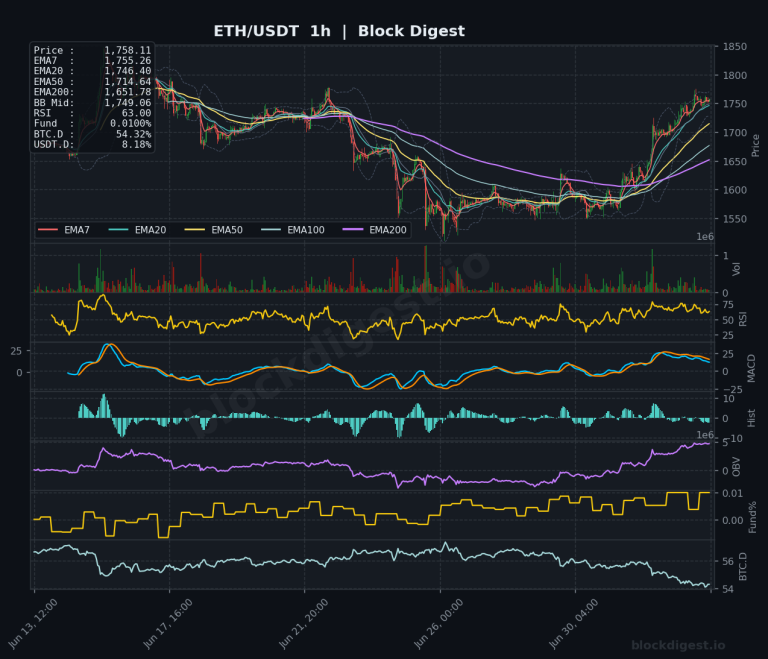
Ethereum Daily Analysis: Ethereum bounces to $1,758 above EMA7 resistance
Market Overview Ethereum is trading at $1,758.30 as of July 4, 2026, posting a notable recovery after weeks of sustained selling pressure that pushed price into the mid-$1,500s. On the daily timeframe, ETH remains structurally bearish over the longer term — trading well below the EMA200 ($2,262.70) and EMA50 ($1,806.57) — but the recent bounce...
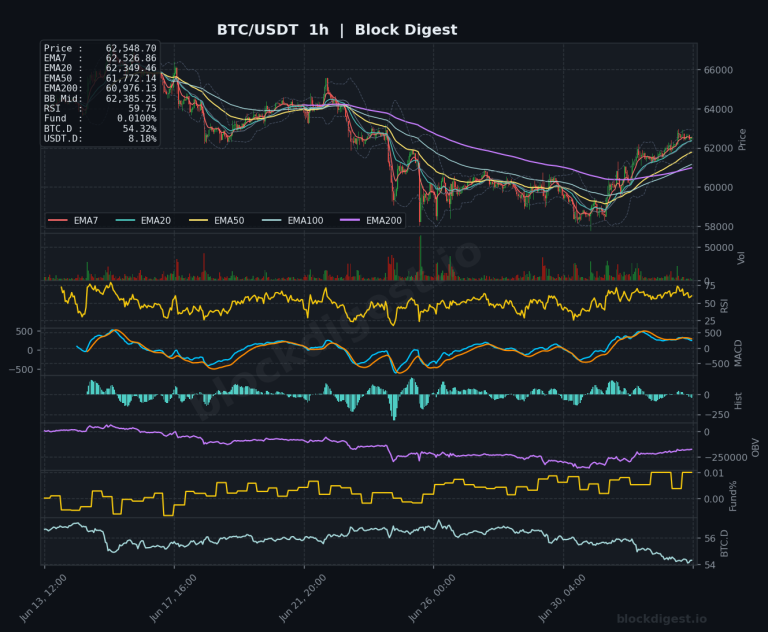
Bitcoin Daily Analysis: Bitcoin at $62.5K Tests EMA20 Resistance
Market Overview Bitcoin is trading at approximately $62,548–$62,677 as of July 4, 2026, having staged a meaningful recovery from multi-month lows near $58,000 seen in late June. On the daily timeframe, price remains in a well-defined downtrend, trading well below the EMA50 ($65,892), EMA200 ($75,850), and the descending EMA100, reflecting sustained macro bearish structure. However,...
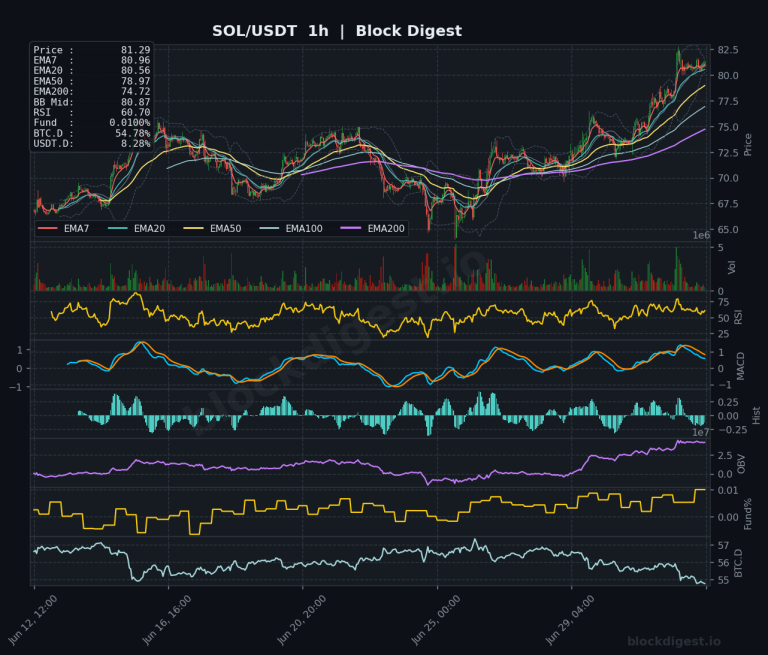
Altcoin Daily Analysis: BTC Dominance Slides to 54.78%, Altcoins Show Recovery Signs
Market Context The broader altcoin market is showing early signs of recovery as BTC dominance slides to approximately 54.78%, a meaningful pullback from recent highs that is beginning to free up capital for rotation into major altcoins. USDT dominance at 8.28% remains elevated but appears to be losing upward momentum, suggesting that sidelined capital may...
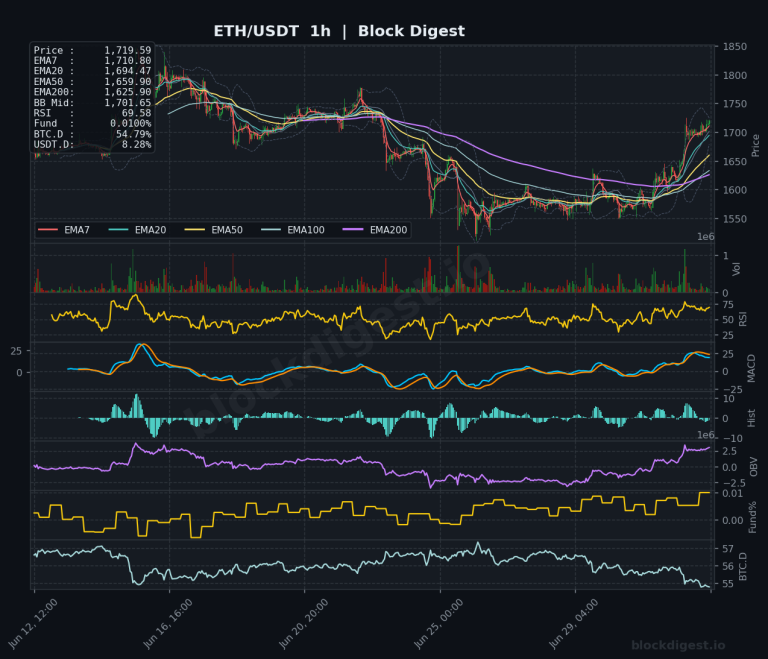
Ethereum Daily Analysis: Ethereum breaks above key EMAs with 5.38% gain
Market Overview Ethereum is trading at $1,719.60, posting a sharp 5.38% single-day gain that has pushed price decisively above the 1-hour and 4-hour short-term EMAs in a broad short-squeeze rally. On the 1-hour chart, ETH has reclaimed all key intraday EMAs — with price sitting above the EMA7 ($1,710.80), EMA20 ($1,694.47), EMA50 ($1,659.90), and EMA200...
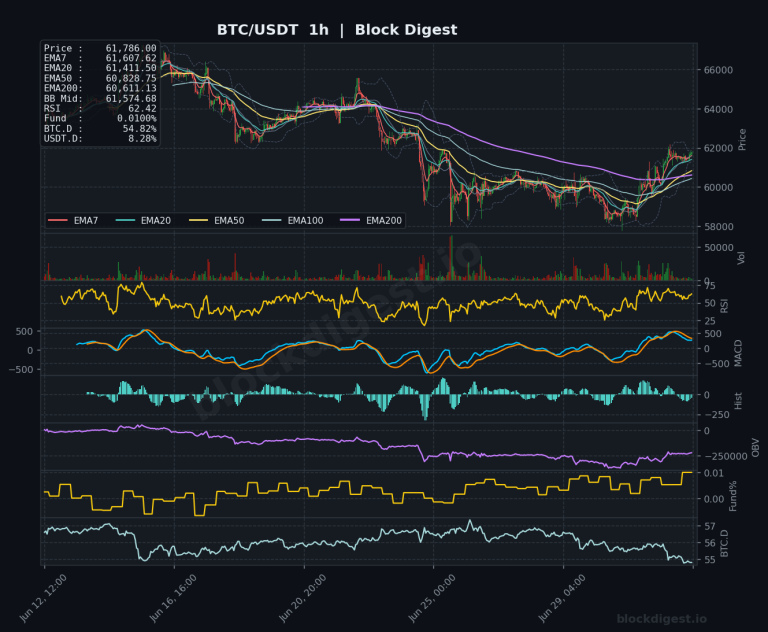
Bitcoin Daily Analysis: Bitcoin at $61.7K Below Key EMAs
Market Overview Bitcoin is trading at approximately $61,776–$61,786 as of July 3, 2026, having recovered meaningfully off recent lows near $58,000 but remaining well below its all-time high of $126,080. On the daily timeframe, the dominant structure is bearish: price sits below the EMA20 ($62,088), EMA50 ($65,997), and the steeply declining EMA200 ($75,965), confirming a...