
Daily Analysis
Daily Analysis Has Migrated to Our Weekly Reports
To deliver higher-density analysis and deeper market insights, BlockDigest has evolved its research framework. We have transitioned from our Daily Analysis coverage into a single, consolidated Weekly Report published every Monday. Rather than fragmenting our research across quick daily snapshots for BTC, ETH, and Altcoins, we have unified these efforts into a single, comprehensive intelligence...
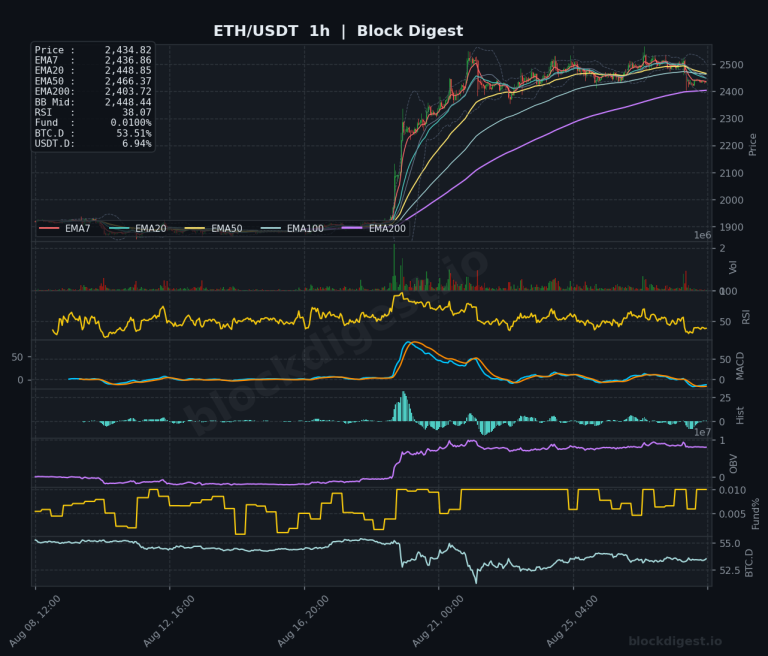
ETH Daily Analysis — 2026-08-29
Market Overview Ethereum is currently navigating a consolidation phase following a significant impulsive move, trading at $2,434.83. On the daily timeframe, the asset remains in a strong structural uptrend, holding comfortably above all major EMAs, including the EMA200 at $2,148.79 and the EMA50 at $2,072.93. While the price is currently positioned below the daily Bollinger...
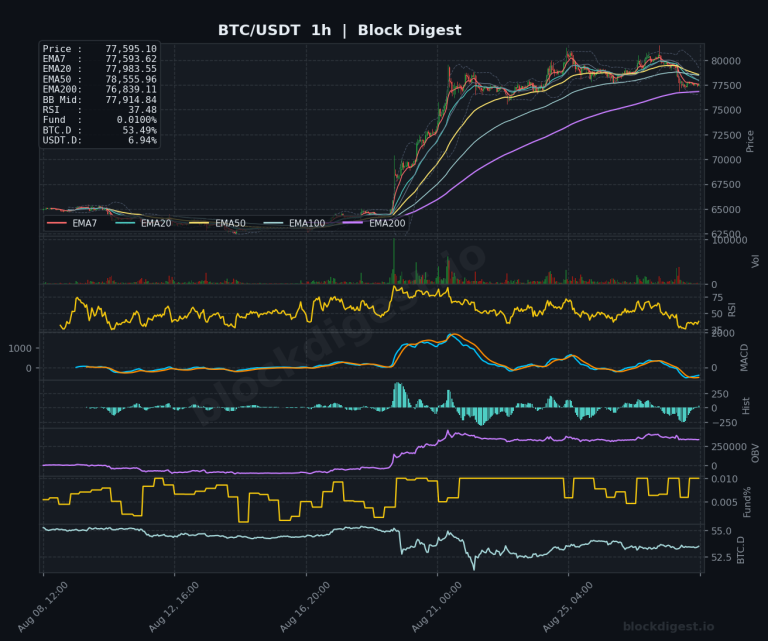
BTC Daily Analysis — 2026-08-29
Market Overview Bitcoin is currently navigating a critical consolidation phase, trading at $77,595 after a period of aggressive expansion. On the daily timeframe, the asset remains firmly above its key EMAs, with the price holding well above the 200-day EMA of $72,109, signaling a dominant bullish structure. While the price is currently testing the mid-range...
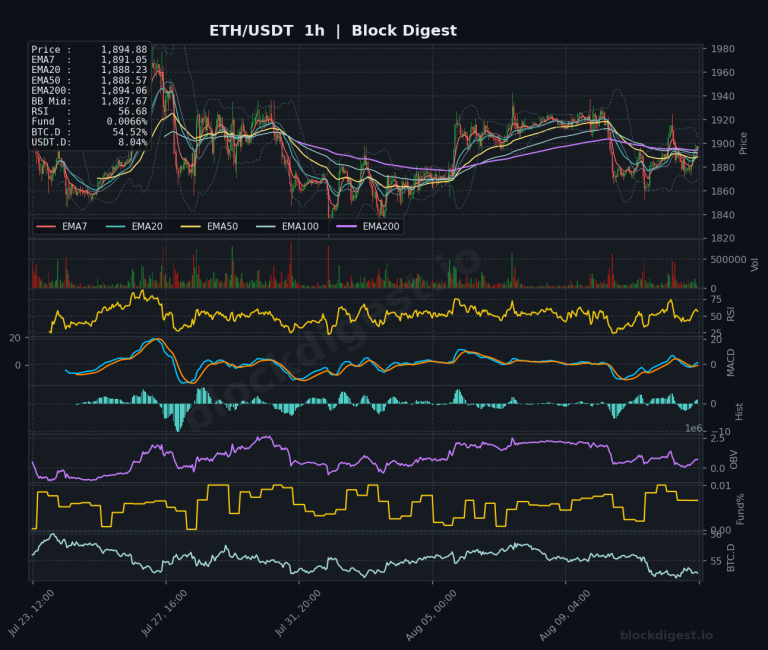
ETH Daily Analysis — 2026-08-13
Market Overview ETH/USDT is currently trading around $1,894–$1,915, holding a delicate position near the Bollinger Band midline on the daily chart at $1,893.18. Price has staged a meaningful recovery from the multi-month lows seen earlier this year, but remains deeply suppressed beneath the daily EMA200 at $2,128.96, which continues to act as a formidable macro...
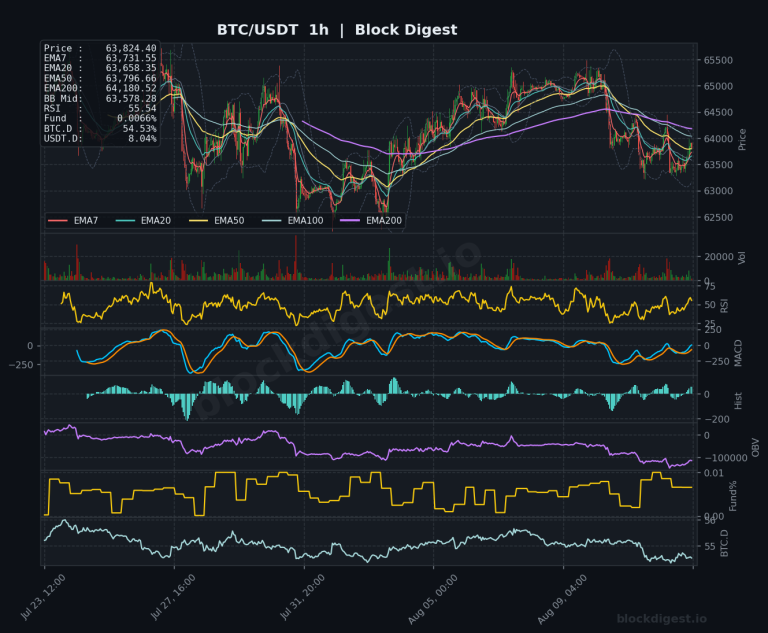
BTC Daily Analysis — 2026-08-13
Market Overview Bitcoin is trading at $63,824 as of August 13, 2026, caught in a structurally weak position on the daily timeframe after a prolonged downtrend from highs well above $100,000. Price is currently trading beneath all major daily EMAs — the EMA7 at $63,957, EMA20 at $64,077, EMA50 at $64,511, and the EMA200 sitting...
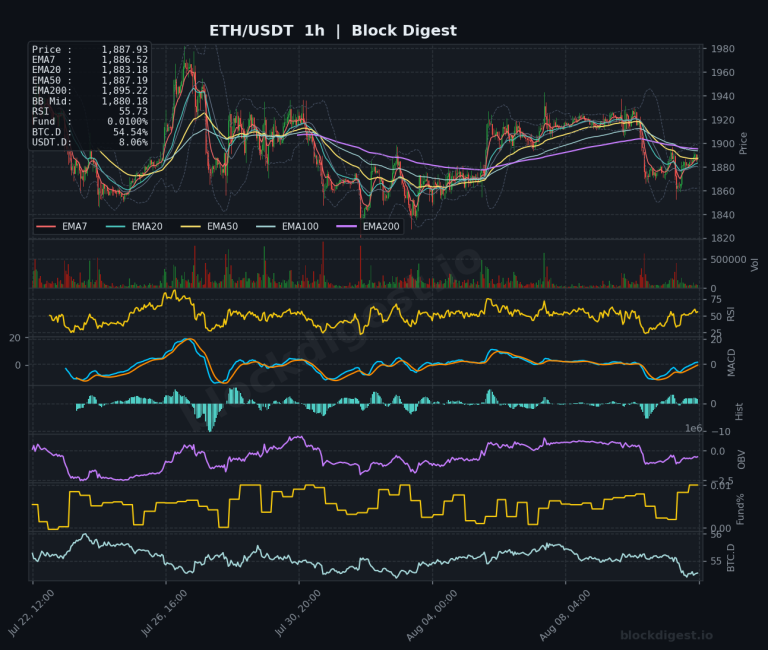
ETH Daily Analysis — 2026-08-12
Market Overview Ethereum is trading at $1,887.93 as of August 12, 2026, navigating a technically precarious zone as price hovers just below several converging EMA barriers. On the daily timeframe, ETH remains well beneath its EMA200 at $2,130.84 — a stark reminder of the dominant macro downtrend that has defined price action since mid-2025. However,...
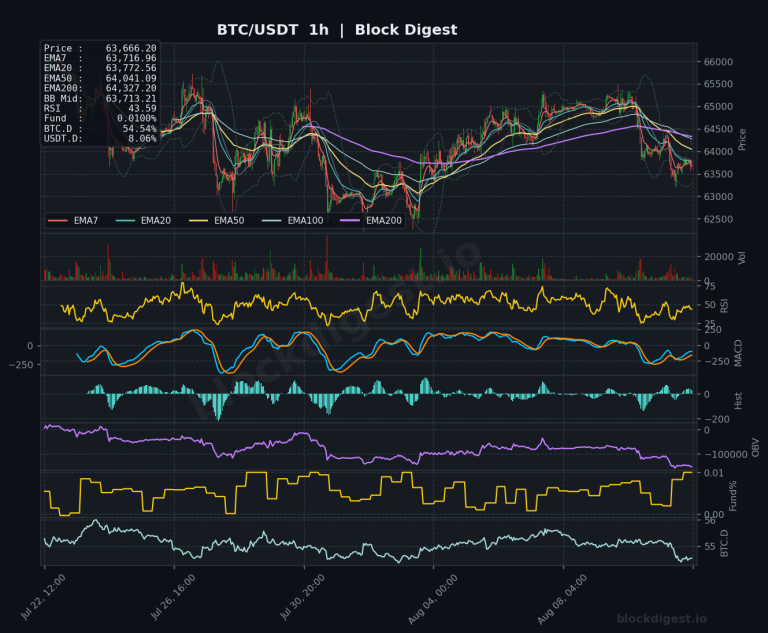
BTC Daily Analysis — 2026-08-12
Market Overview Bitcoin is trading at $63,666, sitting below a tightly clustered band of daily EMAs that are compressing between $64,054 (EMA7) and $64,547 (EMA50), with the 200-day EMA looming far above at $72,001 — a clear reminder that the broader trend remains corrective. Price is currently below the Bollinger Band midline of $64,087 on...
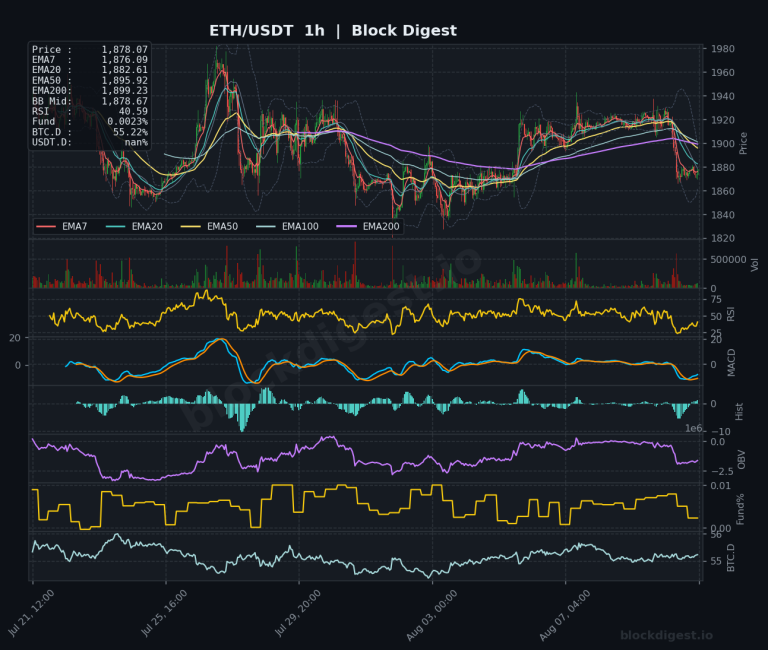
ETH Daily Analysis — 2026-08-11
Market Overview Ethereum is trading at $1,878.30 as of August 11, 2026, sitting in a technically precarious position after a prolonged downtrend from highs above $4,500. On the daily timeframe, price remains well beneath the EMA200 at $2,133.15 — a level that has acted as a formidable overhead ceiling throughout the broader bear structure —...
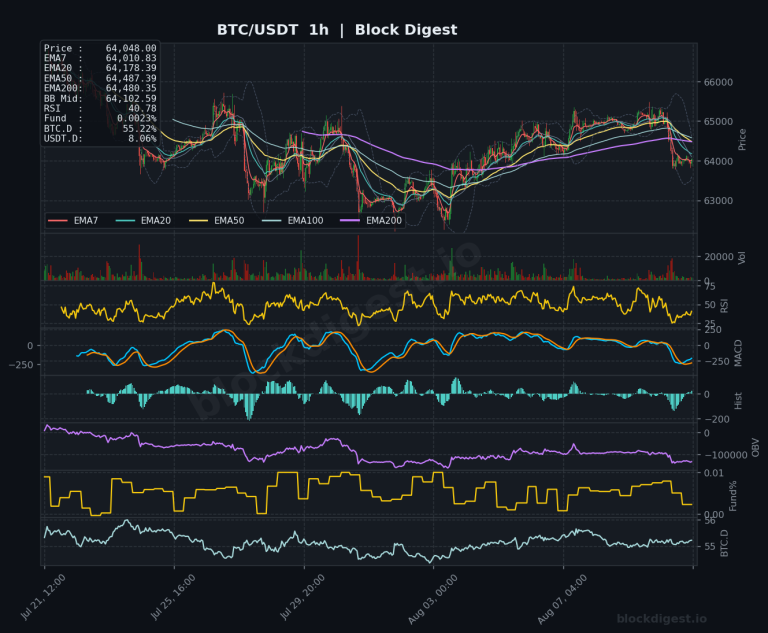
BTC Daily Analysis — 2026-08-11
Market Overview Bitcoin is currently trading at $64,048, caught in a tightening range as the market digests a recovery from early-August lows near $62,000. On the daily timeframe, price remains in a structurally bearish configuration — trading well below the EMA200 at $72,088, which has acted as a ceiling throughout the broader downtrend from 2025...
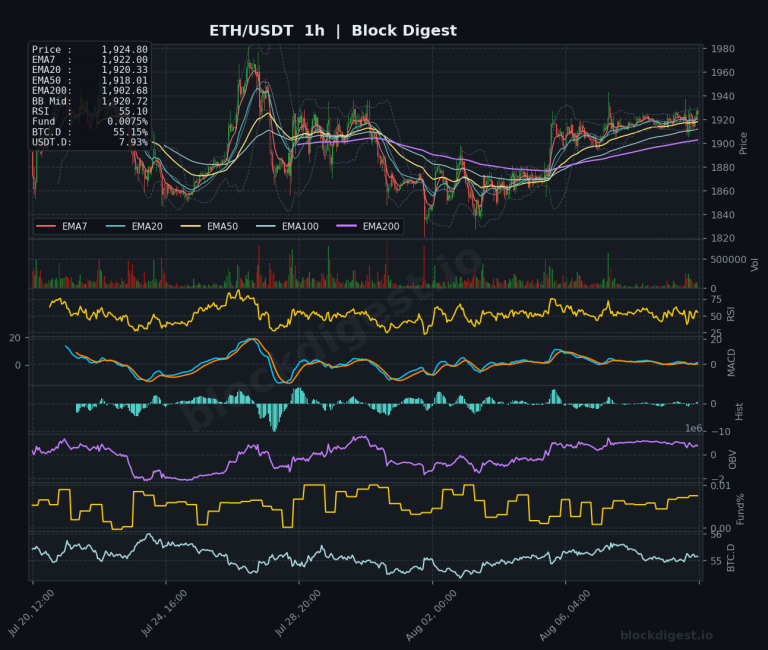
ETH Daily Analysis — 2026-08-10
Market Overview Ethereum is trading at $1,924.80, consolidating in a narrow band just above its short-term moving averages after a meaningful recovery from the mid-$1,600s seen earlier this summer. On the daily timeframe, price has reclaimed the EMA7 ($1,907.92), EMA20 ($1,888.93), and EMA50 ($1,863.77) in succession — a structurally bullish development — though the daily...
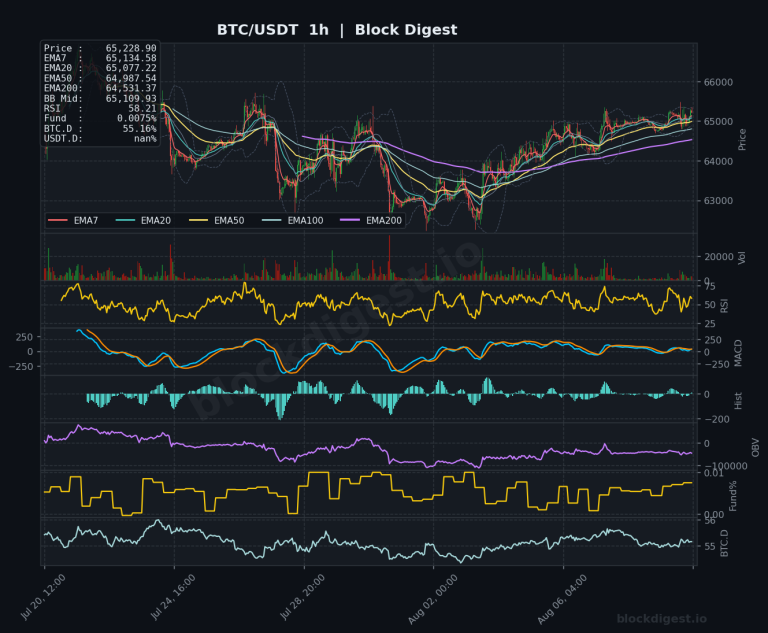
BTC Daily Analysis — 2026-08-10
Market Overview Bitcoin is trading at $65,228 as of August 10, 2026, navigating a critical juncture after a multi-month downtrend from its prior highs above $100,000. On the daily timeframe, price has recently reclaimed the EMA7 ($64,710), EMA20 ($64,358), and EMA50 ($64,675) — a meaningful cluster of short-term dynamic support now sitting just beneath spot...
ETH Daily Analysis History — August 2026
2026-08-01 $1,868 — ETH below key EMA cluster on 1h/4h; BD Pulse 24/100 extreme bear; $1,846 support critical, bias cautiously bearish. Full Analysis →