
Learn
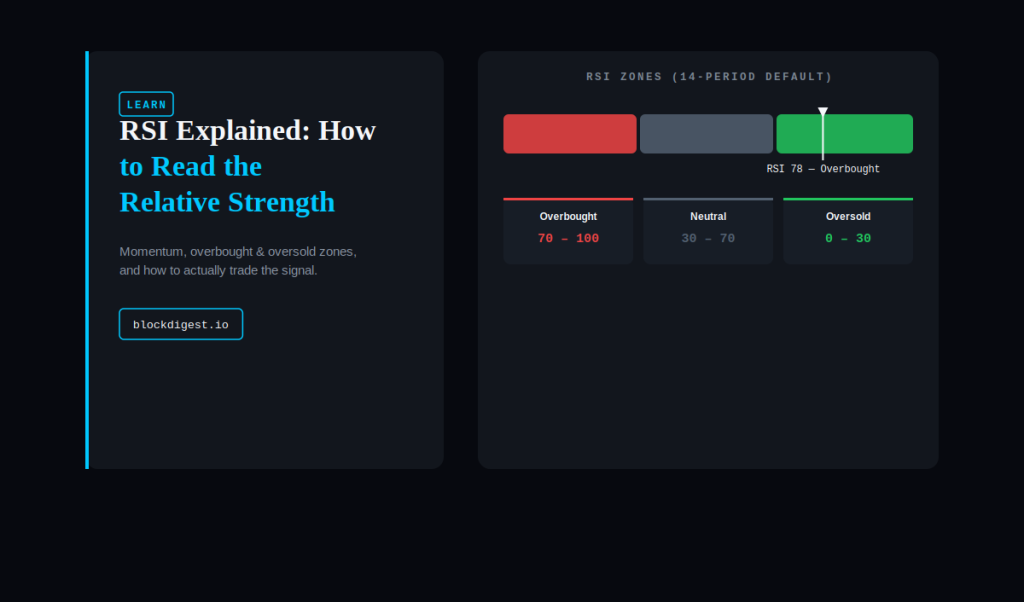
RSI Explained: How to Read the Relative Strength Index in Crypto Trading
What Is the RSI? The Relative Strength Index (RSI) is a momentum oscillator developed by J. Welles Wilder Jr. and introduced in his 1978 book New Concepts in Technical Trading Systems. It measures the speed and magnitude of recent price changes to evaluate whether an asset is potentially overextended to the upside or the downside....
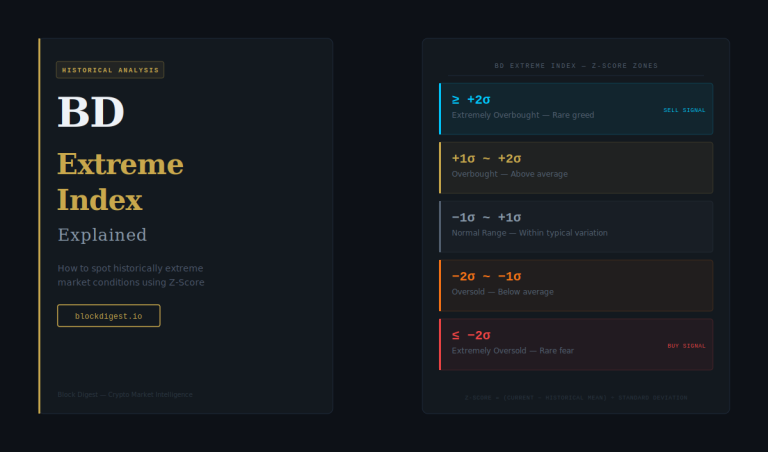
BD Extreme Index Explained: How to Spot Historically Extreme Market Conditions
BD Extreme Index explained — and why BD Pulse alone isn’t always enough. BD Pulse tells you what the market looks like right now. But “right now” without historical context can be misleading. A score of 70 might look elevated — but is it actually unusual, or is that just a normal reading for this...
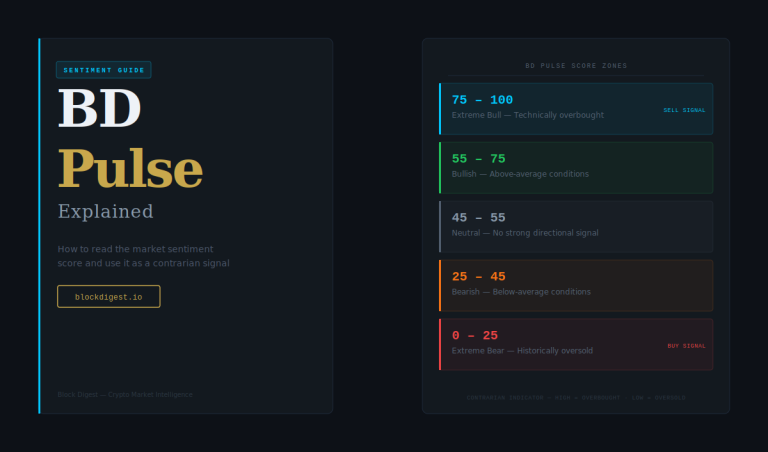
BD Pulse Explained: How to Read Block Digest’s Market Sentiment Score
BD Pulse explained — and why I built it in the first place. Most sentiment tools I tried were either too vague (“fear and greed”), too lagging, or too narrow — focused only on price or only on derivatives. I wanted something that combined multiple signals into a single, actionable number updated every day. So...

BTC Dominance Explained: What It Means for Altcoins
Bitcoin dominance is the one chart I check before buying any altcoin. I learned this the hard way — buying altcoins during periods of rising BTC dominance and watching them bleed in BTC terms even when the broader market looked okay. Once I understood what dominance was actually measuring, I stopped making that mistake. In...
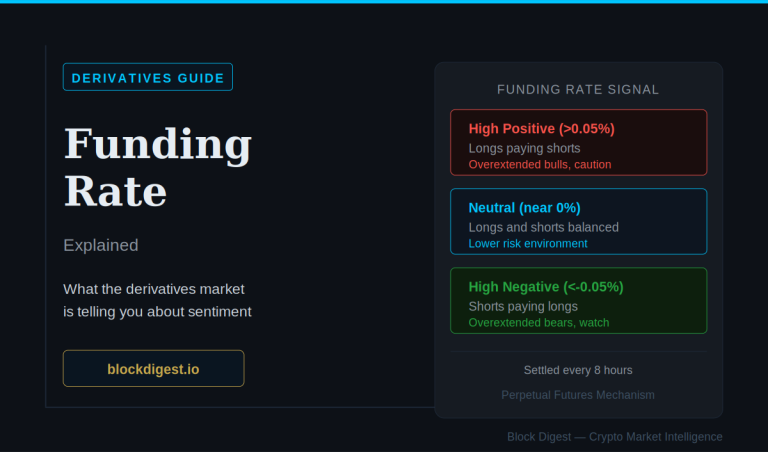
Funding Rate Guide: What It Tells You About Market Sentiment
Crypto funding rate explained — and why it became one of the first things I check before entering any significant position. Funding rate is one of those indicators that looks confusing at first but becomes essential once you understand it. I ignored it for a long time because the mechanics seemed technical. But once I...
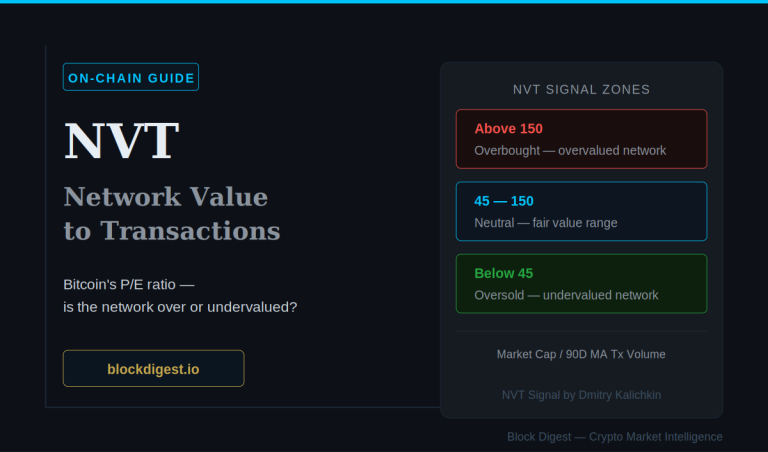
NVT Ratio: Bitcoin’s P/E Ratio Explained
NVT ratio explained — Bitcoin’s equivalent of a P/E ratio, and one of the cleanest ways to assess whether the network is fundamentally over or undervalued. If you’ve ever used a P/E ratio to value a stock, the NVT ratio will feel immediately familiar. I came across NVT after spending too much time staring at...
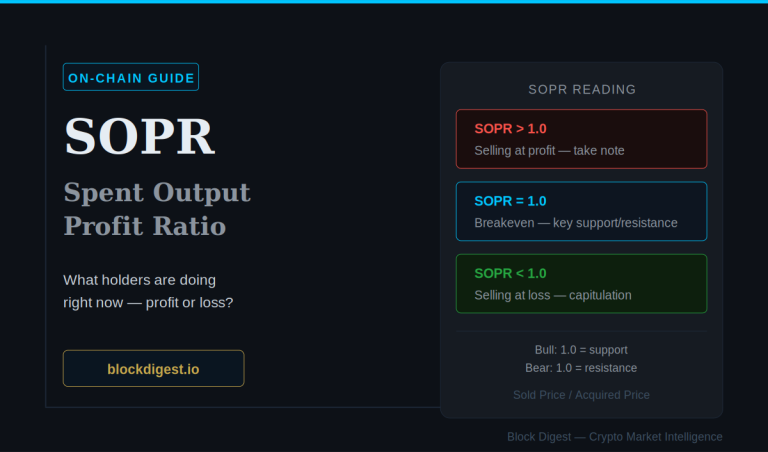
SOPR Explained: How to Read Spent Output Profit Ratio
If MVRV tells you where the market is in the cycle, SOPR tells you what holders are doing right now. I started paying attention to SOPR after noticing that price action alone wasn’t enough to tell me whether a rally was sustainable or a dead cat bounce. SOPR filled that gap — it shows whether...
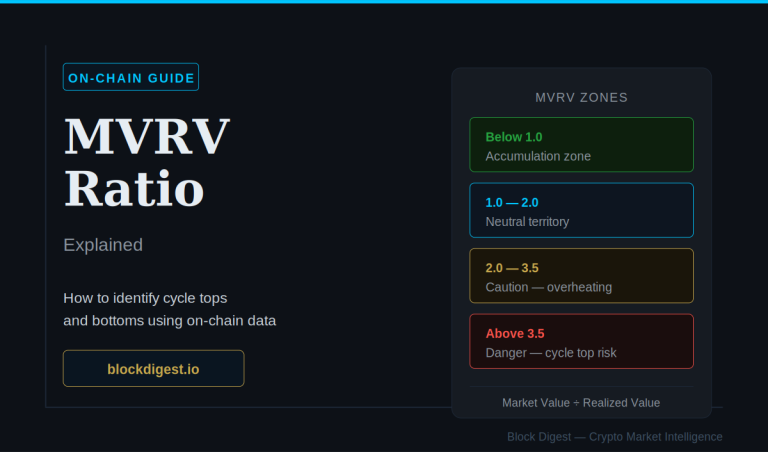
What is MVRV Ratio and How to Use It
A practical guide to the MVRV ratio — what it measures, how to read market cycle signals, and how to combine it with other on-chain indicators.