
Market Overview
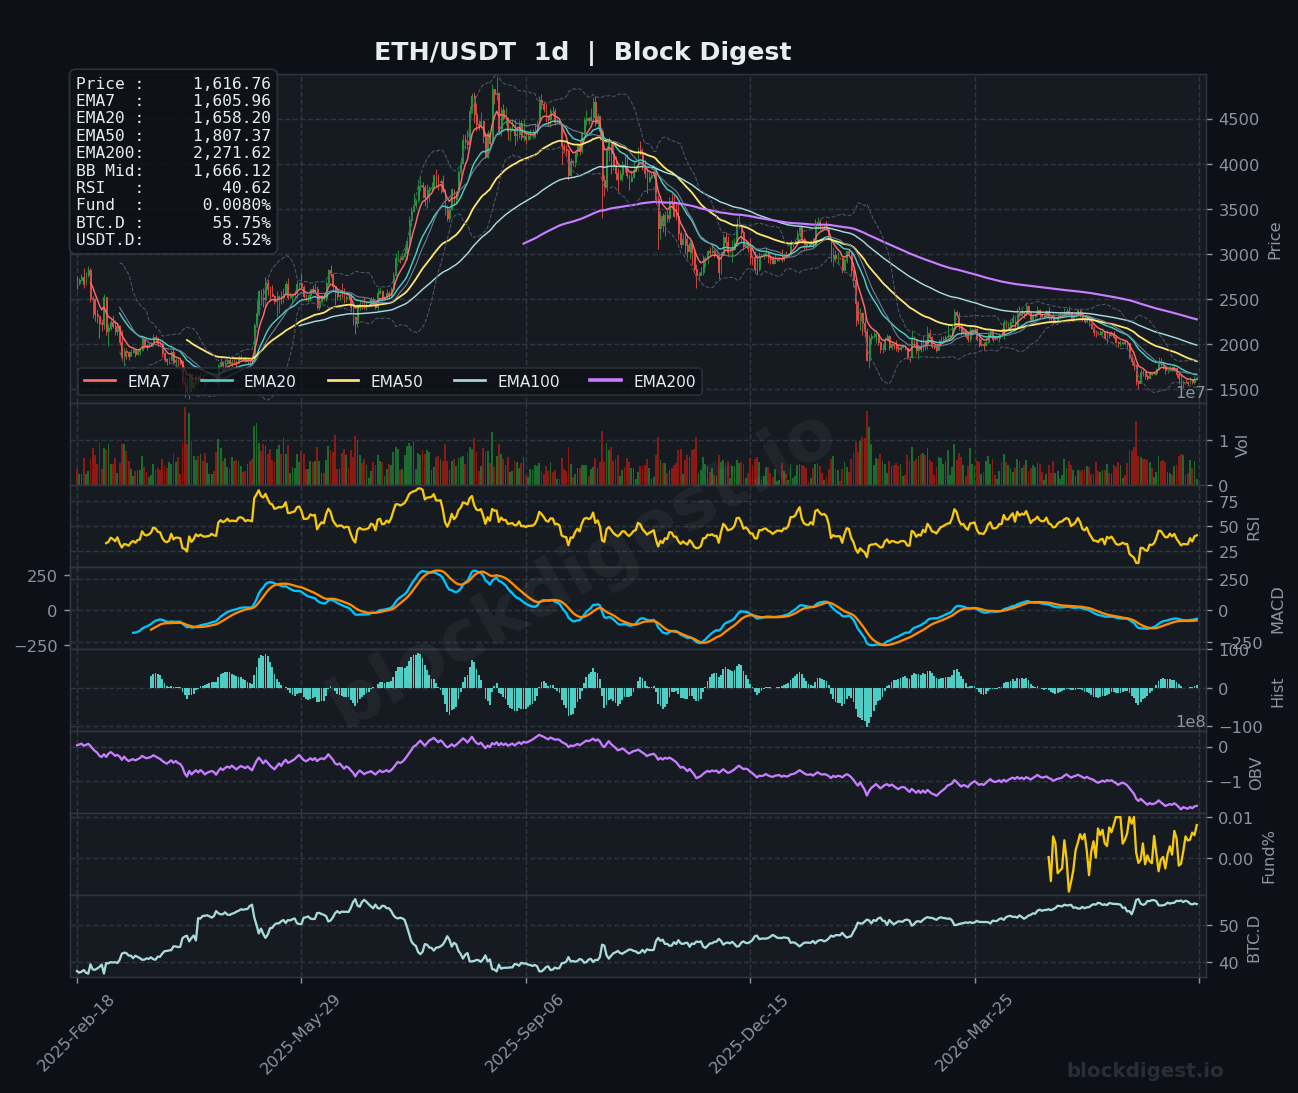
Ethereum is trading at $1,616.76 as of July 2, 2026, attempting a modest recovery after a prolonged multi-month downtrend that has seen price fall from highs above $4,000 on the daily chart. Price currently sits well below the daily EMA200 ($2,271.62), EMA50 ($1,807.37), and EMA20 ($1,658.20), confirming the dominant macro trend remains firmly bearish. The daily Bollinger Band midline at $1,666.12 continues to act as an overhead obstacle, and the 24-hour bounce of 2.29% has done little to meaningfully alter the higher-timeframe structure. Price is, however, holding fractionally above the daily EMA7 ($1,605.96), suggesting the very short-term impulse is attempting to stabilize.
Multi-Timeframe Confluence
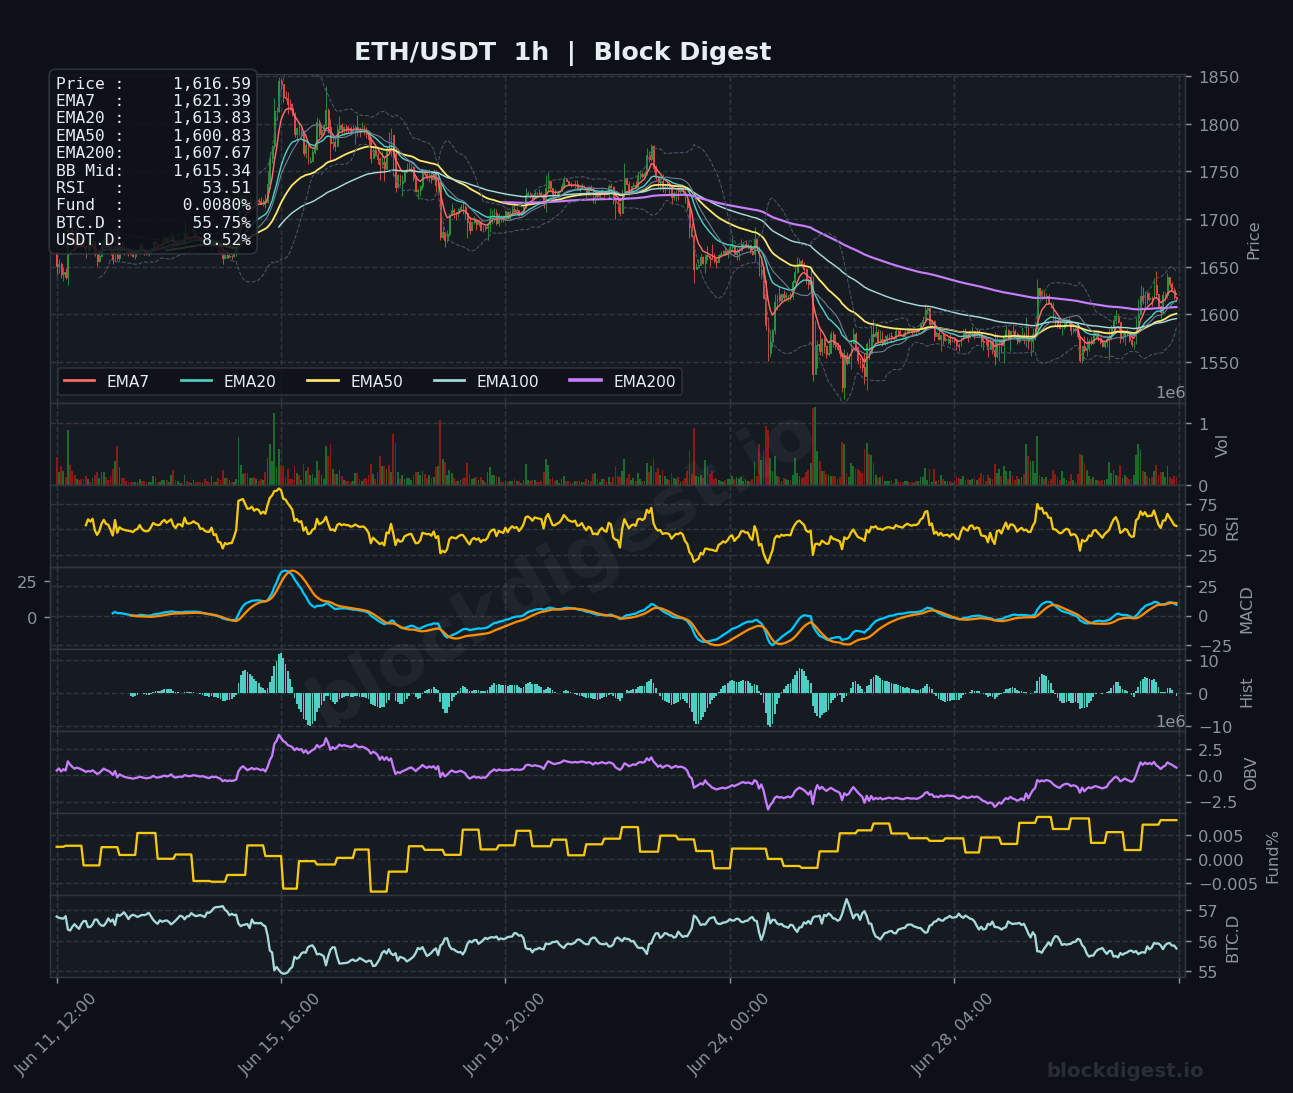
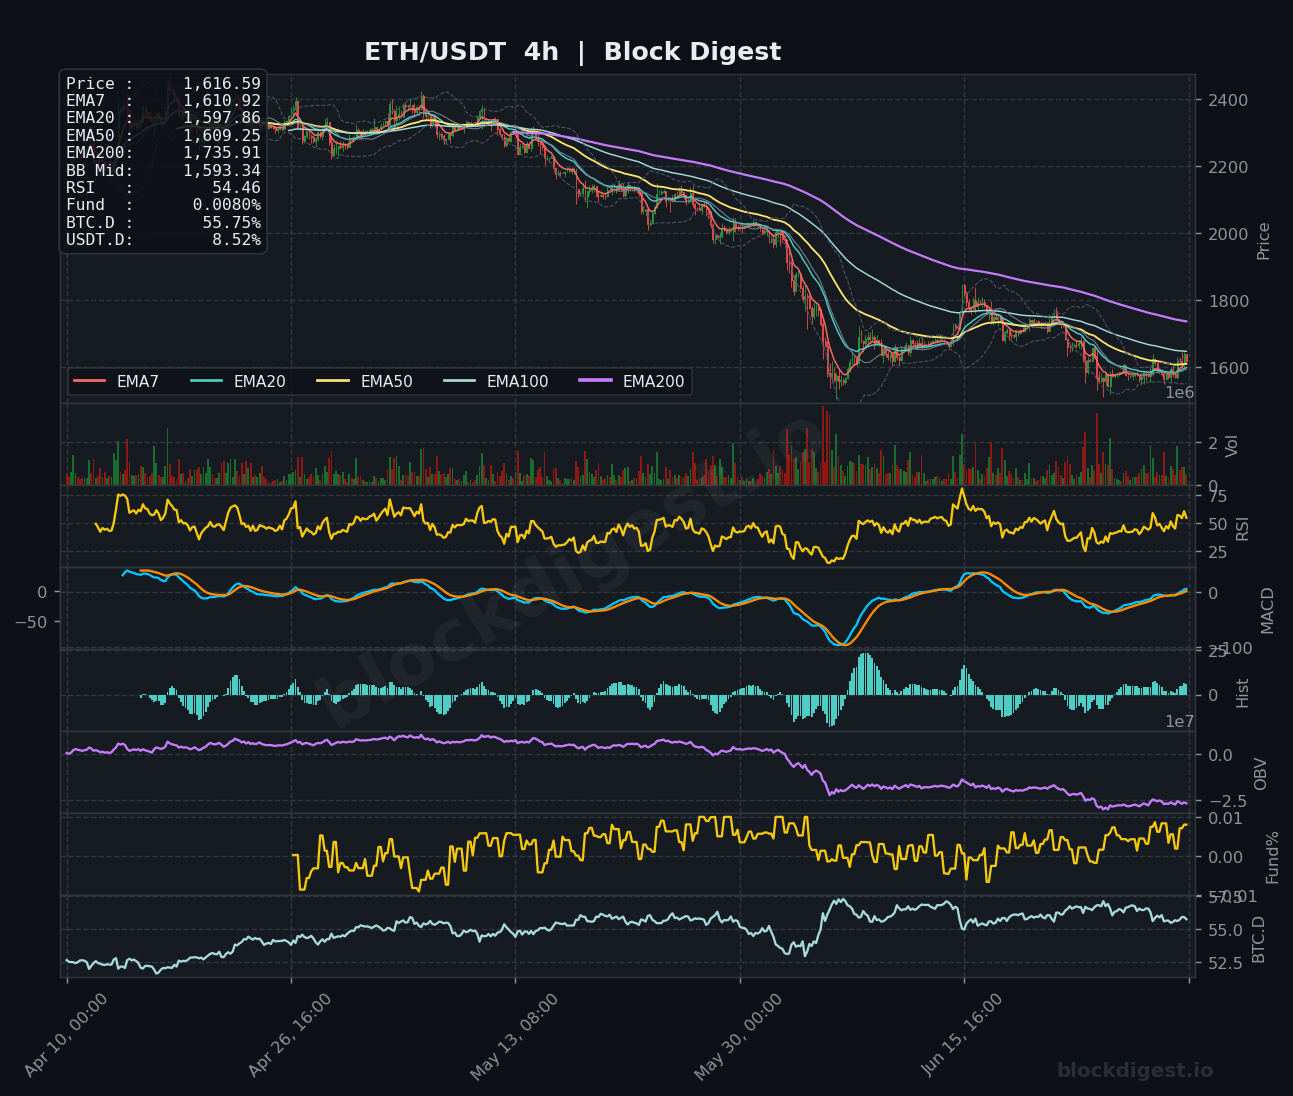
On the 1-hour chart, price is trading tightly around the EMA cluster — with EMA7 at $1,621.39, EMA20 at $1,613.83, EMA50 at $1,600.83, and EMA200 at $1,607.67 — indicating a compression phase following the recent sell-off, with no decisive directional conviction yet. The 4-hour chart paints a similarly cautious picture: price has reclaimed the EMA7 ($1,610.92) and EMA20 ($1,597.86) from below, but the EMA200 on this timeframe sits far overhead at $1,735.91, serving as a significant structural ceiling. Across all three timeframes, the bearish macro structure set on the daily aligns with the 4-hour downtrend, while the 1-hour shows only a tentative short-term recovery — making any near-term bullish momentum appear corrective rather than impulsive in nature.
Key Levels to Watch
- Resistance: $1,658 — Daily BB midline and EMA20, the first major overhead test for any recovery attempt
- Resistance: $1,735–$1,740 — 4-hour EMA200 zone, a key structural barrier that capped prior bounces during the recent downtrend
- Resistance: $1,807 — Daily EMA50, which would represent a significant regime shift if reclaimed on a closing basis
- Support: $1,600–$1,607 — Confluent 1-hour EMA50 and EMA200 cluster, immediate short-term floor
- Support: $1,570–$1,580 — Recent swing lows visible on the 1-hour chart, the last line of defense before deeper downside opens
- Support: $1,500 — Psychological round number and approximate lower Bollinger Band extension on the daily, representing a worst-case near-term target
Momentum & On-Chain Signals
The 1-hour RSI at 53.51 and the 4-hour RSI at 54.46 reflect neutral-to-mildly-bullish short-term momentum, consistent with the recent bounce but not yet indicating an overbought condition. The daily RSI at 40.62 remains in bearish territory, having recently approached oversold levels — any continuation toward 50 would be a meaningful recovery signal to monitor. The 4-hour MACD is attempting a bullish crossover near the zero line, with the histogram turning green, though the signal remains fragile; the daily MACD histogram remains negative, confirming the macro downtrend is intact. OBV on the daily chart continues to trend downward, reflecting persistent distribution with no clear accumulation signal yet, while the 1-hour OBV shows a modest uptick aligned with the recent bounce. Funding rates remain marginally positive at 0.0080%, suggesting the market is not aggressively short-biased but lacks strong conviction for a squeeze.
BTC Dominance & Market Sentiment
BTC.D sits at 55.75% — a notably elevated level that historically correlates with capital rotating into Bitcoin at the expense of altcoins, representing a headwind for ETH outperformance in the near term. USDT.D at 8.52% reflects a meaningful degree of risk-off positioning, with a significant portion of capital remaining sidelined rather than being deployed into the broader altcoin market. Until BTC.D shows a sustained rollover and USDT.D compresses meaningfully, the macro environment continues to favor Bitcoin relative to Ethereum, consistent with Citigroup’s recent reduction of their ETH price target and record spot ETF outflows.
Risk Scenarios
- Bullish case: A decisive daily close above the BB midline at $1,666 followed by a reclaim of the EMA20 ($1,658) on the daily timeframe would open a path toward the $1,735–$1,740 zone; a catalyst such as improving ETF flows or a confirmed Glamsterdam upgrade timeline could accelerate upside momentum toward $1,807.
- Bearish case: Failure to hold the $1,600–$1,607 EMA cluster on the 1-hour chart would expose the $1,570–$1,580 support zone; a breakdown below that level on elevated volume would put the $1,500 psychological level squarely in play, particularly if BTC.D continues to climb or macro risk-off sentiment intensifies.
Outlook
The near-term bias is cautiously neutral, with a slight lean toward continued consolidation between $1,580 and $1,660 before a more directional move resolves. The daily structure remains clearly bearish, and the current bounce looks corrective absent a significant catalyst to shift higher-timeframe trend dynamics. The critical trigger to watch over the next 24–48 hours is whether ETH can achieve a sustained daily close above the $1,658–$1,666 resistance band; failure to do so would reinforce the view that this is a dead-cat bounce within an established downtrend. Broader macro cues — including any further developments around U.S. spot ETF flows and Fed policy signals — remain key exogenous variables that could rapidly override the technical picture in either direction.
Disclaimer: This analysis is for informational purposes only and does not constitute financial advice. Cryptocurrency markets are highly volatile and unpredictable. All trading decisions should be made based on your own research and risk tolerance. Block Digest is not responsible for any financial losses incurred as a result of acting on this content.
Stay Ahead of the Market
Follow BlockDigest for crypto market intelligence, research and real-time updates.


