
Market Context
The broader altcoin market is navigating a cautiously recovering environment as of July 2, 2026, with BTC dominance sitting at approximately 55.73–55.76% — a level that continues to suppress meaningful altcoin outperformance on a relative basis. USDT dominance at 8.52% signals that a meaningful portion of capital remains parked on the sidelines, though the declining trend in USDT.D visible across shorter timeframes suggests risk appetite is slowly returning. Total 24-hour trading volume of $82.5 billion reflects moderate market participation, with SOL leading the charge among the assets covered today.
Solana (SOL)
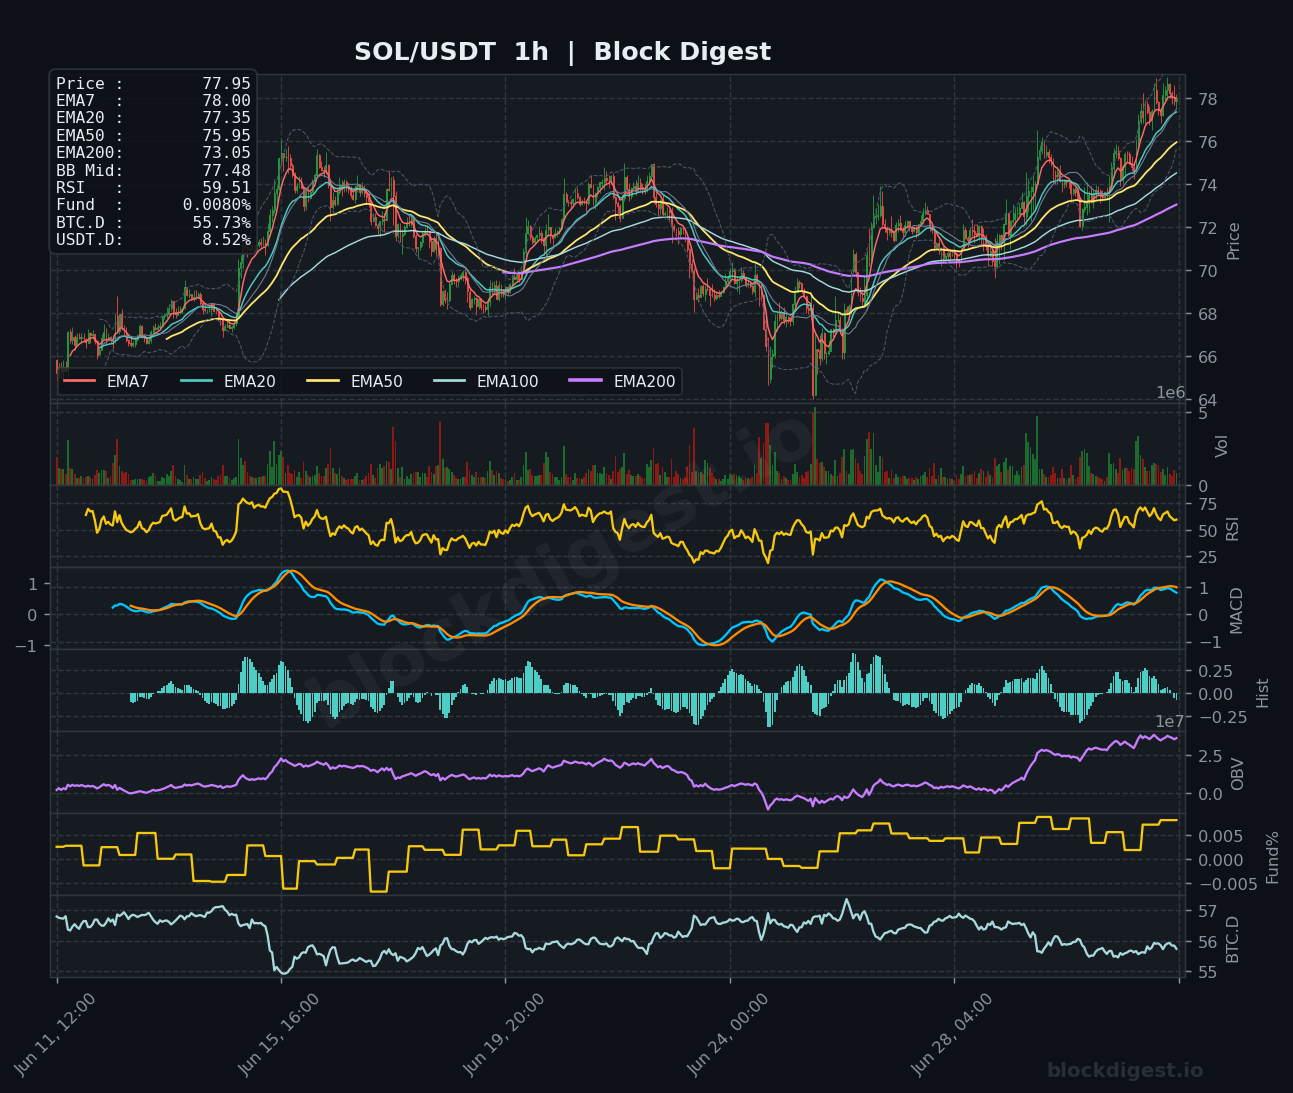
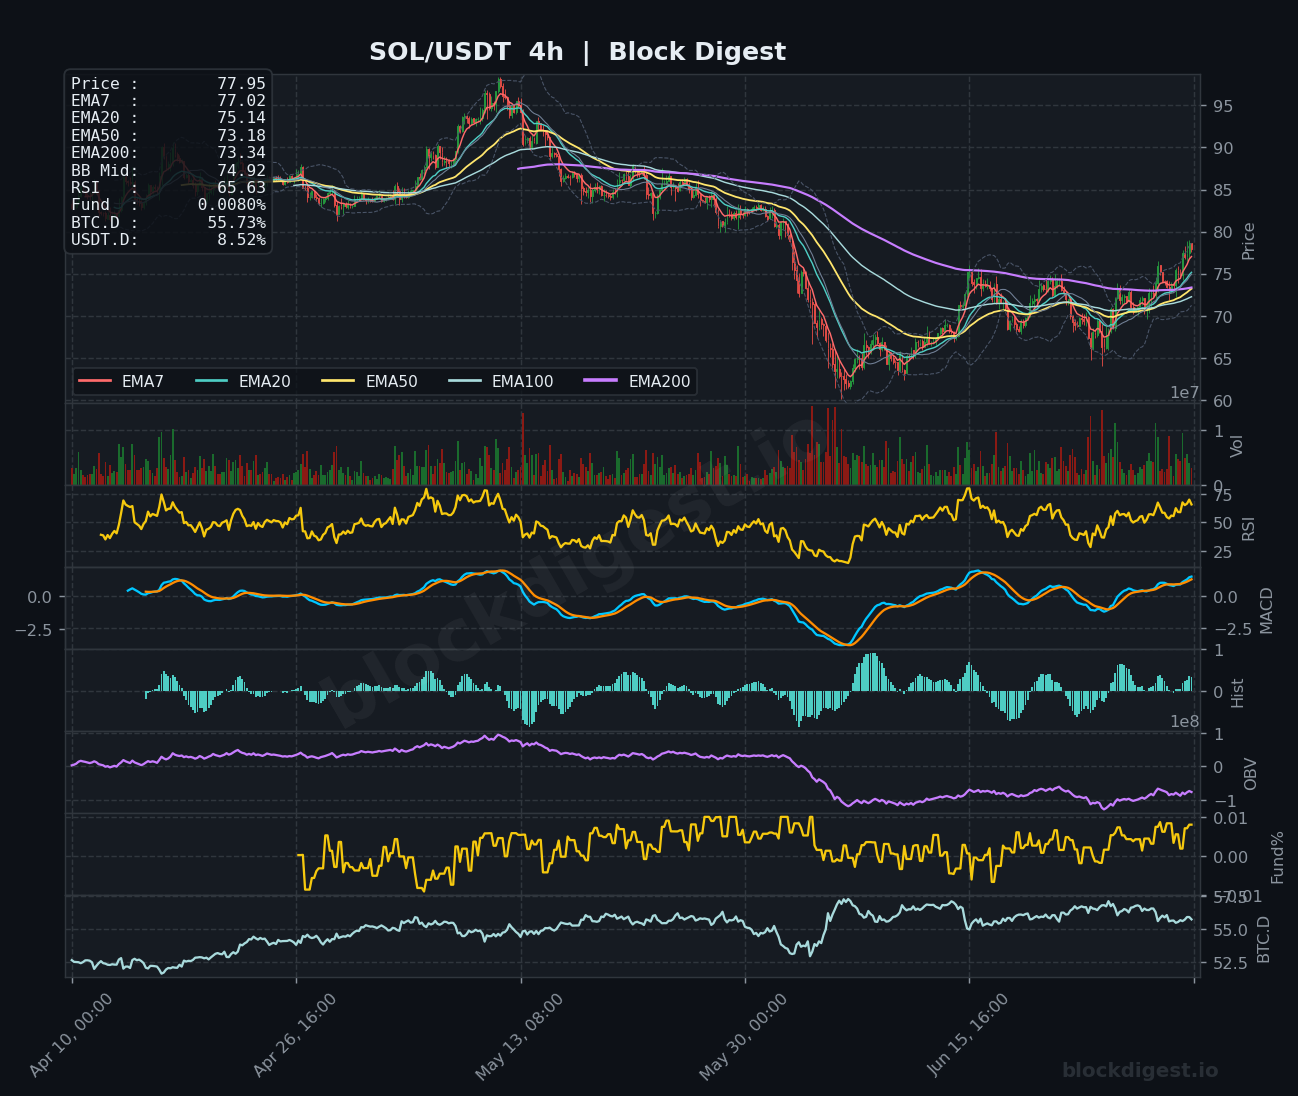
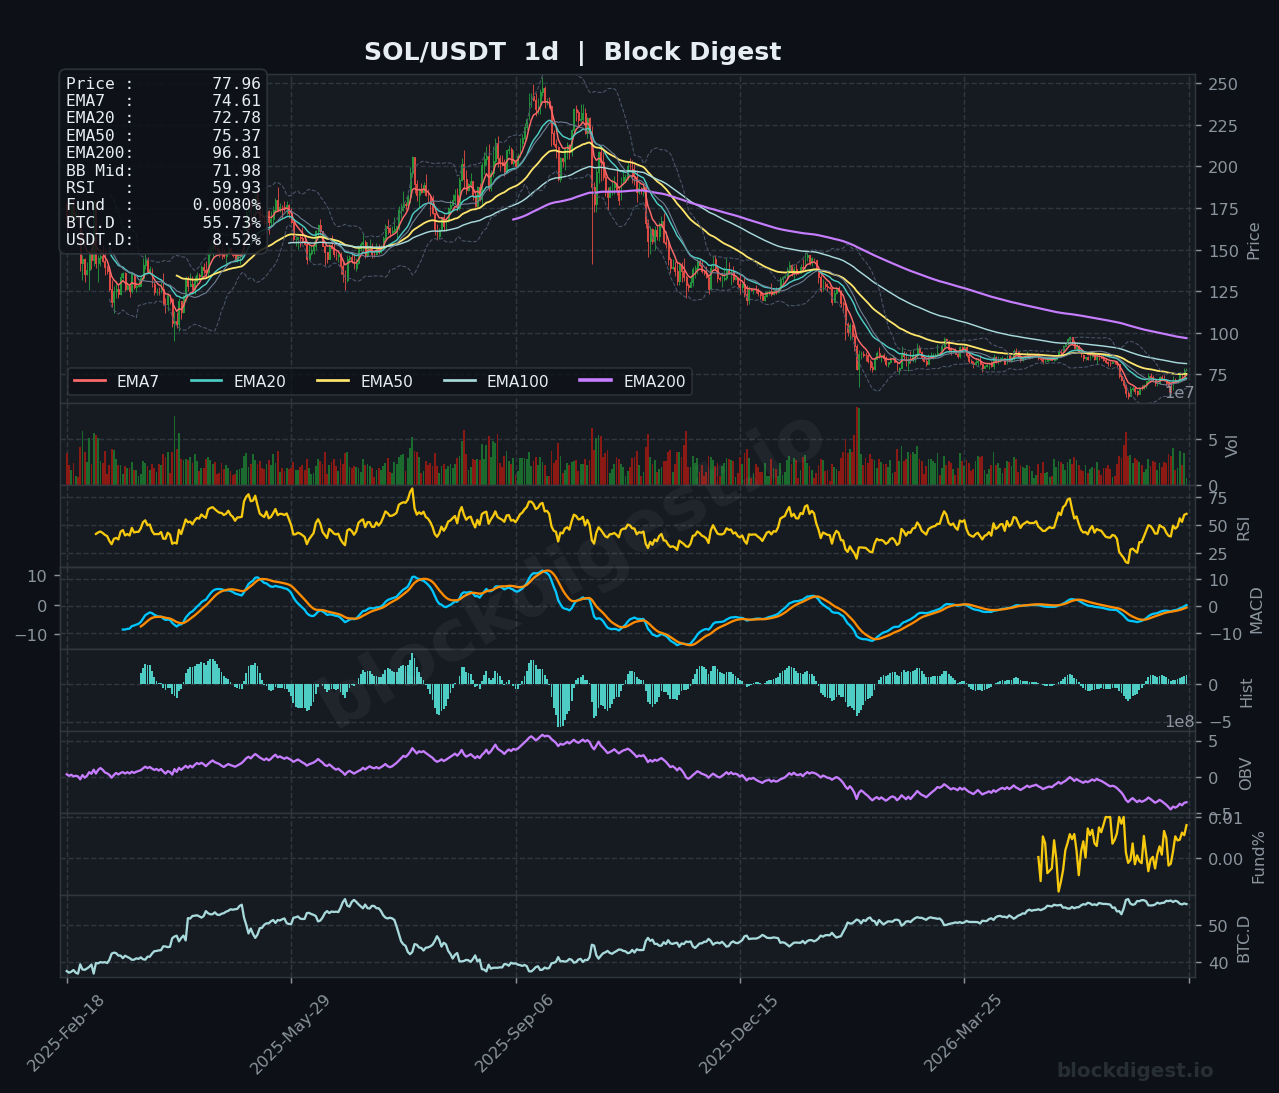
SOL is trading at $77.95–$78.14, posting the strongest performance of today’s cohort with a 4%+ intraday gain. On the 1-hour chart, price is holding above all short-term EMAs — EMA7 at $78.00 and EMA20 at $77.35 — with RSI at 59.51, indicating healthy momentum without yet reaching overbought territory. The 4-hour chart shows RSI elevated at 65.63 with MACD lines both trending positive and crossing above zero, while OBV is curling higher, confirming genuine buy-side accumulation driving the move. On the daily, price is battling its EMA50 at $75.37 and has reclaimed it to the upside, though the EMA200 at $96.81 remains a distant overhead obstacle; the short-term bias is cautiously bullish, with $80–$82 as the next meaningful resistance zone and $74–$75 as key support to hold.
XRP (XRP)
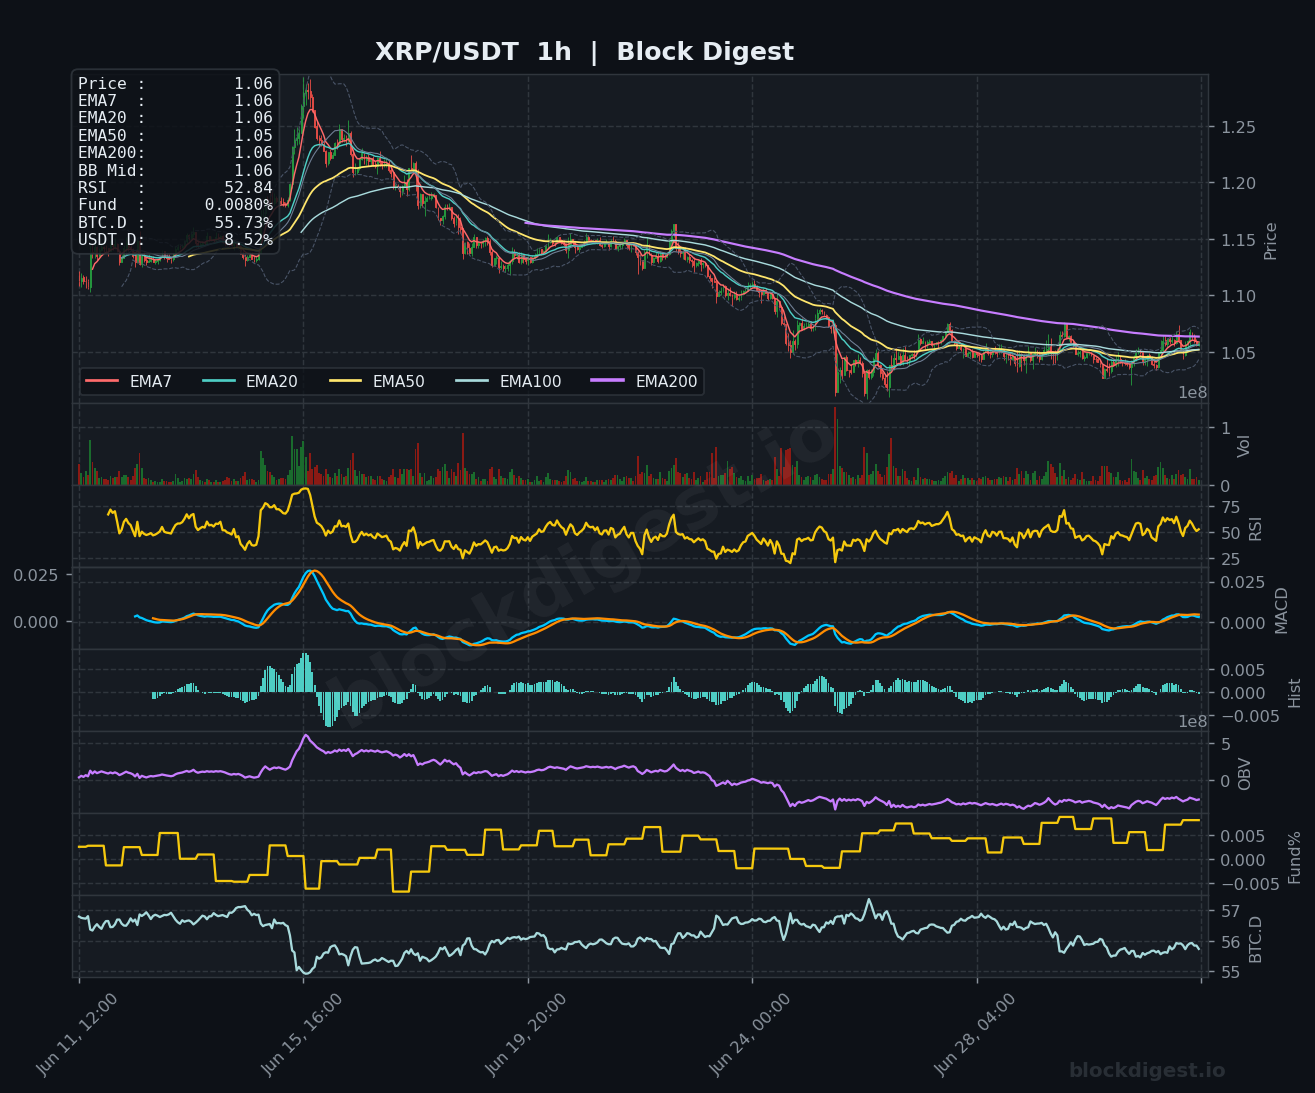
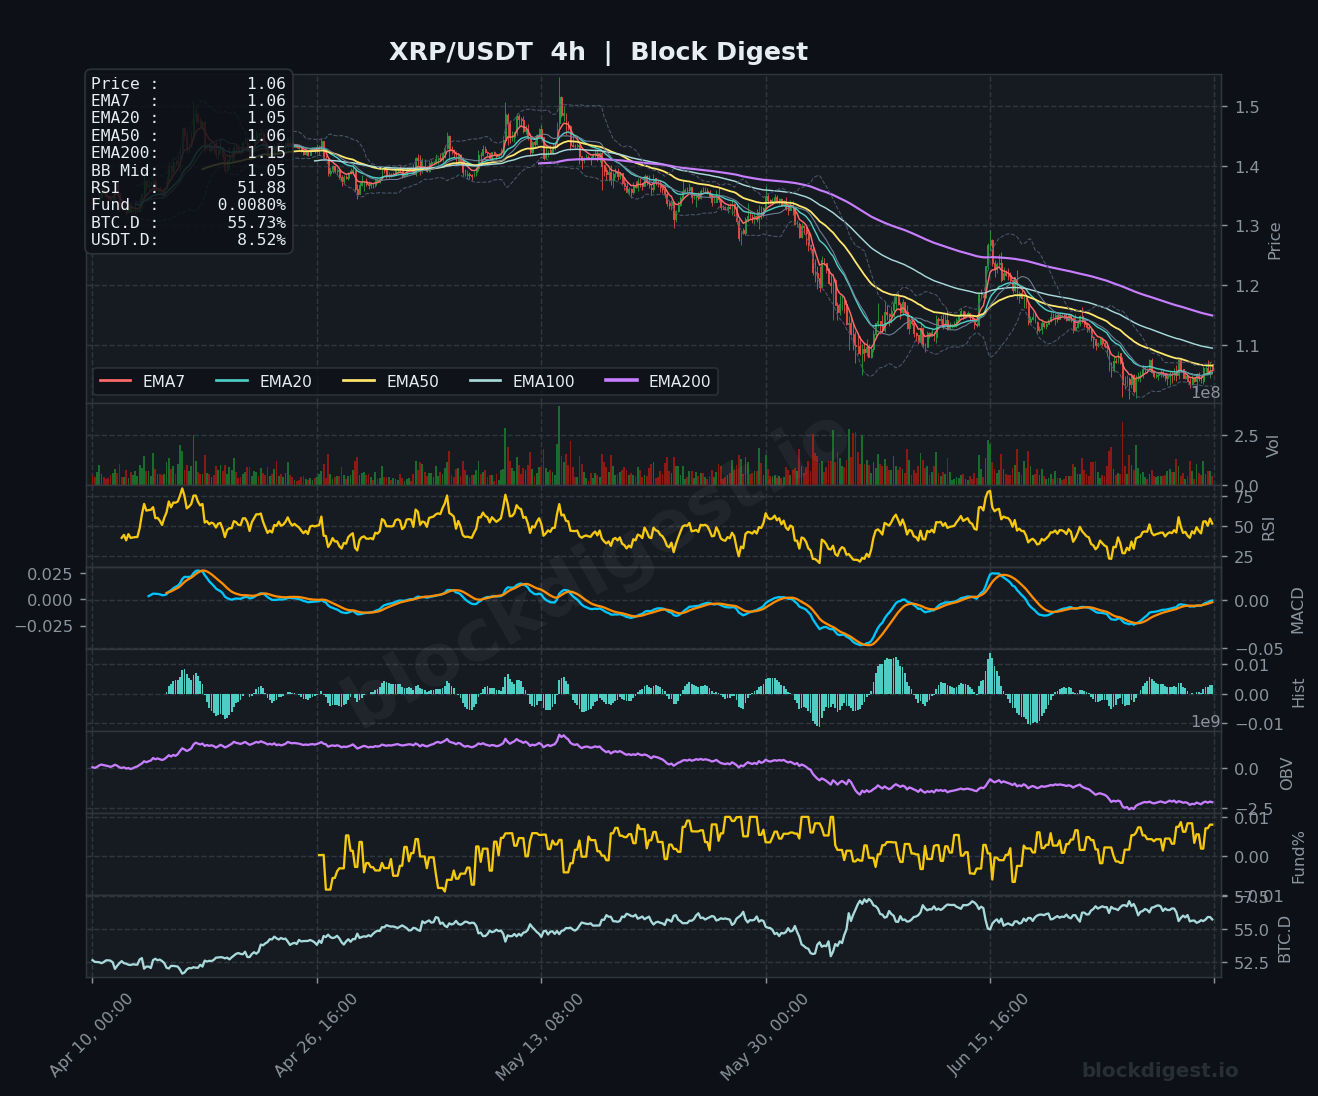
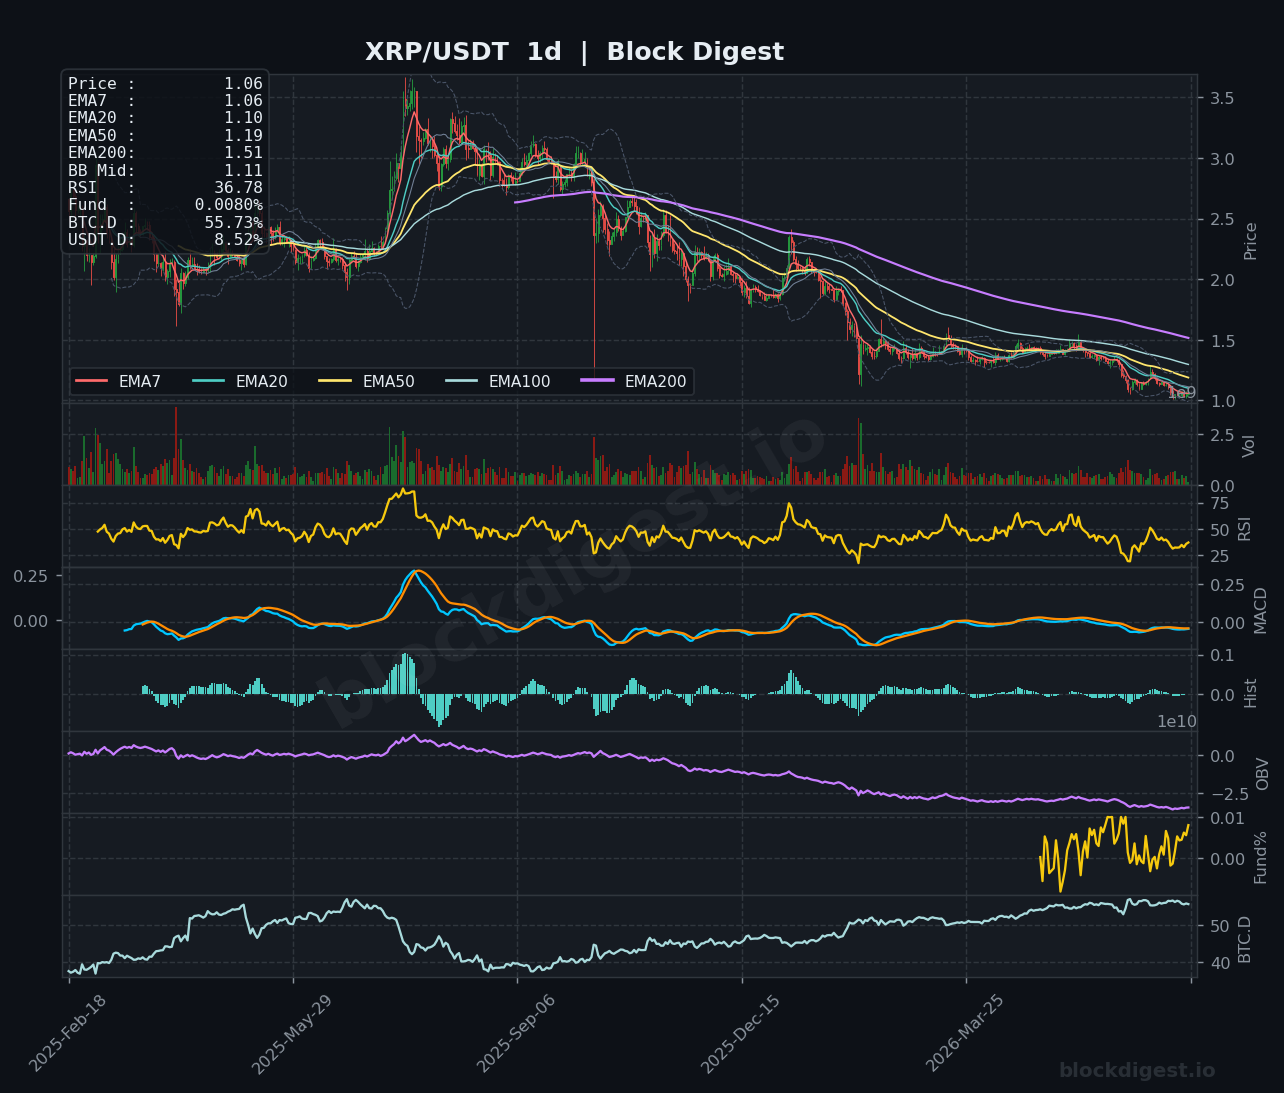
XRP is trading around $1.05–$1.06 with a modest +1.56% gain on the day, reflecting positive sentiment around the XRP Ledger ecosystem but struggling to generate significant technical momentum. On the 1-hour chart, all EMAs are tightly compressed between $1.05 and $1.06, with RSI at 52.84 — firmly mid-range and non-committal — while the MACD lines are hovering just above zero with minimal separation. The 4-hour chart is more concerning, with the EMA200 at $1.15 acting as significant overhead resistance and RSI at 51.88 showing no clear directional conviction; OBV on this timeframe has been steadily declining, indicating that underlying selling pressure has yet to fully abate. The daily chart paints a bearish structural picture, with RSI at just 36.78 and price trading well below the EMA20 ($1.10), EMA50 ($1.19), and EMA200 ($1.51); the short-term bias is neutral-to-bearish, with $1.08–$1.10 as immediate resistance and $1.02–$1.03 as critical support.
BNB (BNB)
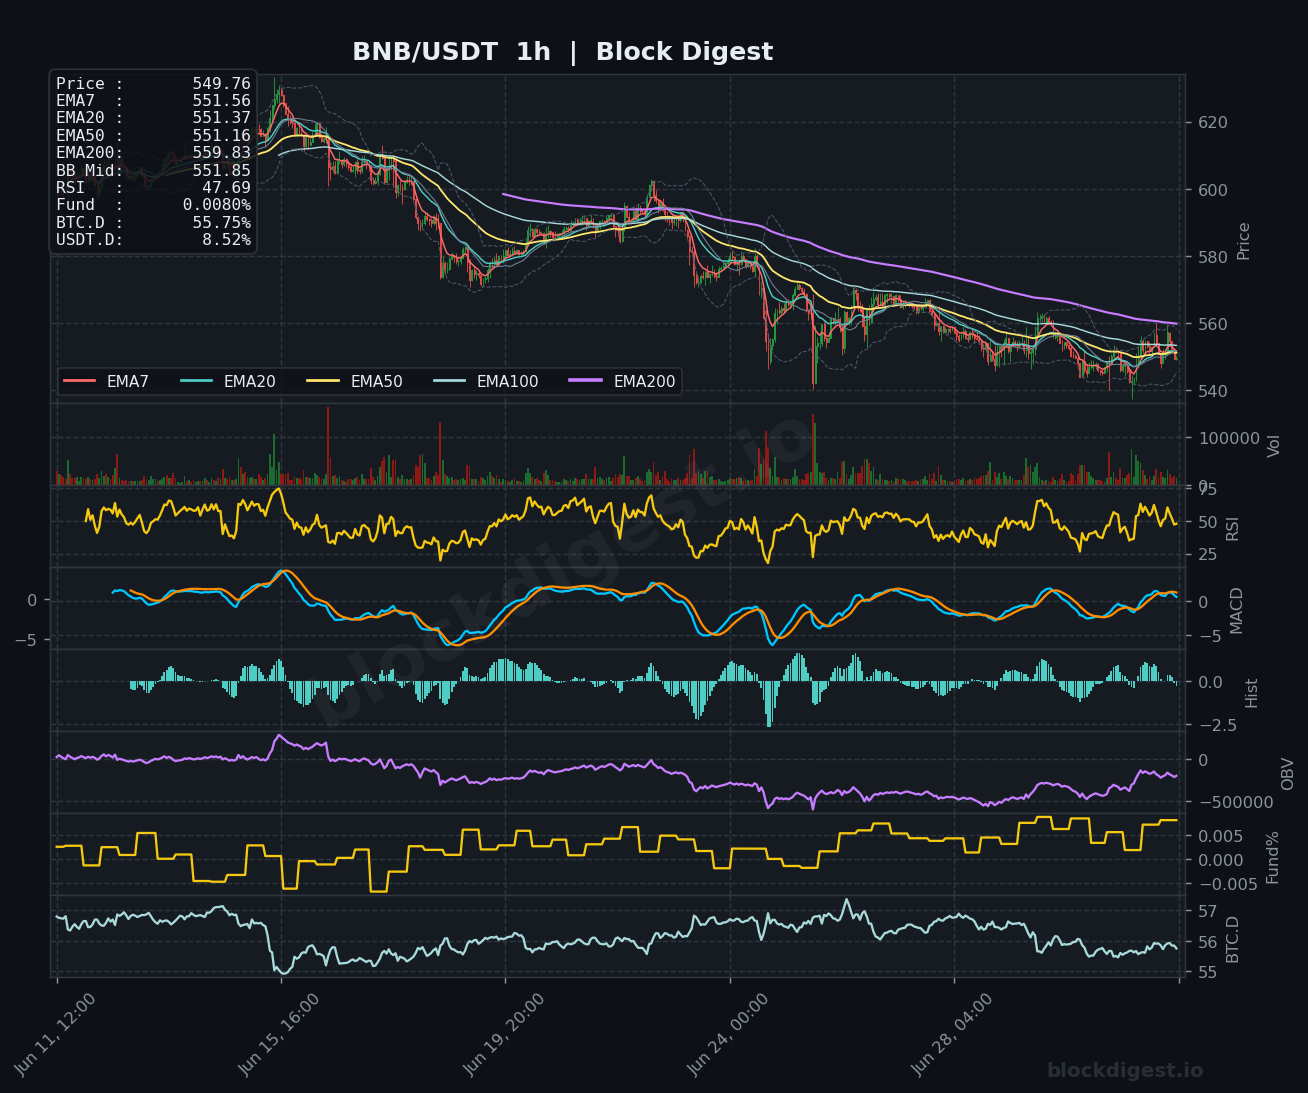
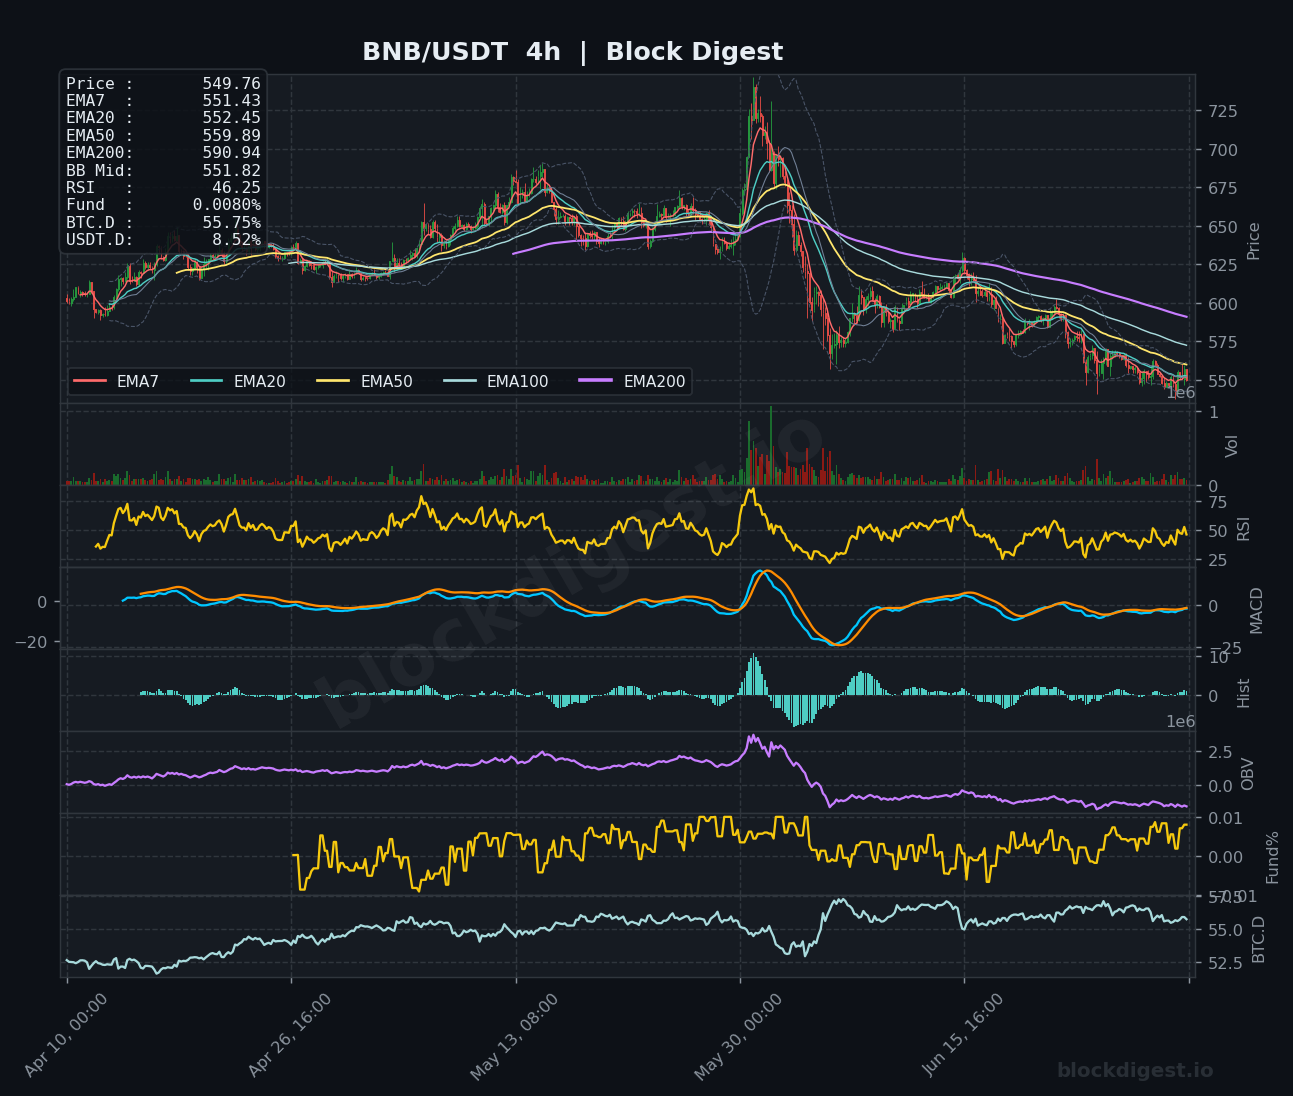
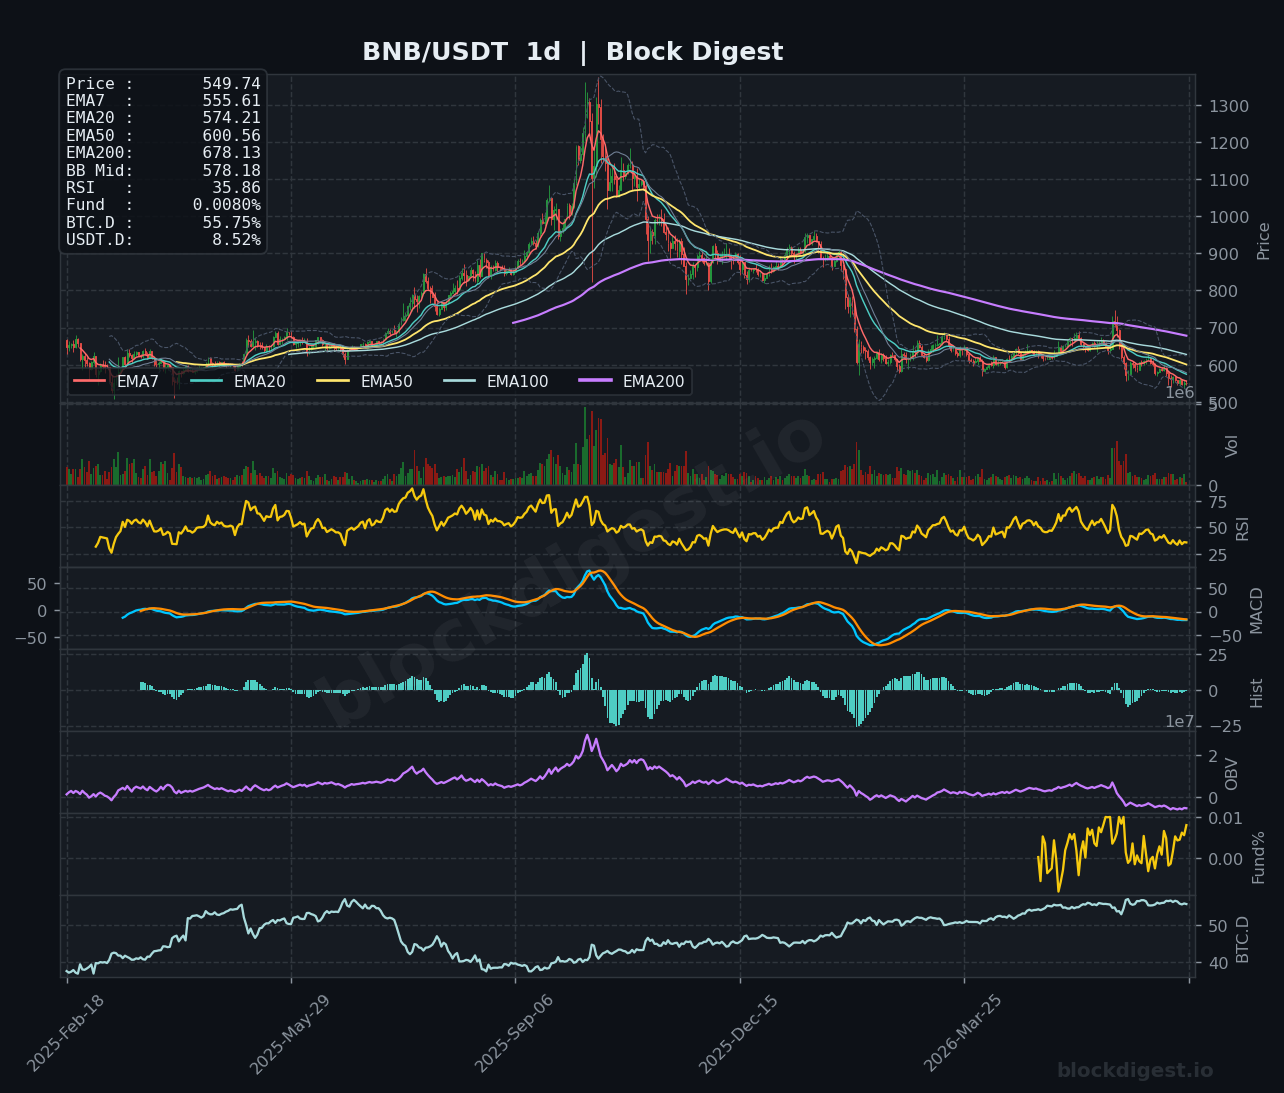
BNB is trading at $549.74–$550.86, posting a relatively subdued +0.31% gain and struggling to reclaim key moving average levels. On the 1-hour chart, price is sitting below all major EMAs — EMA7 at $551.56, EMA20 at $551.37, and EMA200 at $559.83 — with RSI at 47.69 reflecting bearish lean and the MACD hovering near zero with histogram bars flipping weakly positive. The 4-hour chart shows RSI at 46.25, with MACD lines still marginally negative and OBV in a sustained downtrend since a peak earlier in the quarter, confirming that distribution has dominated recent price action. The daily chart is outright bearish in structure, with price at $549.74 deeply below the EMA20 ($574.21), EMA50 ($600.56), and EMA200 ($678.13), while daily RSI at 35.86 approaches oversold territory — a condition that warrants watching for potential mean-reversion bounces but does not yet signal a trend reversal. The bias remains bearish, with $560–$575 as the first meaningful resistance cluster and $540 as near-term downside support.
Dogecoin (DOGE)
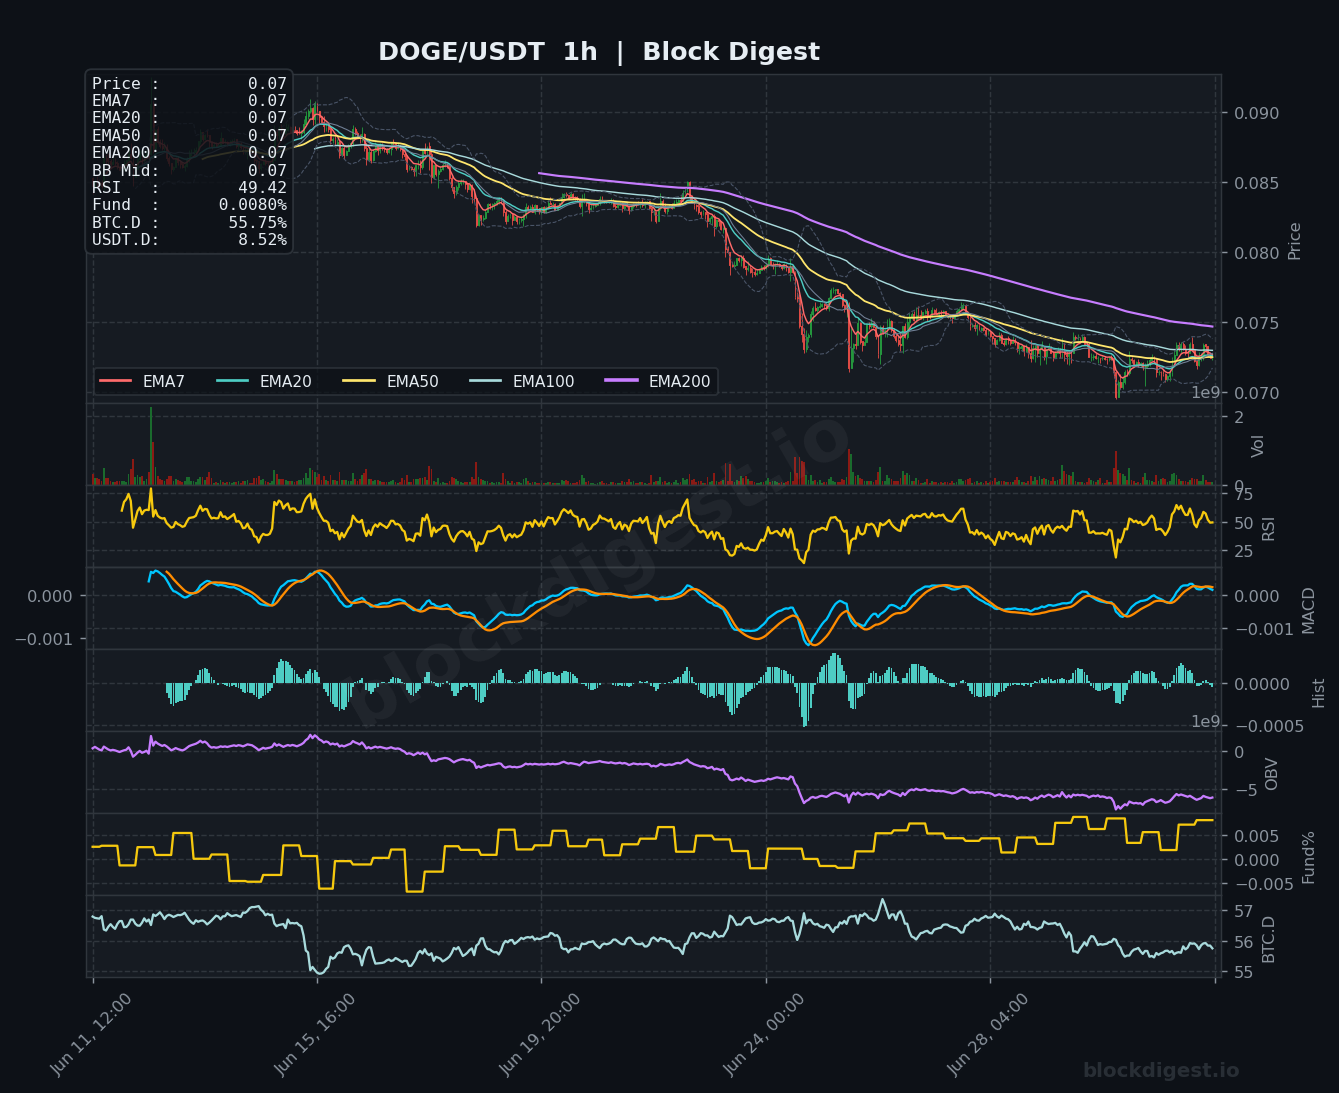
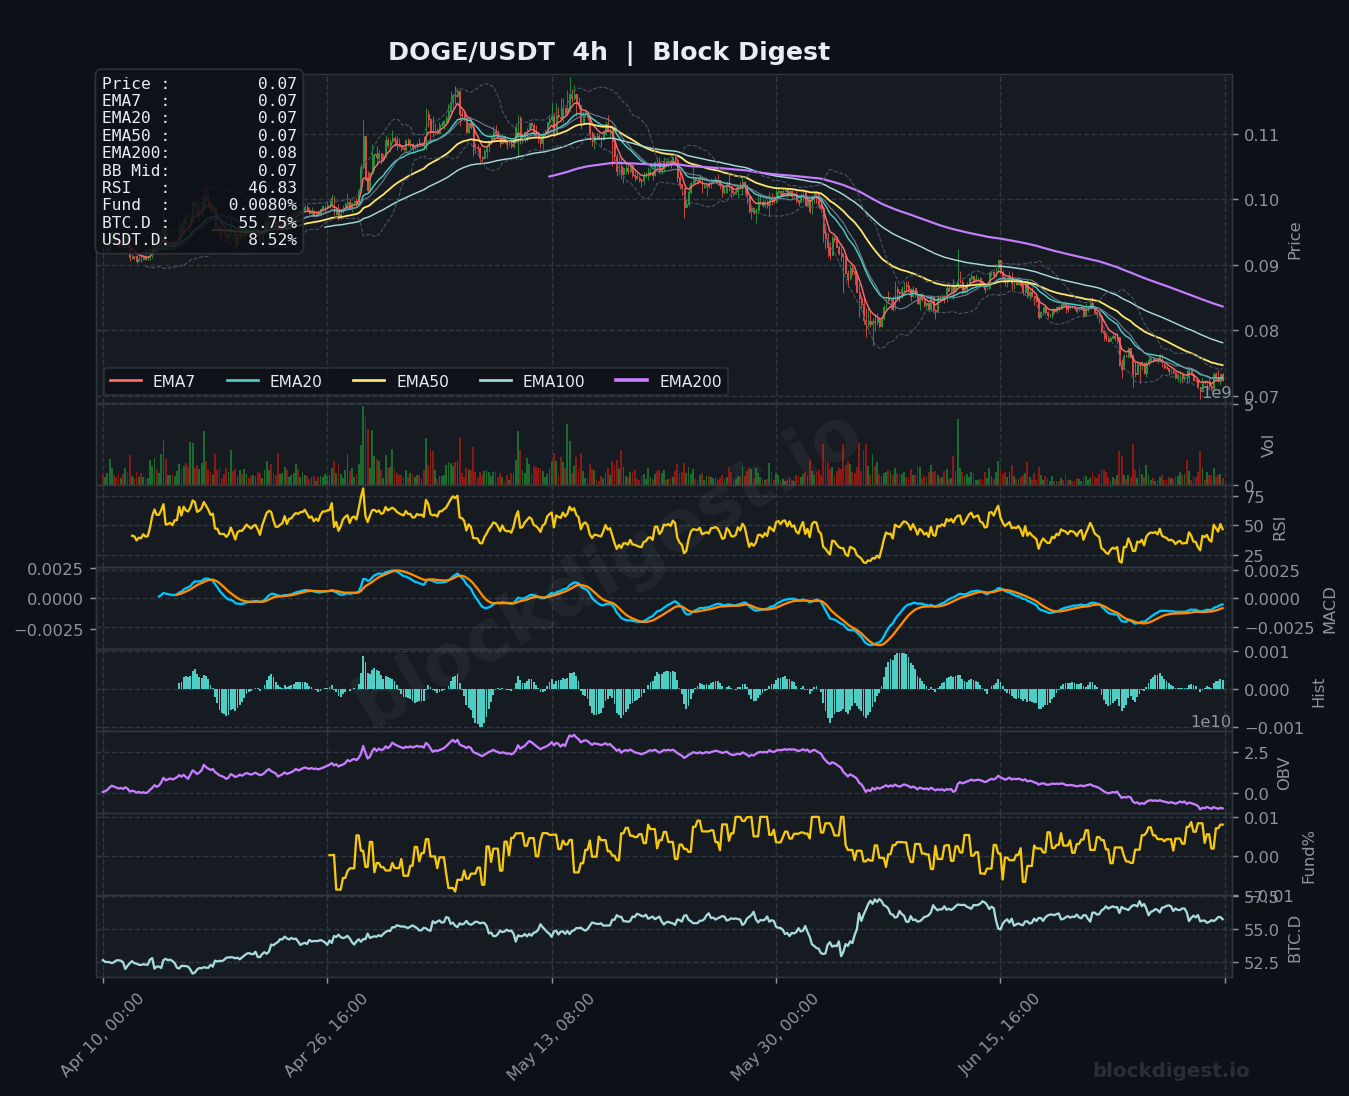
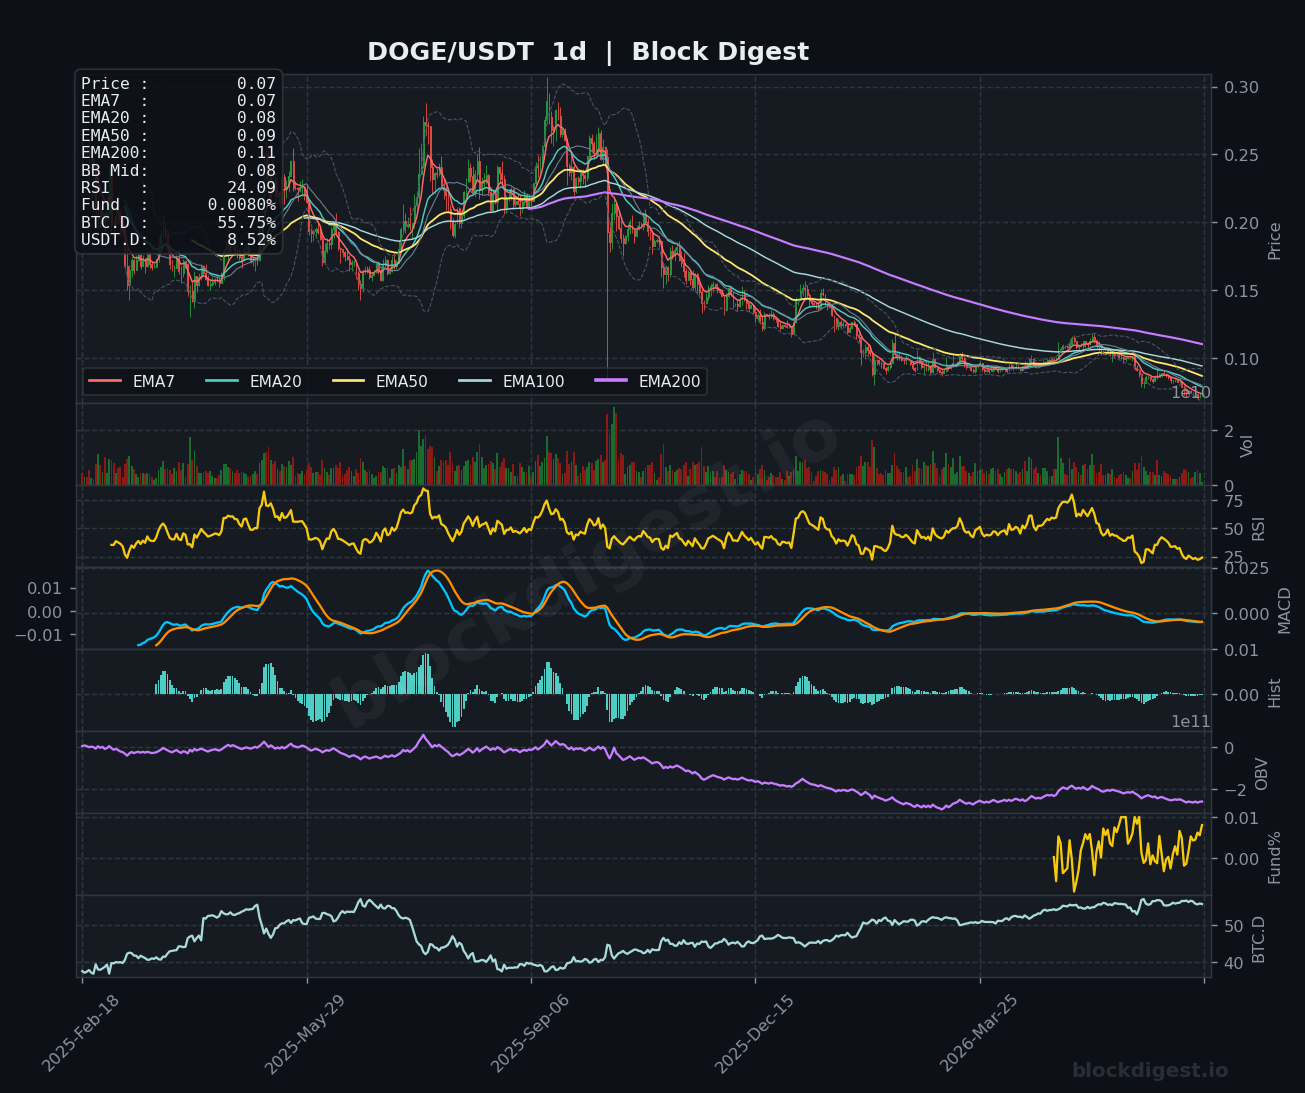
DOGE is trading at $0.072 with a 2.64% intraday gain, though the technical picture across timeframes remains structurally weak. On the 1-hour chart, EMAs are all compressed tightly at $0.07 with price sitting just at the Bollinger Band midpoint, while RSI at 49.42 and MACD near zero indicate a market in equilibrium rather than trending recovery. The 4-hour chart shows RSI at 46.83 with MACD lines barely above negative territory and OBV in a persistent downtrend, suggesting the intraday bounce has not yet attracted sustained accumulation. Most concerning is the daily chart, where RSI has dropped to an extremely oversold 24.09 — a level that historically precedes sharp bounces — while all daily EMAs (EMA7: $0.07, EMA50: $0.09, EMA200: $0.11) slope downward in a full bearish stack above price. The short-term bias is neutral with a slight mean-reversion lean given the extreme oversold daily RSI, but bulls need a clear reclaim of $0.075–$0.078 to establish any constructive case.
Litecoin (LTC)
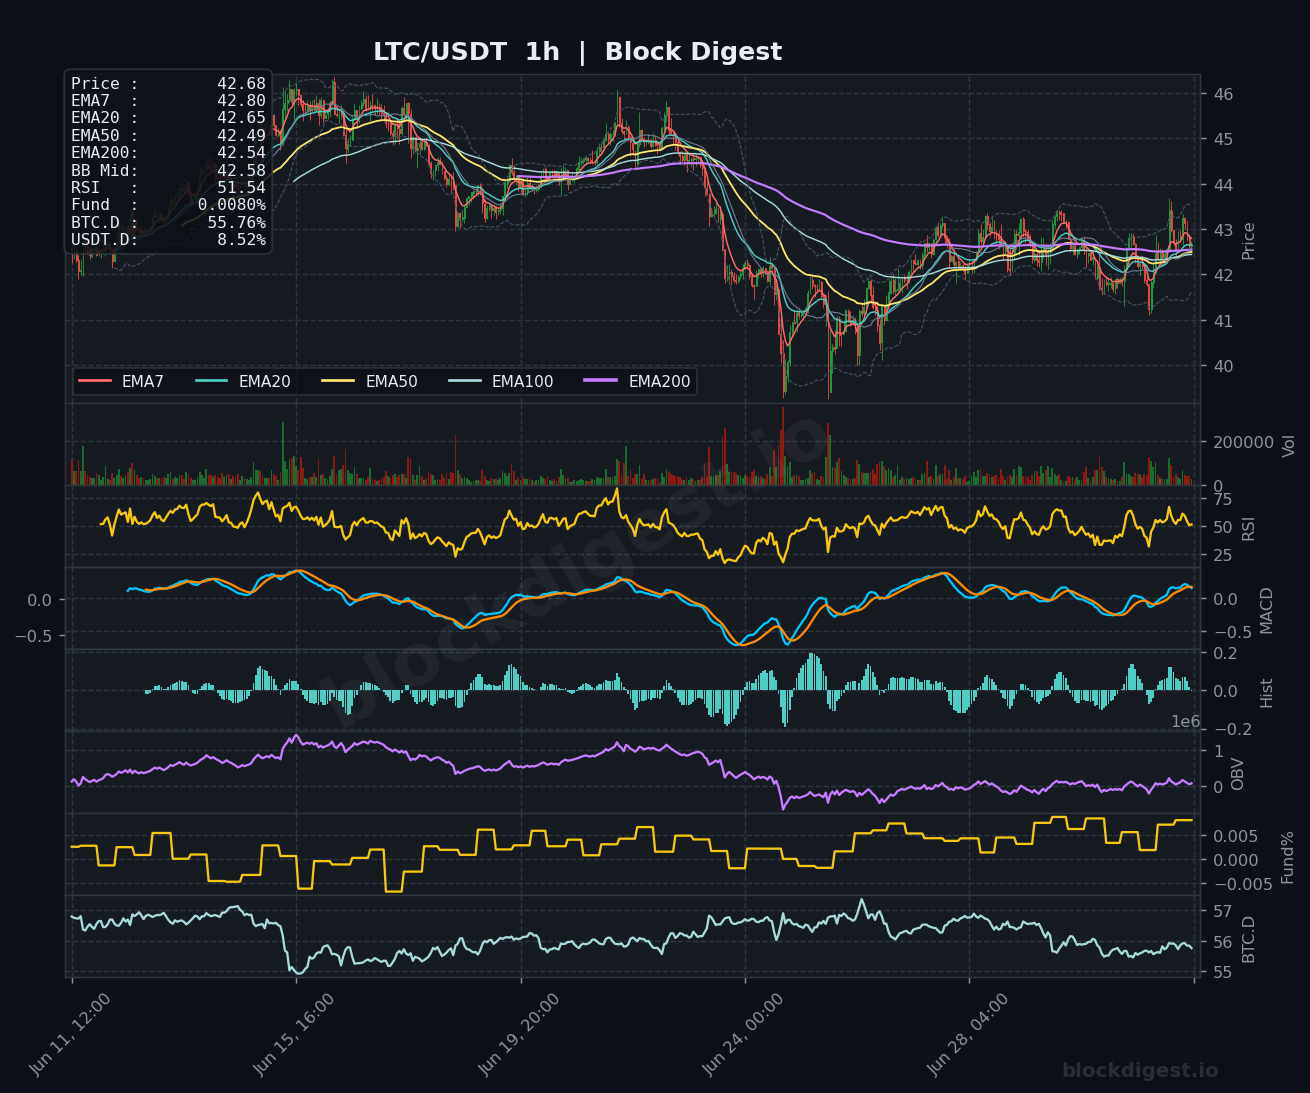
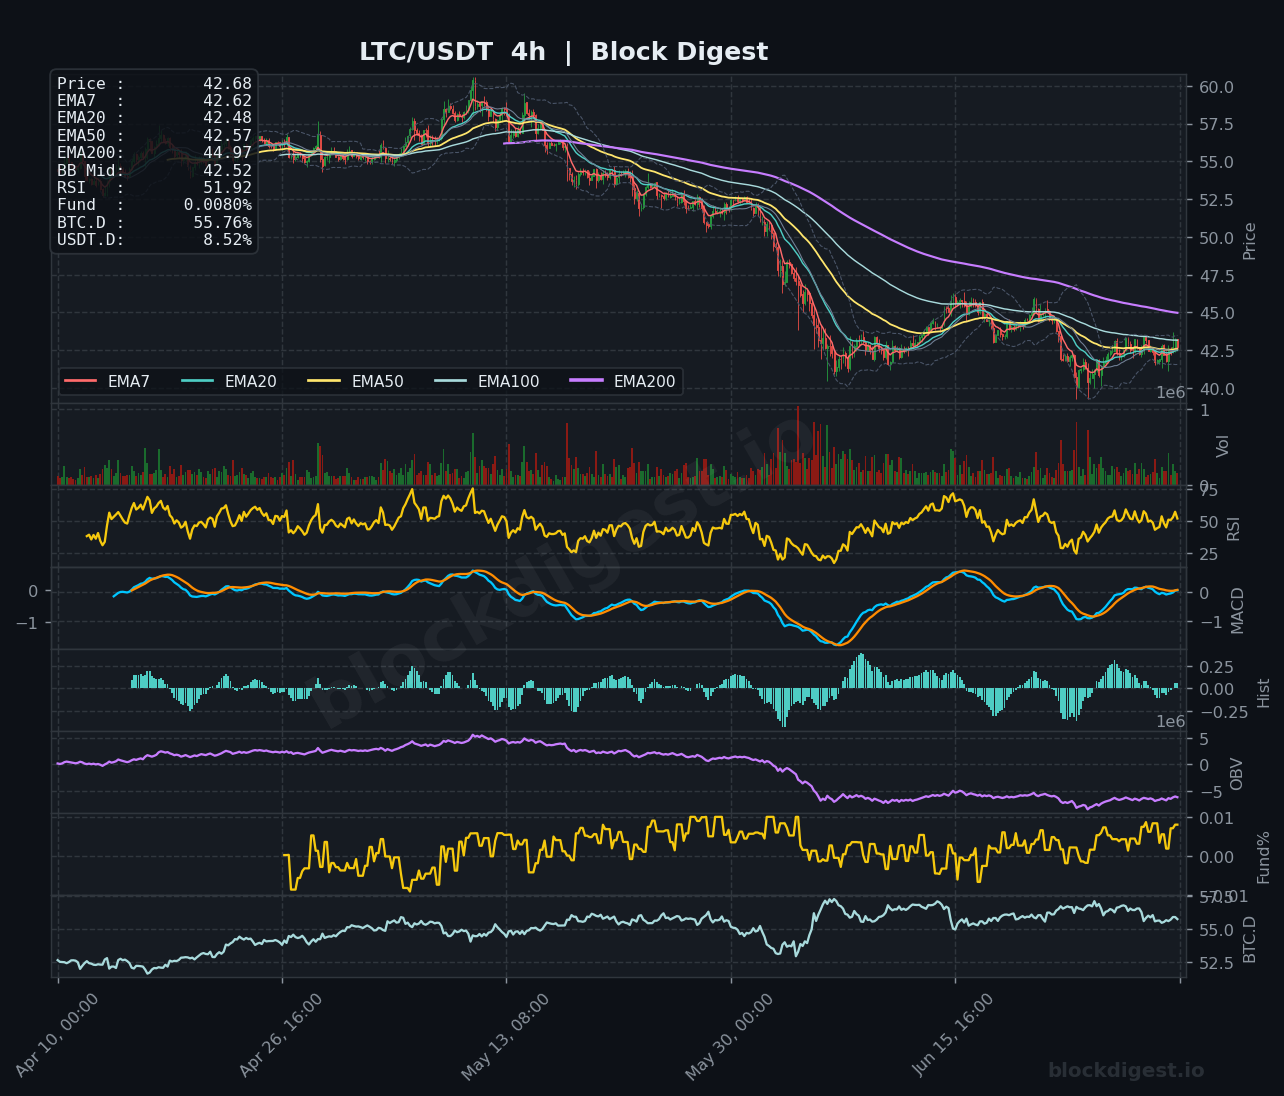
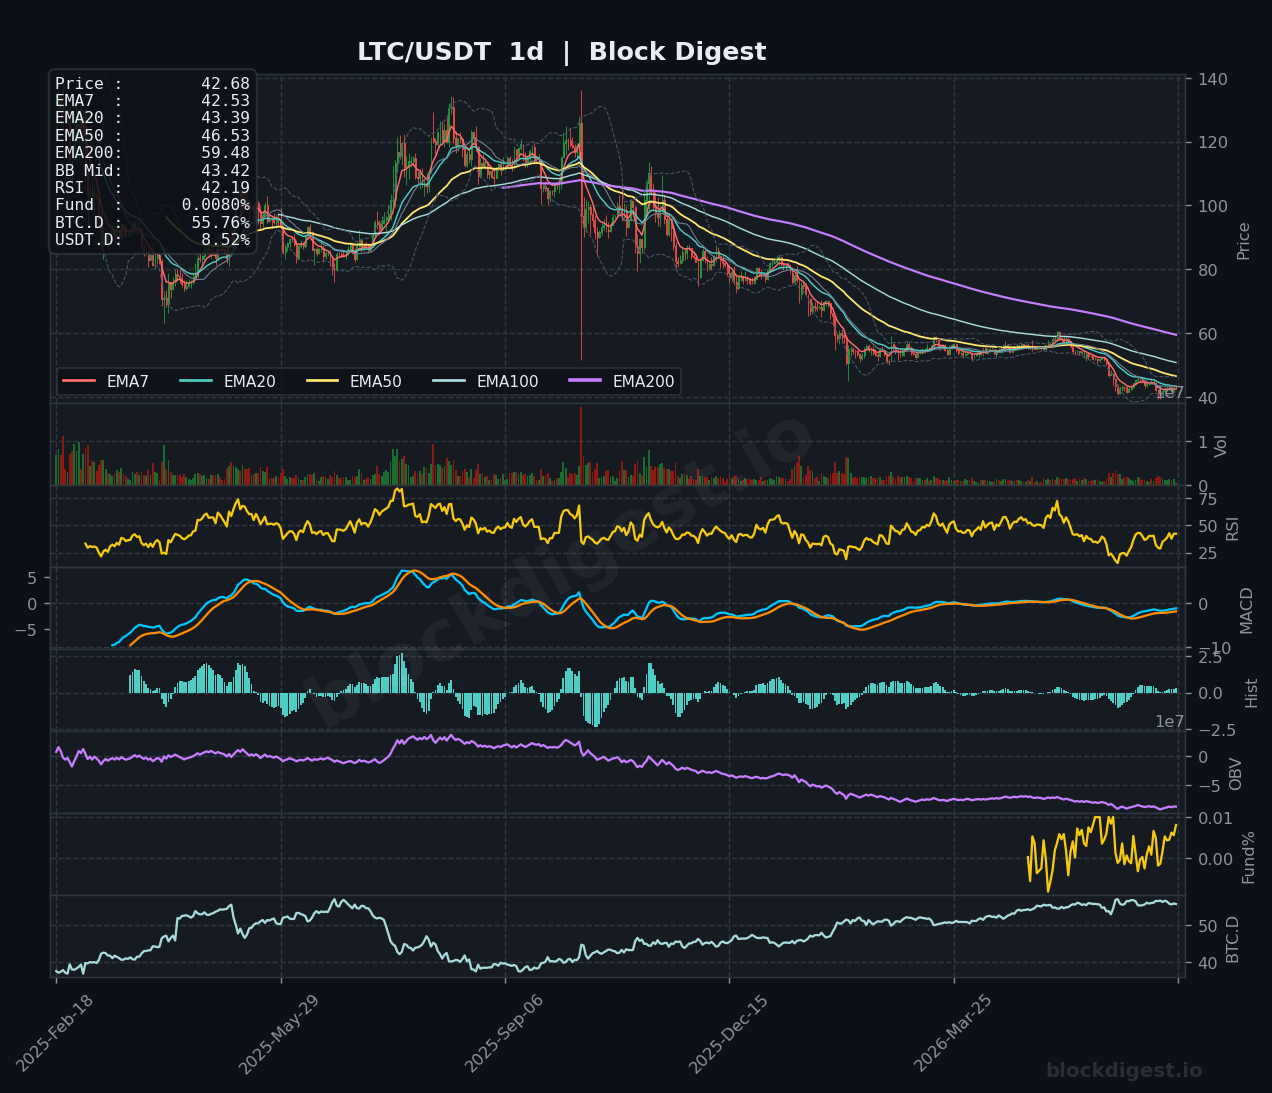
LTC is trading at $42.68, with price action consolidating near multi-month lows following a prolonged downtrend. On the 1-hour chart, the EMAs are all tightly bunched between $42.49 and $42.80, with price threading through them and RSI at 51.54 sitting at neutral — the MACD has crossed back above zero on this timeframe, offering a small near-term positive signal. The 4-hour chart shows a similar picture, with RSI at 51.92 and MACD lines converging near zero after a prolonged bearish phase; OBV has begun to stabilize and tick higher over recent sessions, hinting at possible base-building. The daily chart remains deeply bearish structurally, with price ($42.68) well below EMA20 ($43.39), EMA50 ($46.53), and EMA200 ($59.48), while RSI at 42.19 sits in weak territory; however, the daily MACD histogram is showing very small positive bars for the first time in weeks, a tentative early signal. Bias is neutral on short timeframes with downside risk dominant on the daily; $44–$45 represents immediate overhead resistance and $40–$41 is a critical support floor.
TRON (TRX)
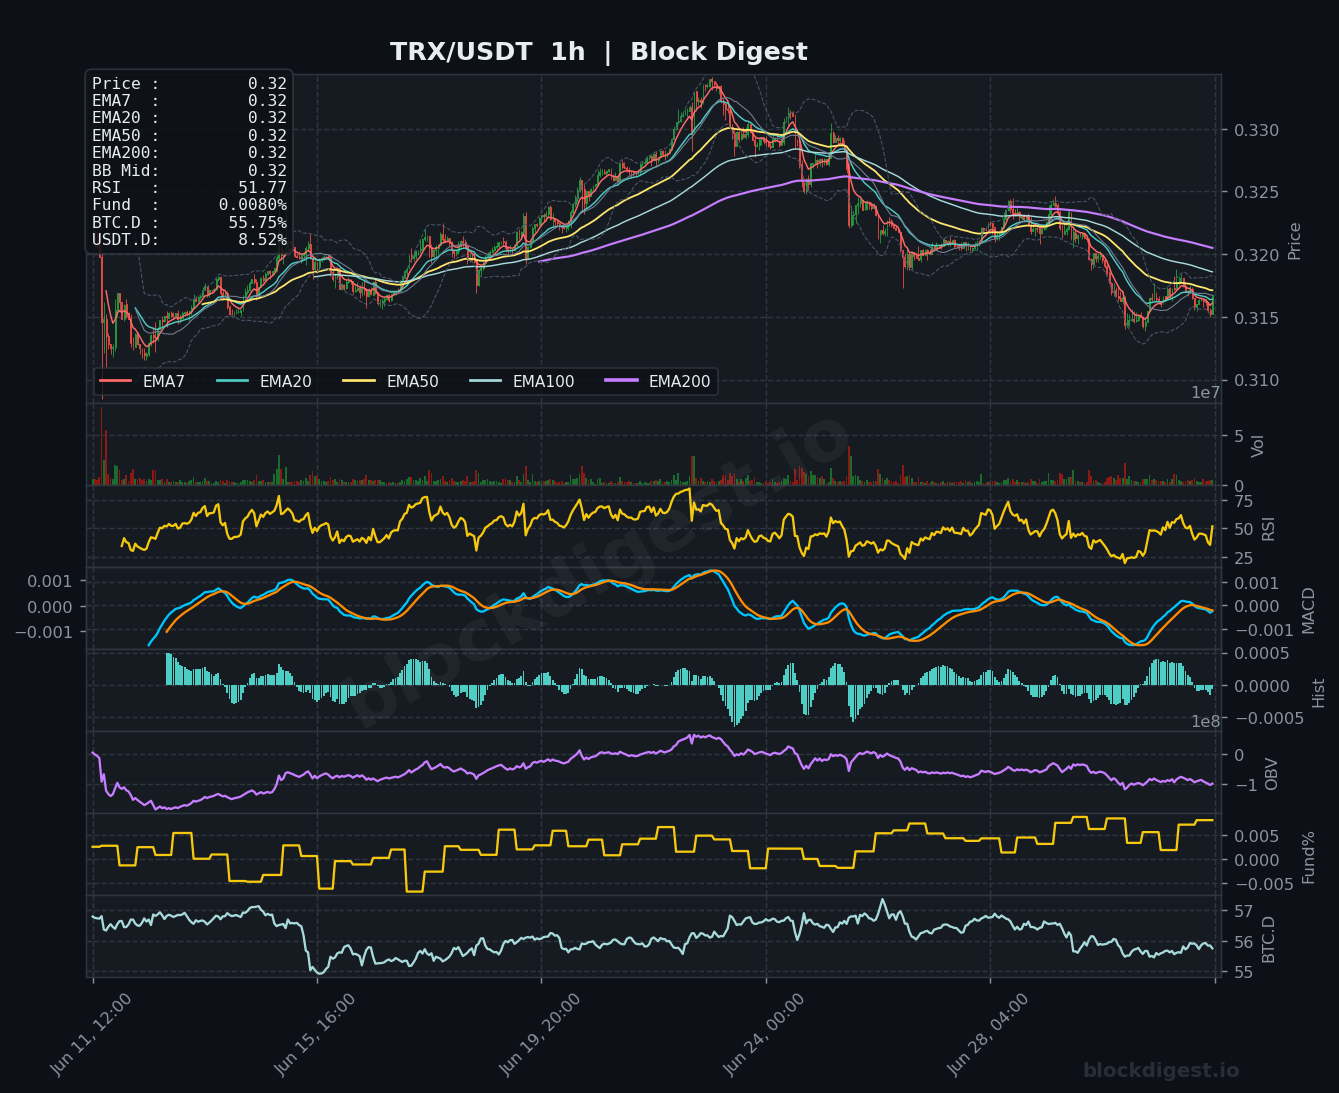
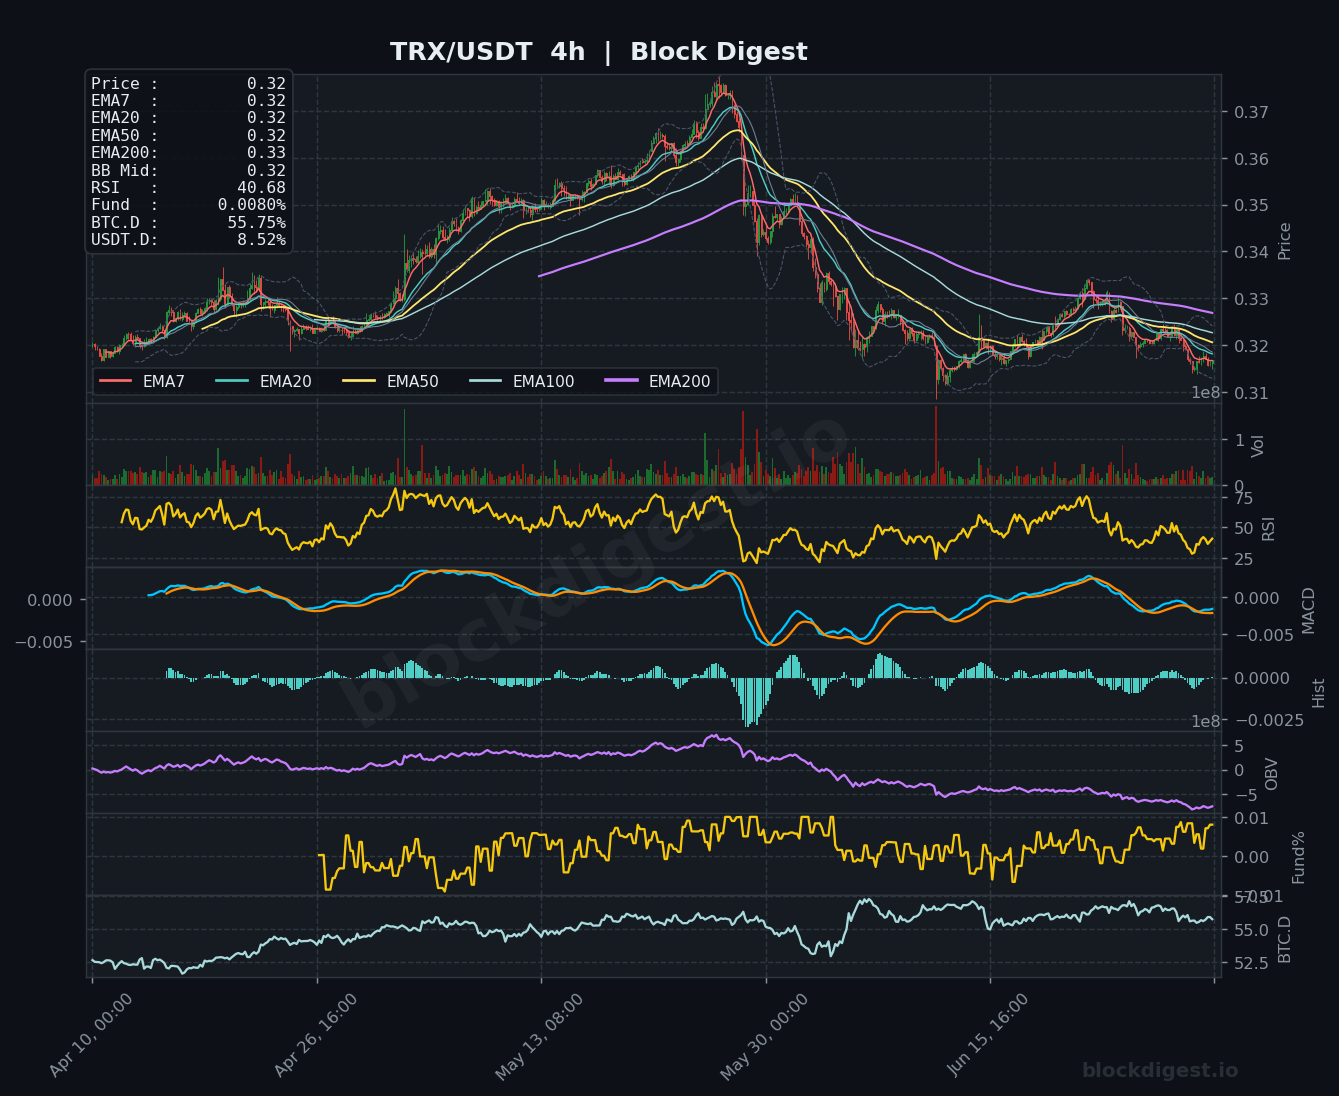
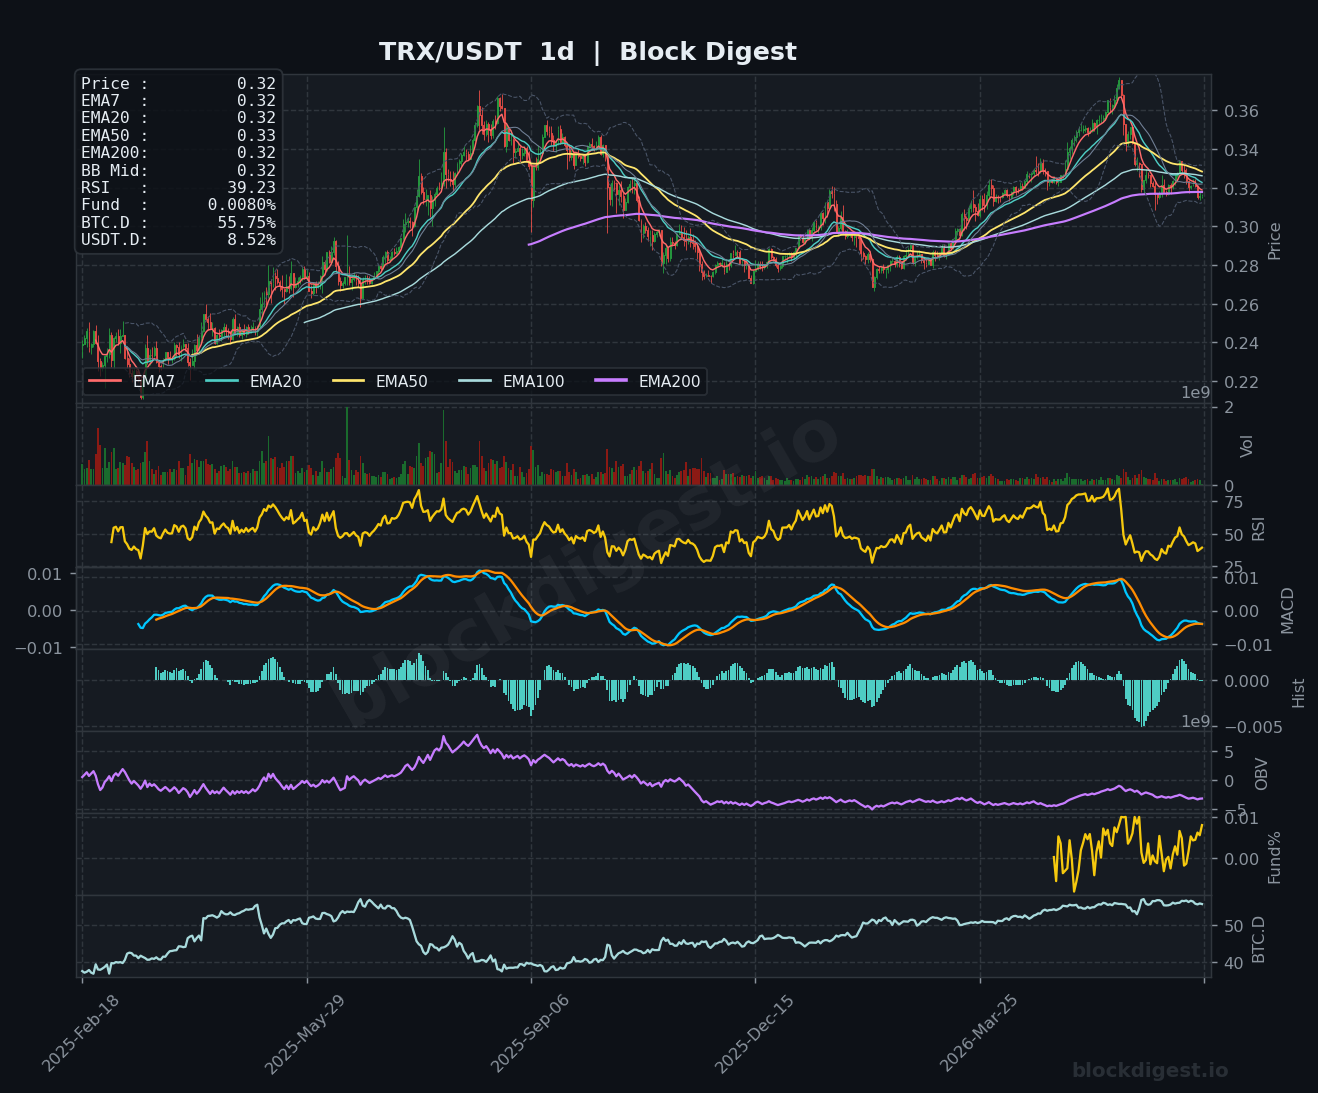
TRX is trading at $0.32, where it has found a degree of stability but faces pressure from declining momentum indicators across timeframes. On the 1-hour chart, all EMAs are clustered tightly at $0.32, RSI sits at 51.77 in neutral territory, and the MACD has just crossed above zero — a mildly constructive short-term signal, though histogram bars remain small. The 4-hour chart is more cautious, with RSI at 40.68 approaching oversold conditions, MACD lines still slightly negative, and OBV drifting lower — indicating that the daily consolidation around $0.32 is occurring against a backdrop of quiet distribution. The daily chart shows RSI at 39.23 continuing to weaken from a recent peak, with the EMA50 at $0.33 acting as immediate overhead resistance that has capped rallies; price is sitting just below EMA7 ($0.32) and EMA20 ($0.32), while the EMA200 at $0.32 provides a technical support confluence at current levels. The short-term bias is neutral-to-bearish, with a hold above $0.315 needed to prevent a test of the $0.30 support zone.
Altcoin Outlook
The altcoin space as a whole presents a bifurcated picture heading into early July 2026: SOL stands out as the clear near-term leader with genuine momentum, reclaiming key EMAs and posting the strongest gains, while the remaining assets in this cohort are either in structural downtrends (BNB, XRP, LTC, DOGE) or range-bound with bearish undercurrents (TRX). The extreme oversold RSI readings on DOGE and BNB daily charts warrant close monitoring, as these conditions can precede sharp short-covering rallies — but without a meaningful shift in OBV or MACD on higher time
Disclaimer: This analysis is for informational purposes only and does not constitute financial advice. Cryptocurrency markets are highly volatile and unpredictable. All trading decisions should be made based on your own research and risk tolerance. Block Digest is not responsible for any financial losses incurred as a result of acting on this content.
Stay Ahead of the Market
Follow BlockDigest for crypto market intelligence, research and real-time updates.


