
Market Overview
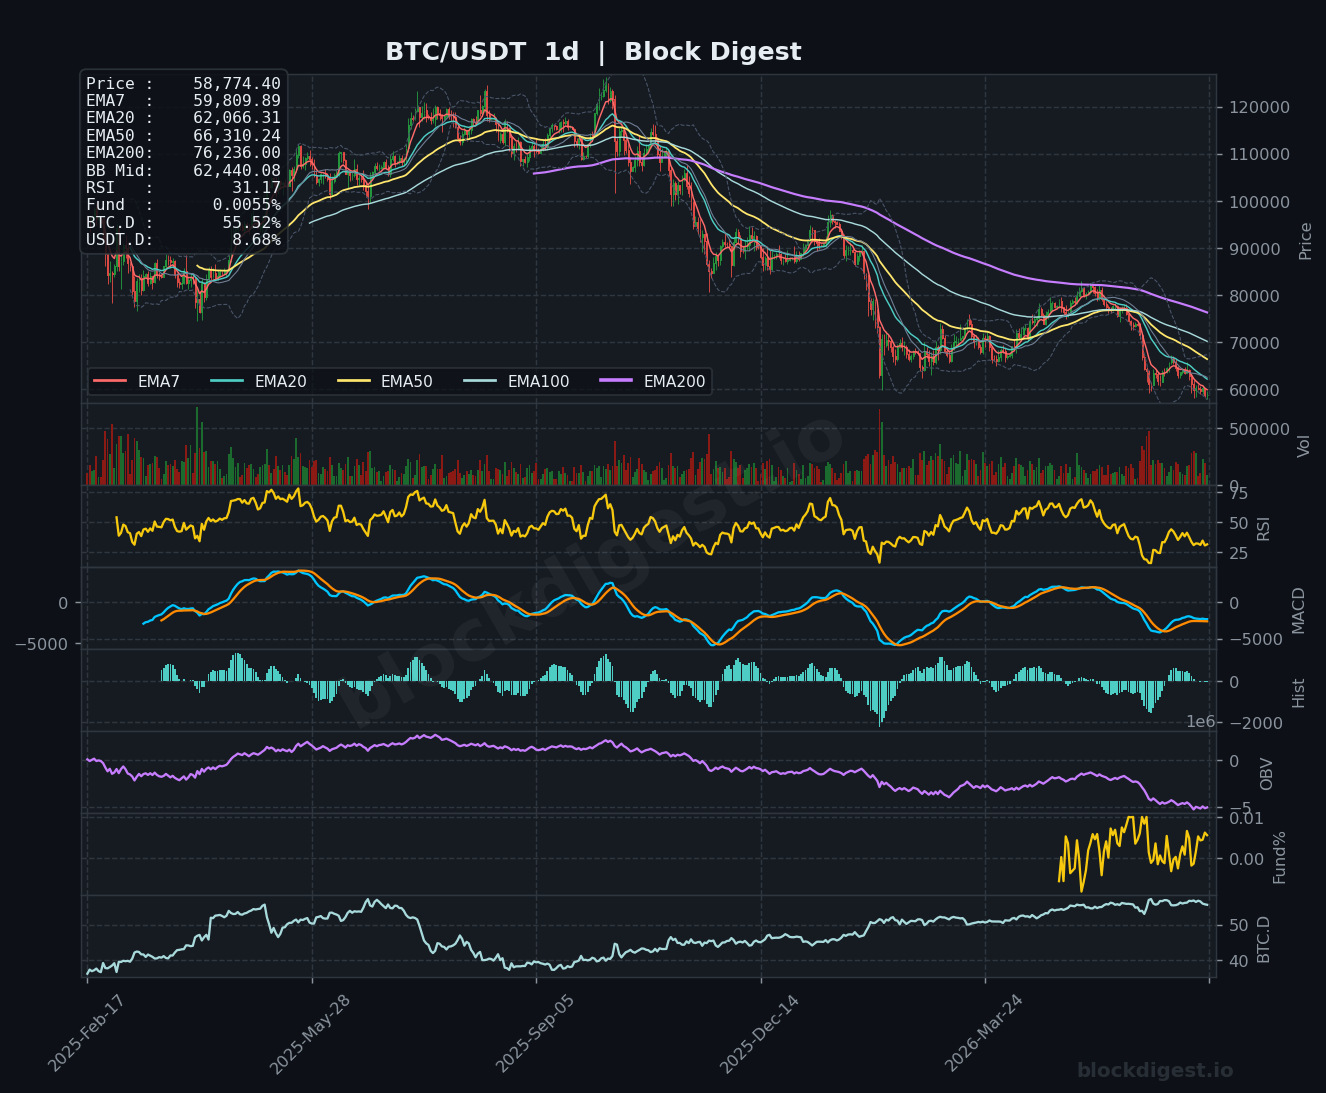
BTC/USDT is currently trading at $58,774–$58,778, sitting below all major EMAs across every timeframe — a structurally bearish configuration. On the daily chart, price has failed to reclaim the EMA7 ($59,809) and trades well beneath the EMA20 ($62,066), EMA50 ($66,310), and EMA200 ($76,236), confirming a sustained downtrend from the cycle highs. The Bollinger Band midline on the daily sits at $62,440, acting as dynamic overhead resistance, with price currently pressing against the lower band — a sign of continued selling pressure rather than mean reversion. The dominant daily trend remains unambiguously bearish, with each EMA in a clean bearish stack.
Multi-Timeframe Confluence
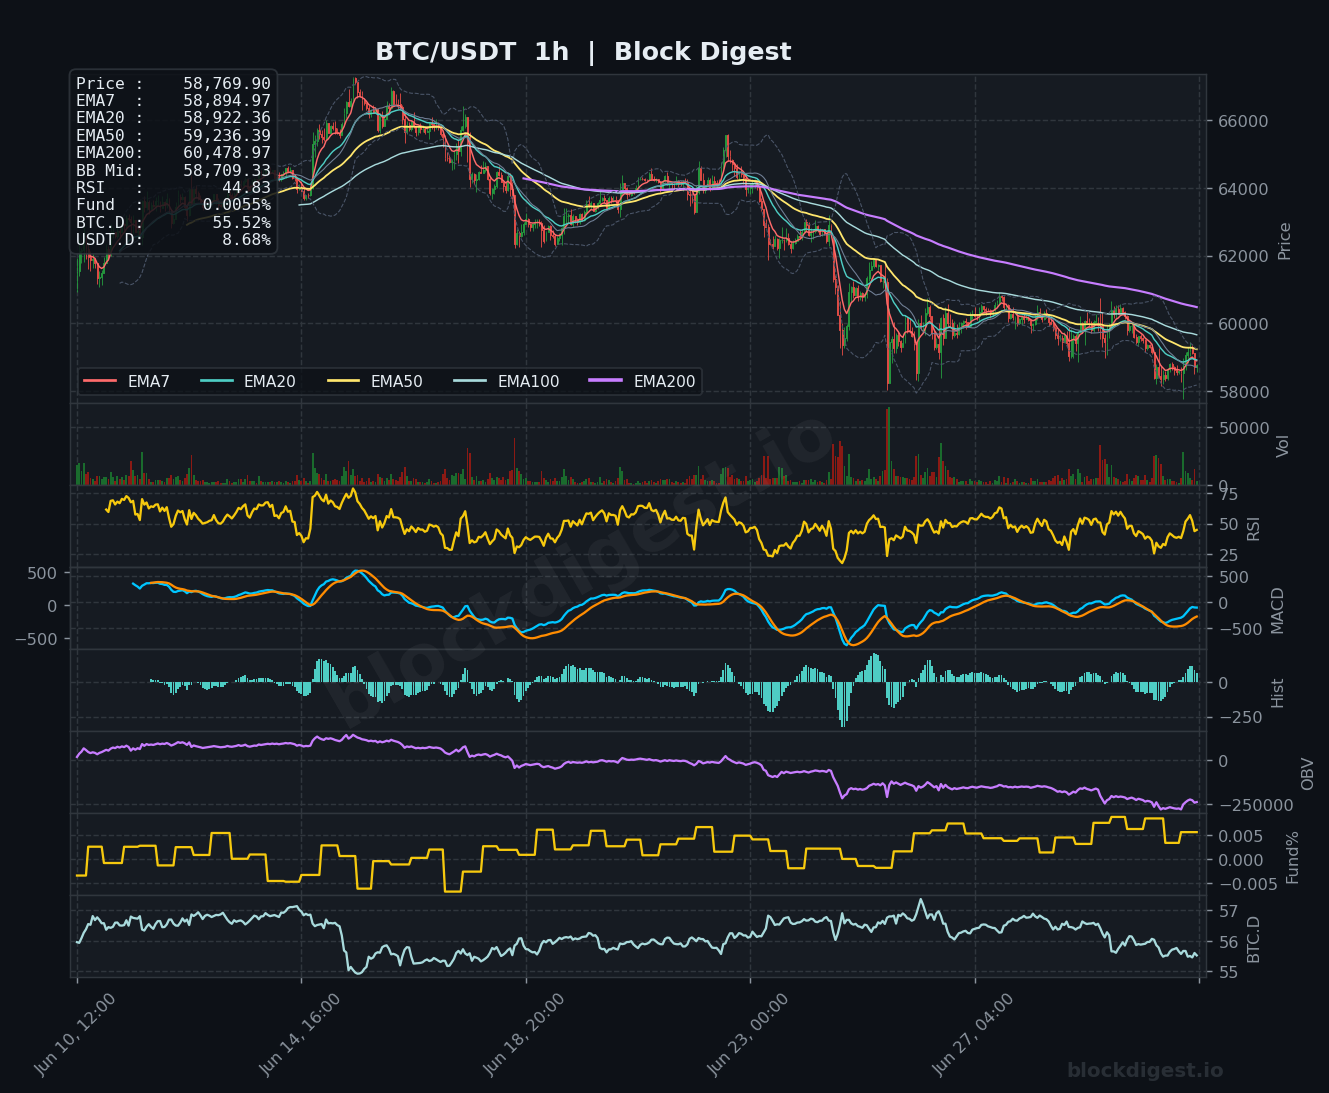
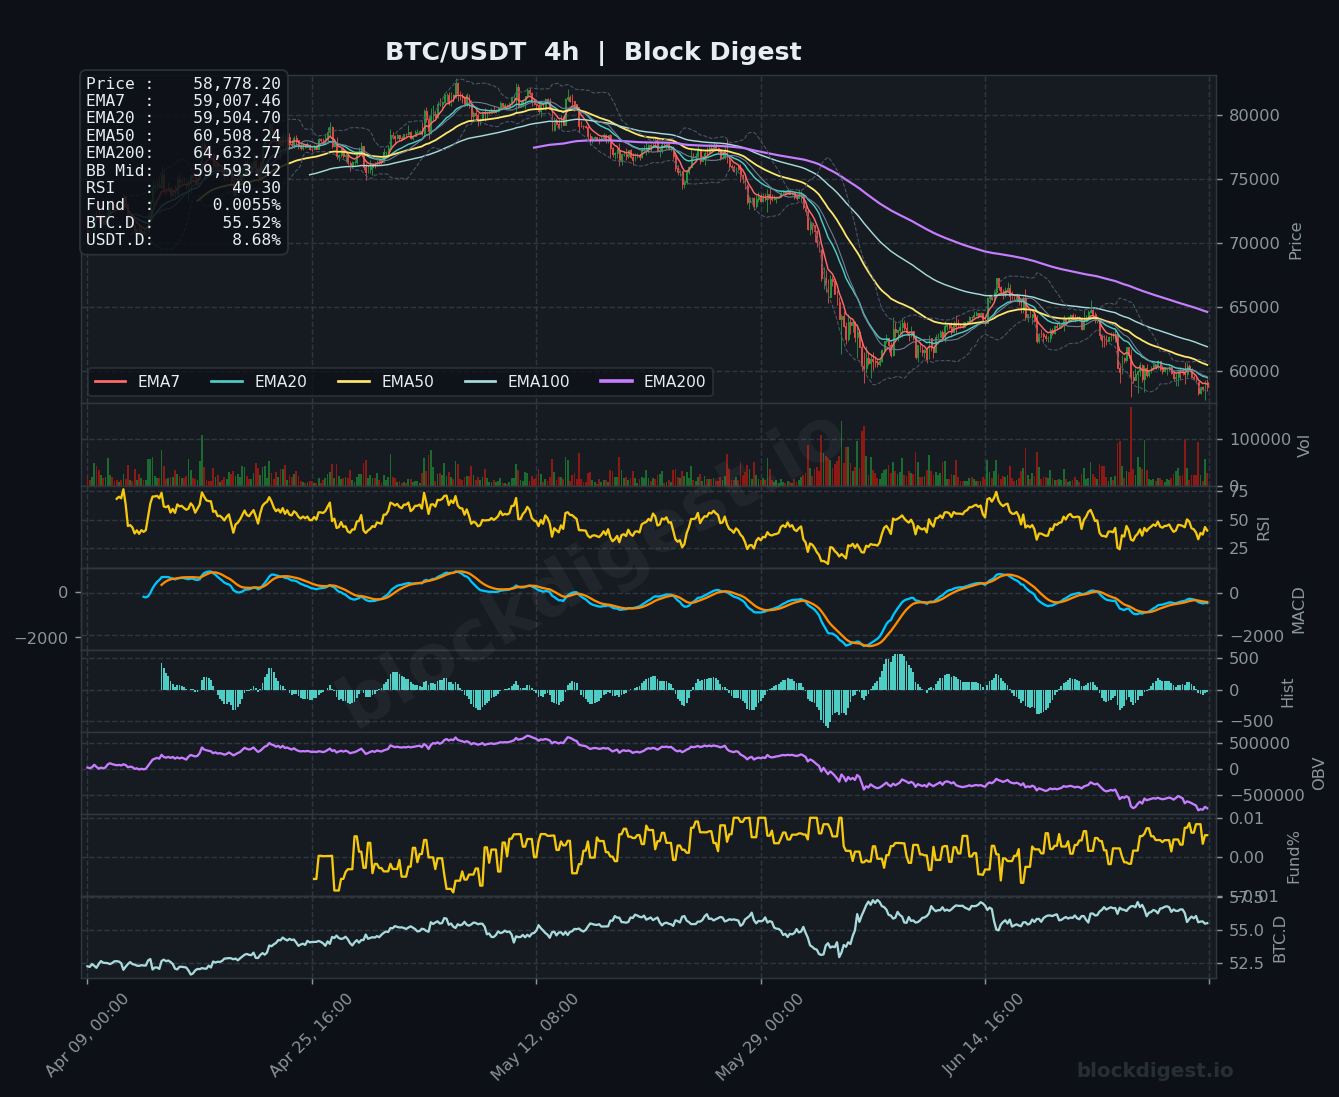
Across all three timeframes, the EMA structure tells the same story: price is beneath every key moving average, with EMAs in descending order from short to long. On the 1-hour chart, price is trading below EMA7 ($58,894), EMA20 ($58,922), EMA50 ($59,236), and EMA200 ($60,478), indicating there is no short-term relief. The 4-hour chart similarly shows price trapped below all EMAs, with the EMA200 at $64,632 representing a distant ceiling that would require significant recovery to challenge. Short-term momentum on the 1-hour and 4-hour timeframes does not diverge from the higher timeframe trend — all three are aligned bearishly with no cross-timeframe support emerging at current levels.
Key Levels to Watch
- Resistance: $59,236 — the 1-hour EMA50, the first overhead level price must reclaim to signal any short-term stabilization
- Resistance: $59,504–$59,593 — confluence of the 4-hour EMA20 and Bollinger Band midline, a meaningful recovery pivot
- Resistance: $62,066–$62,440 — daily EMA20 and daily BB midline cluster, the critical zone that would need to be reclaimed to neutralize the broader bearish structure
- Support: $58,500 — near-term psychological and structural level based on recent consolidation lows visible on the 1-hour chart
- Support: $57,500–$58,000 — lower Bollinger Band territory on the 4-hour chart; a breach here would accelerate selling
- Support: $55,000–$56,000 — major structural demand zone referencing prior consolidation from the daily timeframe; a last line of defense before deeper drawdown
Momentum & On-Chain Signals
The RSI readings are deeply weak across all timeframes: 44.83 on the 1-hour, 40.30 on the 4-hour, and a concerning 31.17 on the daily — the latter approaching oversold territory but not yet at an extreme that typically triggers mechanical bounces. The daily MACD remains in bearish territory with the signal line still negative, and the histogram, while showing slight compression, has not yet produced a bullish crossover signal. OBV is trending sharply lower on both the 4-hour and daily charts, confirming sustained net distribution and a lack of meaningful accumulation at current levels. The funding rate at +0.0055% is modestly positive, suggesting a slight long bias in perpetual markets — a mild contrarian risk if price continues lower, as liquidations could accelerate a flush.
BTC Dominance & Market Sentiment
BTC dominance sits at 55.52%, which remains relatively elevated on a historical basis, suggesting the market has not broadly rotated into altcoins — capital appears to be moving toward stablecoins rather than rotating within crypto. USDT.D at 8.68% reflects meaningful stablecoin accumulation, consistent with a risk-off posture across the broader market. For BTC specifically, the elevated dominance provides limited comfort; it indicates altcoins are underperforming even more severely, pointing to overall market de-risking rather than selective BTC strength.
Risk Scenarios
- Bullish case: A decisive hourly close above $59,500 with expanding volume could signal a short-term relief rally targeting the $62,000–$62,440 resistance cluster; daily RSI nearing oversold at 31 increases the probability of a technical bounce if buyers defend the $58,000–$58,500 zone.
- Bearish case: A confirmed break and close below $58,000 on the 4-hour chart would expose the $55,000–$56,000 structural support; continued OBV deterioration paired with a daily RSI breakdown below 30 would validate a deeper corrective leg.
Outlook
The overall bias remains bearish heading into July 1, 2026, with price structurally compromised below all major EMAs on every timeframe and no credible signs of institutional accumulation in OBV. The most critical trigger to watch in the next 24–48 hours is whether price can defend the $58,000–$58,500 zone; failure here shifts the immediate target toward $55,000–$56,000. Conversely, a reclaim of $59,500 on the 4-hour with volume would be the minimum required to shift the short-term narrative toward cautious neutrality. Until the daily EMA7 ($59,809) is recaptured and held, any intraday bounces should be treated as counter-trend moves within a dominant downtrend.
Disclaimer: This analysis is for informational purposes only and does not constitute financial advice. Cryptocurrency markets are highly volatile and unpredictable. All trading decisions should be made based on your own research and risk tolerance. Block Digest is not responsible for any financial losses incurred as a result of acting on this content.
Stay Ahead of the Market
Follow BlockDigest for crypto market intelligence, research and real-time updates.


