
Author: BD Research Desk
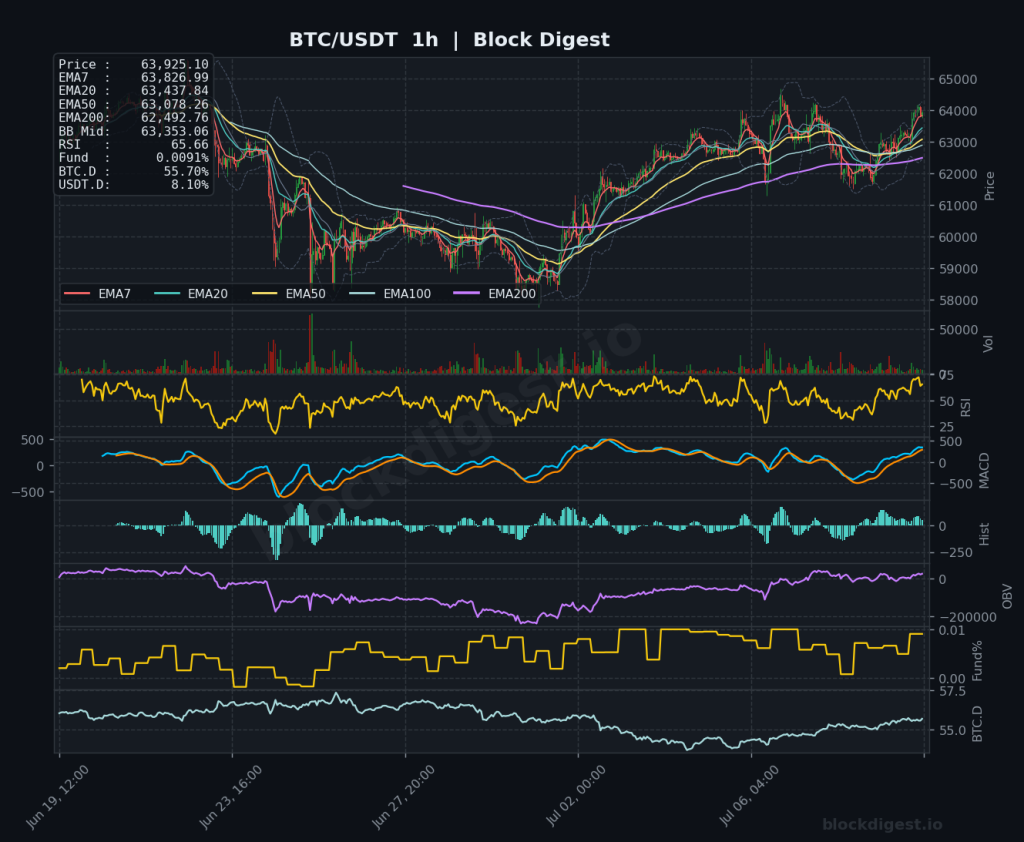
Bitcoin Daily Analysis: Bitcoin at $63,925 Bouncing Above EMA Levels
Market Overview Bitcoin is trading at $63,925 as of July 10, 2026, holding above all short-term EMAs on the 1-hour chart while attempting to reclaim meaningful ground following a recovery from late-June lows near $58,000. On the daily timeframe, price remains well below the EMA200 ($75,037) and EMA50 ($65,374), confirming that the broader macro trend...
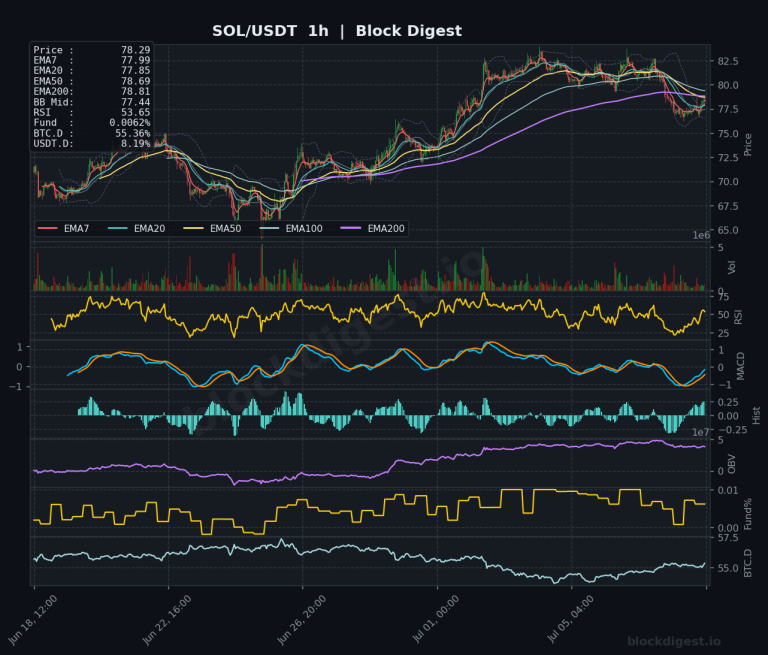
Altcoin Daily Analysis: Bitcoin slides to $62K amid geopolitical tensions
Market Context The altcoin market is navigating a distinctly risk-off environment as of July 9, 2026, with Bitcoin sliding to the $62,000 area amid rising geopolitical tensions tied to U.S.-Iran friction driving oil and bond yields higher. BTC dominance sits at 55.36%, reflecting capital rotation back toward Bitcoin relative safety, while USDT dominance at 8.19%...
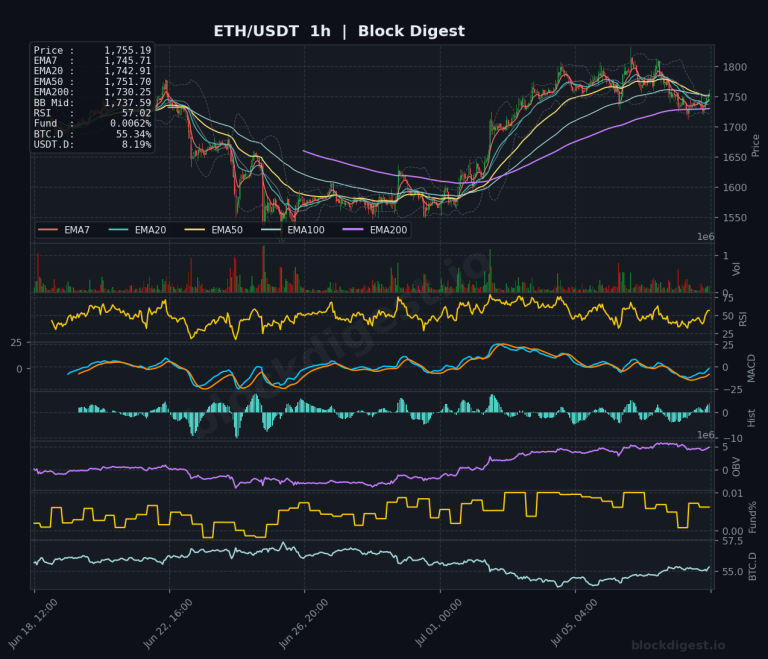
Ethereum Daily Analysis: ETH at $1,755 Between EMA50 and EMA200 Resistance
Market Overview ETH/USDT is currently trading at approximately $1,755, situated in a technically ambiguous zone after a meaningful recovery from the mid-cycle lows near $1,550. On the daily timeframe, the dominant structure remains broadly bearish — price sits well below the EMA200 ($2,237) and EMA50 ($1,800), both of which are sloping downward and acting as...
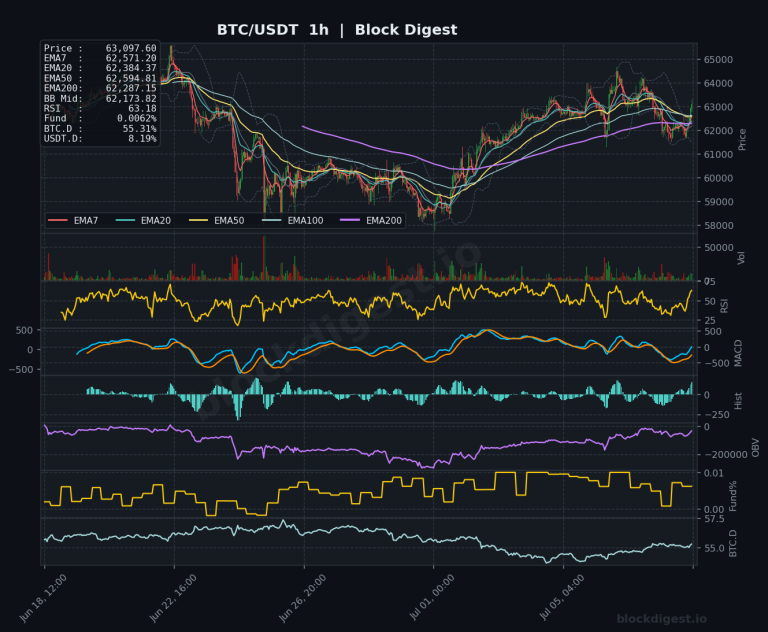
Bitcoin Daily Analysis: Bitcoin at $63K Below EMA50 in Downtrend
Market Overview Bitcoin is currently trading at approximately $63,091–$63,097 across timeframes, sitting in a structurally precarious position roughly 50% below its all-time high of $126,210 set in October 2025. On the daily chart, price remains firmly below the EMA50 ($65,429) and EMA200 ($75,177), with the entire short-to-medium-term EMA stack in bearish alignment — a clear...
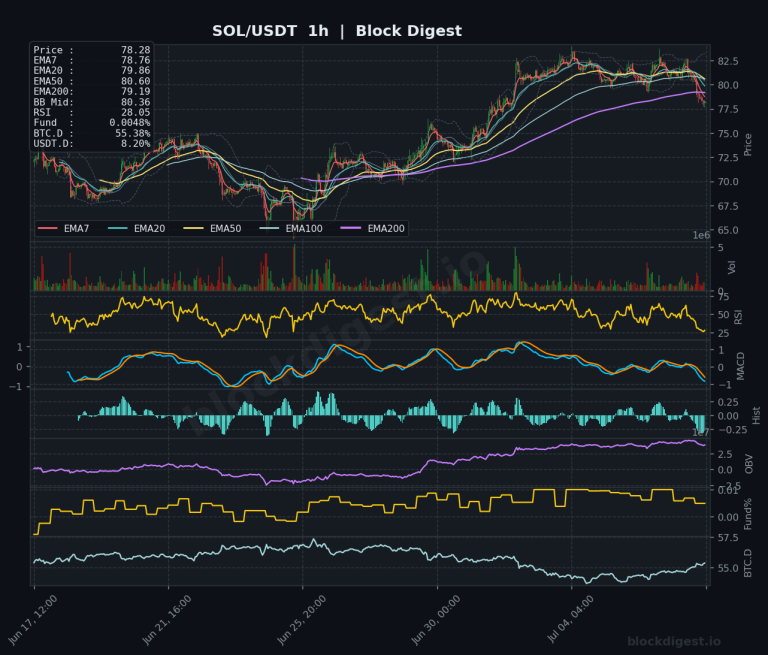
Altcoin Daily Analysis: BTC Dominance 55.38% as USDT Capital Sidelines
Market Context The broader altcoin market is navigating a cautious environment as BTC dominance holds at 55.38%, indicating that Bitcoin continues to command a significant share of total crypto capital with limited rotation into alts at scale. USDT dominance at 8.20% remains notably elevated, signaling that a meaningful portion of sidelined capital has yet to...
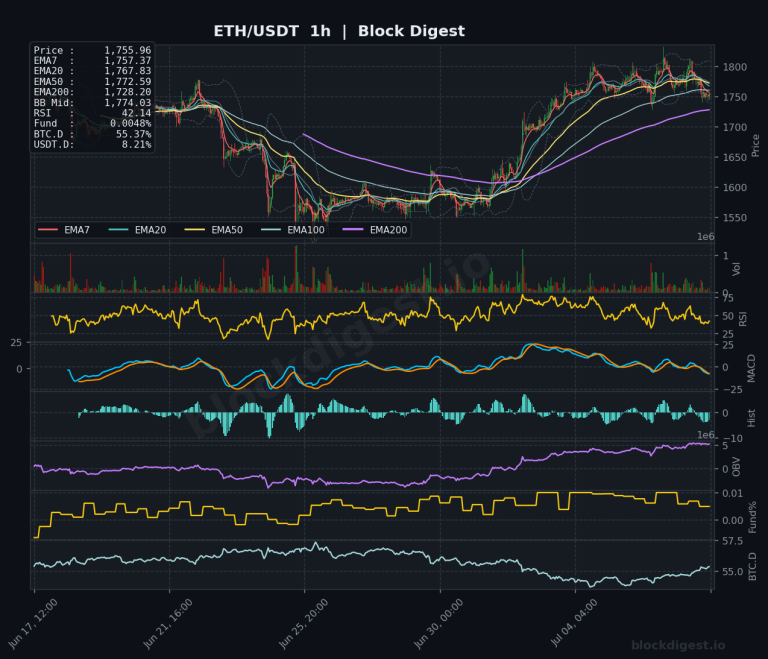
Ethereum Daily Analysis: ETH Under EMA Stack Pressure at $1,755
Market Overview ETH/USDT is trading at approximately $1,755.96 as of July 8, 2026, sitting beneath a cluster of short-term resistance formed by the EMA7 ($1,757.37), EMA20 ($1,767.83), and EMA50 ($1,772.59) on the 1-hour chart — a bearish EMA stack that reflects fading near-term momentum following a notable recovery from the mid-$1,500s. On the daily timeframe,...
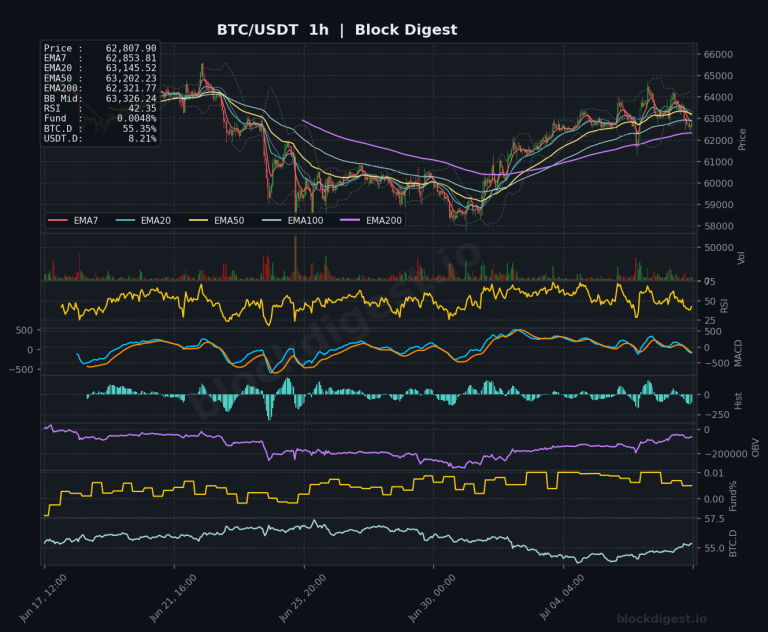
Bitcoin Daily Analysis: Bitcoin at $62.8K Tests EMA Recovery
Market Overview Bitcoin is currently trading at approximately $62,807, situated in a technically precarious position roughly 50% below its all-time high of $126,210 set in October 2025. On the daily timeframe, price action reflects a prolonged downtrend from those peak levels, with BTC now attempting a short-term recovery after finding a local bottom near the...
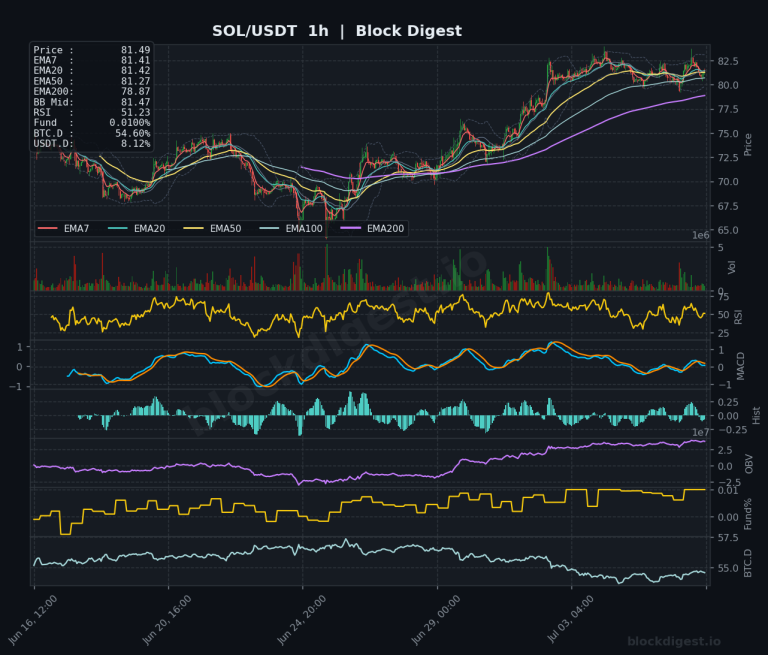
Altcoin Daily Analysis: Bitcoin dominance caps altcoin rallies at 54.60%
Market Context The broader altcoin market is navigating a cautious environment as Bitcoin dominance sits at 54.60% — a level that has historically capped sustained altcoin rallies — while USDT dominance at 8.12% signals that a meaningful portion of capital remains parked on the sidelines. The mixed 24-hour performance across the six coins reviewed today...
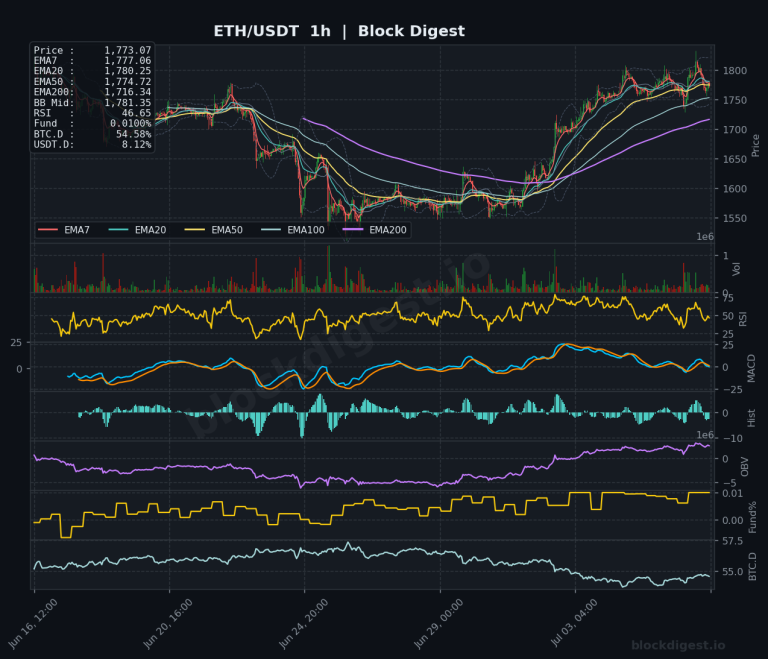
Ethereum Daily Analysis: Ethereum Consolidates at $1,771 Below $1,800 Resistance
Market Overview Ethereum is currently trading at approximately $1,771–$1,773, consolidating just below the psychologically significant $1,800 level after a sharp recovery from lows near $1,550 seen in late June. On the daily timeframe, price remains well beneath the declining EMA200 ($2,249) and EMA50 ($1,804), confirming the dominant macro trend is still bearish — ETH has...
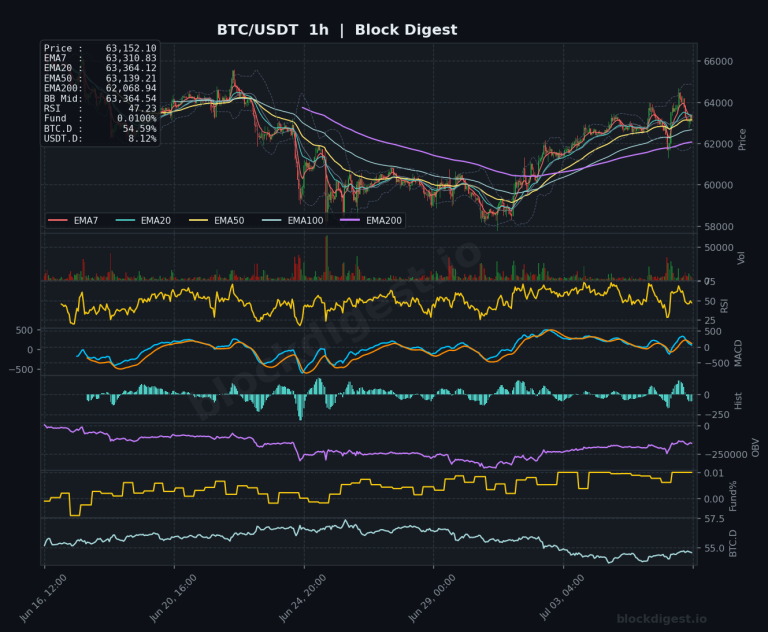
Bitcoin Daily Analysis: Bitcoin at $63K, EMA200 Downtrend Persists
Market Overview Bitcoin is trading at $63,152.10 as of July 7, 2026, attempting a fragile recovery after hitting a 21-month low just days prior. On the daily timeframe, the dominant structure remains deeply bearish — price sits well below the EMA200 at $75,480.34 and the EMA50 at $65,651.13, confirming the macro downtrend that has been...
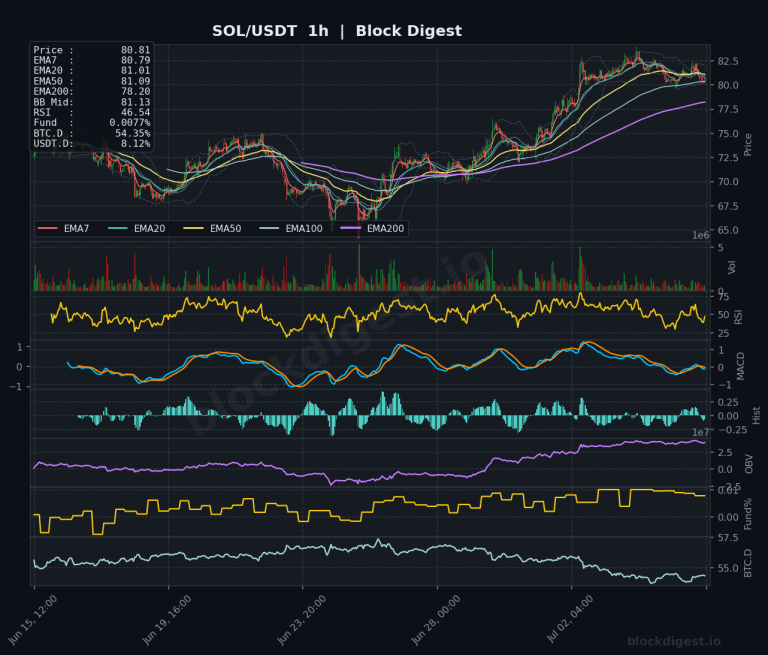
Altcoin Daily Analysis: Bitcoin Dominance at 54.35%, Altcoins Show Recovery Signs
Market Context Bitcoin dominance currently sits at 54.35%, reflecting a market environment where BTC continues to command a disproportionate share of total crypto capital, keeping sustained altcoin rotation subdued. USDT dominance at 8.12% remains relatively elevated, signaling that a meaningful portion of market participants are still holding dry powder on the sidelines rather than deploying...
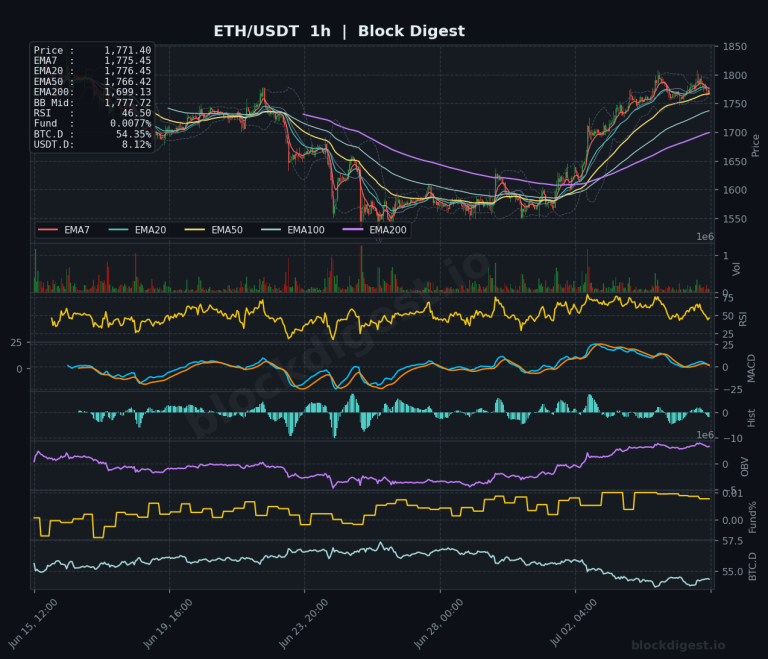
Ethereum Daily Analysis: ETH Bounces from $1,540 Lows, Eyes $1,805 Resistance
Market Overview ETH/USDT is currently trading at $1,771.40, caught in a technically nuanced position following a sharp recovery from multi-month lows near $1,540. On the daily timeframe, price remains below the critical EMA50 at $1,805.18, while trading above the EMA7 ($1,728.00) and EMA20 ($1,701.74), suggesting near-term bullish momentum has emerged but has yet to confirm...