
Market Overview
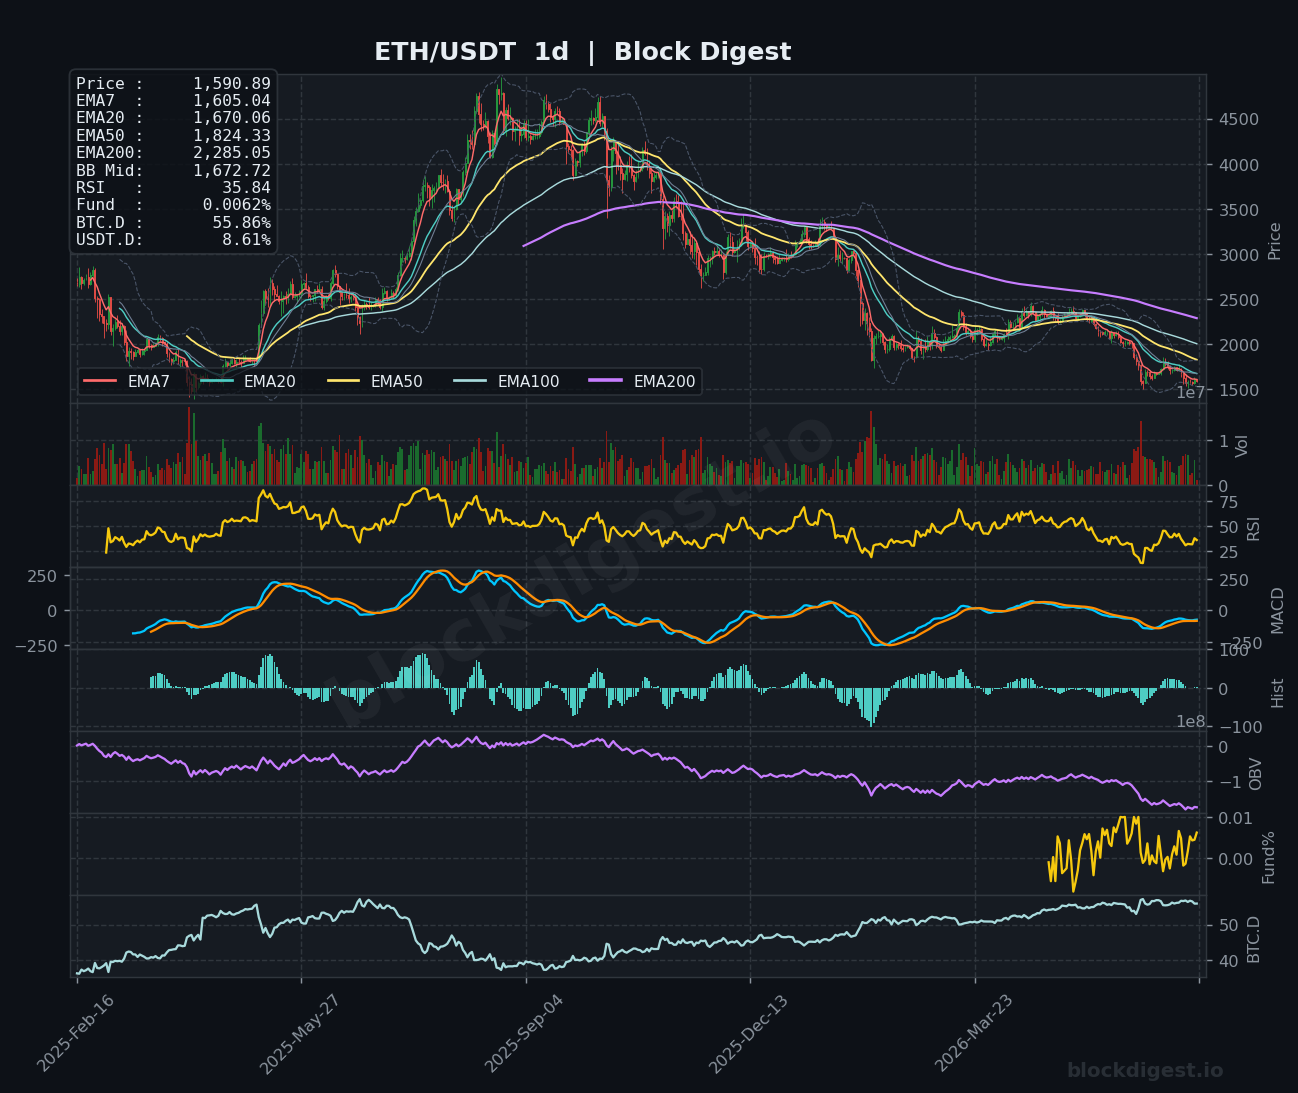
ETH/USDT is currently trading at $1,590.78, caught in a pronounced downtrend that has persisted across multiple timeframes. On the daily chart, price sits well below all major EMAs — the EMA7 at $1,605.04, EMA20 at $1,670.06, EMA50 at $1,824.33, and EMA200 at $2,285.05 — confirming a deeply bearish macro structure. The Bollinger Band midline on the daily resides at $1,672.72, acting as dynamic resistance overhead, and price is currently pressing against the lower band, suggesting extended selling pressure without meaningful relief. The broader trend from the 2025 highs above $4,500 represents a loss of over 60%, and the structure shows no confirmed reversal signals at this stage.
Multi-Timeframe Confluence
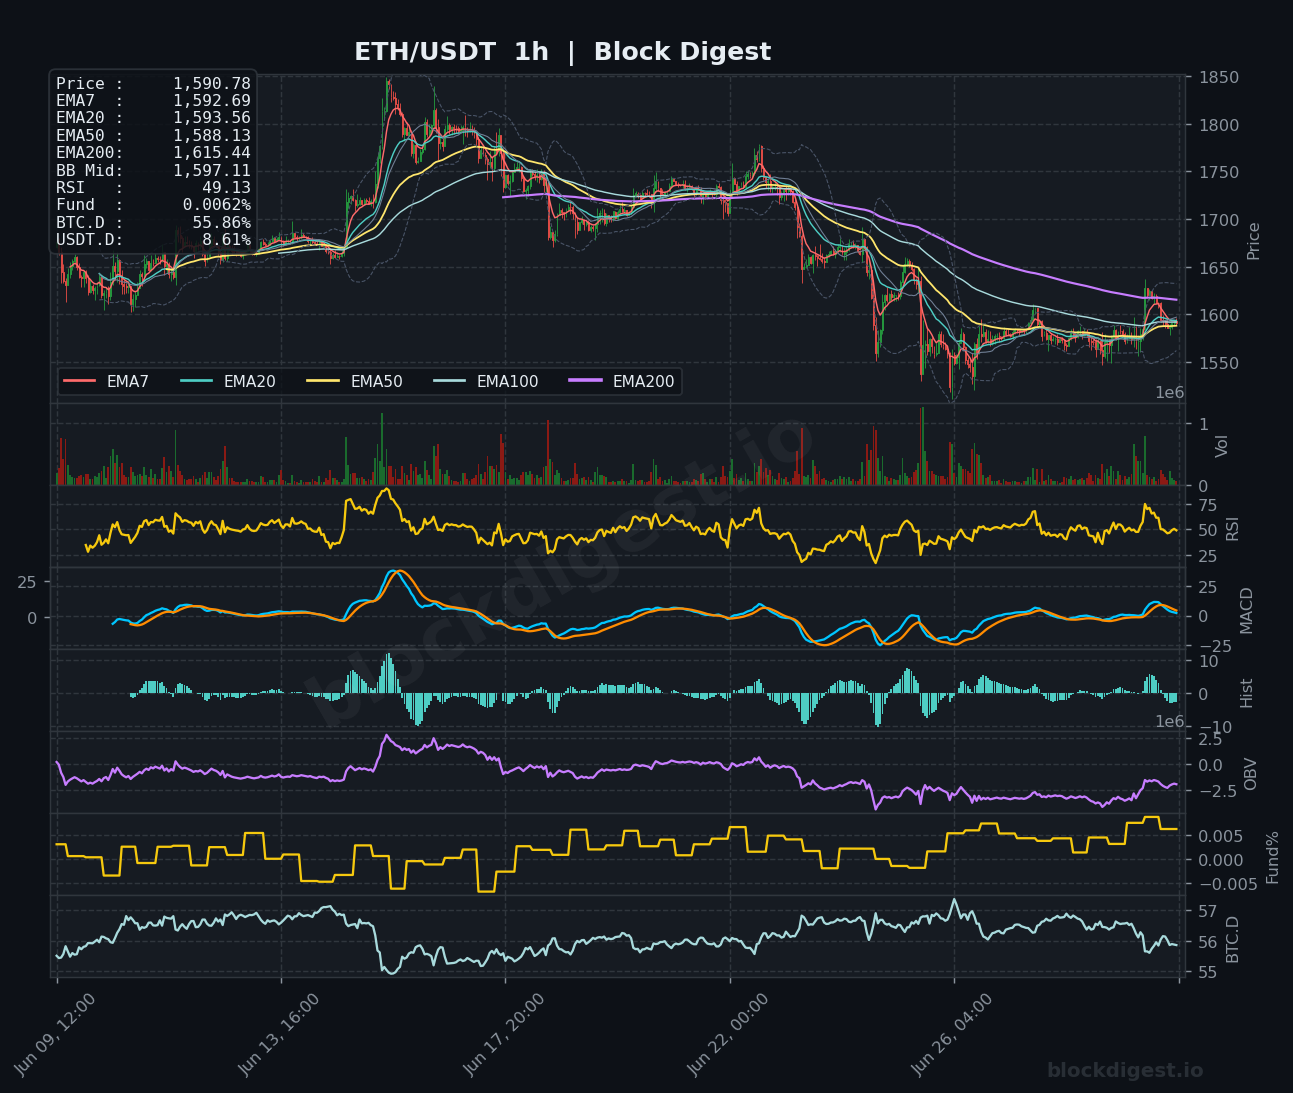
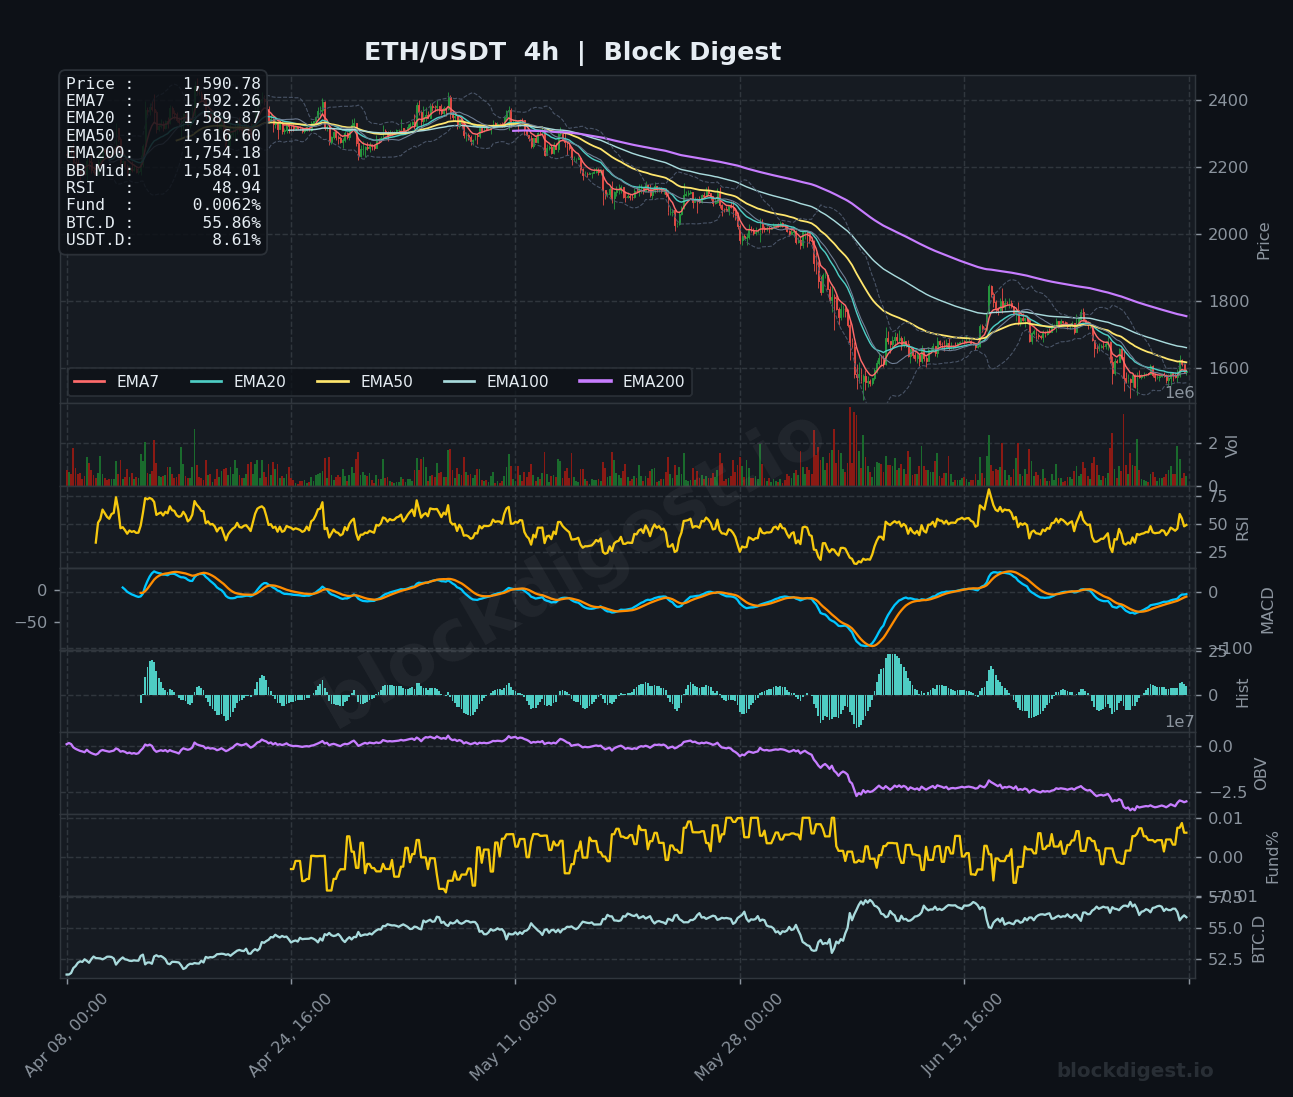
Across all three timeframes, the bearish alignment is remarkably consistent, with price trading below every meaningful EMA on the 1h, 4h, and 1d charts simultaneously. On the 1-hour chart, the EMA200 at $1,615.44 is applying immediate overhead resistance, and the short-term EMAs (7, 20, 50) are tightly clustered between $1,588 and $1,594, indicating a near-term consolidation phase after the recent sharp drop. The 4-hour chart reinforces the bearish case, with the EMA50 at $1,616.60 and EMA200 at $1,754.18 forming a thick resistance ceiling, while price has barely managed to stabilize near the BB midline of $1,584.01. There is no meaningful bullish divergence or EMA reclaim visible across timeframes that would suggest an imminent structural reversal.
Key Levels to Watch
- Resistance: $1,615–$1,616 — confluence of the 1h EMA200 ($1,615.44) and 4h EMA50 ($1,616.60), the most immediate ceiling for any bounce attempt
- Resistance: $1,670 — the daily EMA20, which has been a consistent rejection zone throughout the recent downtrend
- Resistance: $1,754–$1,760 — the 4h EMA200 ($1,754.18) and a prior consolidation zone, representing a major structural barrier for any recovery
- Support: $1,550–$1,560 — recent swing low region visible on the 1h chart and lower Bollinger Band on the 4h, a critical short-term floor
- Support: $1,500 — psychological round number with historical significance; a breach here would open deeper downside
- Support: $1,450–$1,460 — deeper macro support from late 2024 structure, last meaningful demand zone before multi-year lows come into play
Momentum & On-Chain Signals
The RSI readings across timeframes paint a coherent picture of weakness: the daily RSI sits at 35.84, dangerously close to oversold territory but not yet triggering a confirmed bounce signal, while the 4h RSI at 48.94 and 1h RSI at 49.13 reflect mild near-term stabilization without bullish conviction. The MACD on the daily remains deeply negative with the signal line still diverging bearishly, though the histogram bars are beginning to contract, hinting at a potential deceleration of selling momentum rather than a reversal. On the 4h chart, the MACD lines have made a tentative bullish cross near the zero line, which warrants monitoring but lacks confirmation from price action. OBV on both the 4h and daily frames continues to trend downward, reinforcing distribution rather than accumulation, and the funding rate at 0.0062% is mildly positive — suggesting longs have not been fully flushed, which could mean additional downside risk if price fails to hold current levels.
BTC Dominance & Market Sentiment
BTC dominance (BTC.D) is elevated at 55.86%, reflecting ongoing capital rotation away from altcoins and into Bitcoin, which is directly suppressing ETH’s ability to stage an independent recovery. USDT.D at 8.61% remains relatively elevated, indicating that a significant portion of market participants are still holding stablecoins on the sidelines rather than deploying into risk assets. For ETH specifically, a meaningful recovery would likely require BTC.D to begin declining from current levels, which has not yet materialized based on the available data.
Risk Scenarios
- Bullish case: A decisive 4h close above $1,616 reclaiming both the 1h EMA200 and 4h EMA50 on elevated volume, followed by a sustained hold above $1,650, would target a retest of $1,670–$1,700 in the near term.
- Bearish case: Failure to hold the $1,550–$1,560 support zone on a 4h close would expose ETH to a swift move toward $1,500 and potentially $1,450, particularly if BTC.D continues to rise and broader market risk appetite remains suppressed.
Outlook
The overall bias for ETH/USDT remains cautiously bearish as of June 30, 2026, with price trading beneath a stacked wall of EMA resistance on all timeframes and OBV confirming sustained distribution at the macro level. The mild consolidation on the 1h and 4h charts could represent a brief base-building phase or simply a pause before the next leg lower — the 4h MACD cross is the one tentative positive signal worth tracking over the next 24–48 hours. The key trigger to watch is whether ETH can reclaim and hold above $1,616 convincingly; failure to do so keeps the path of least resistance pointed downward toward $1,500. Until BTC dominance shows signs of rolling over and OBV trends stabilize, any recovery attempt should be treated as a potential relief bounce within a larger downtrend rather than a confirmed reversal.
Disclaimer: This analysis is for informational purposes only and does not constitute financial advice. Cryptocurrency markets are highly volatile and unpredictable. All trading decisions should be made based on your own research and risk tolerance. Block Digest is not responsible for any financial losses incurred as a result of acting on this content.
Stay Ahead of the Market
Follow BlockDigest for crypto market intelligence, research and real-time updates.


