
Author: BD Research Desk
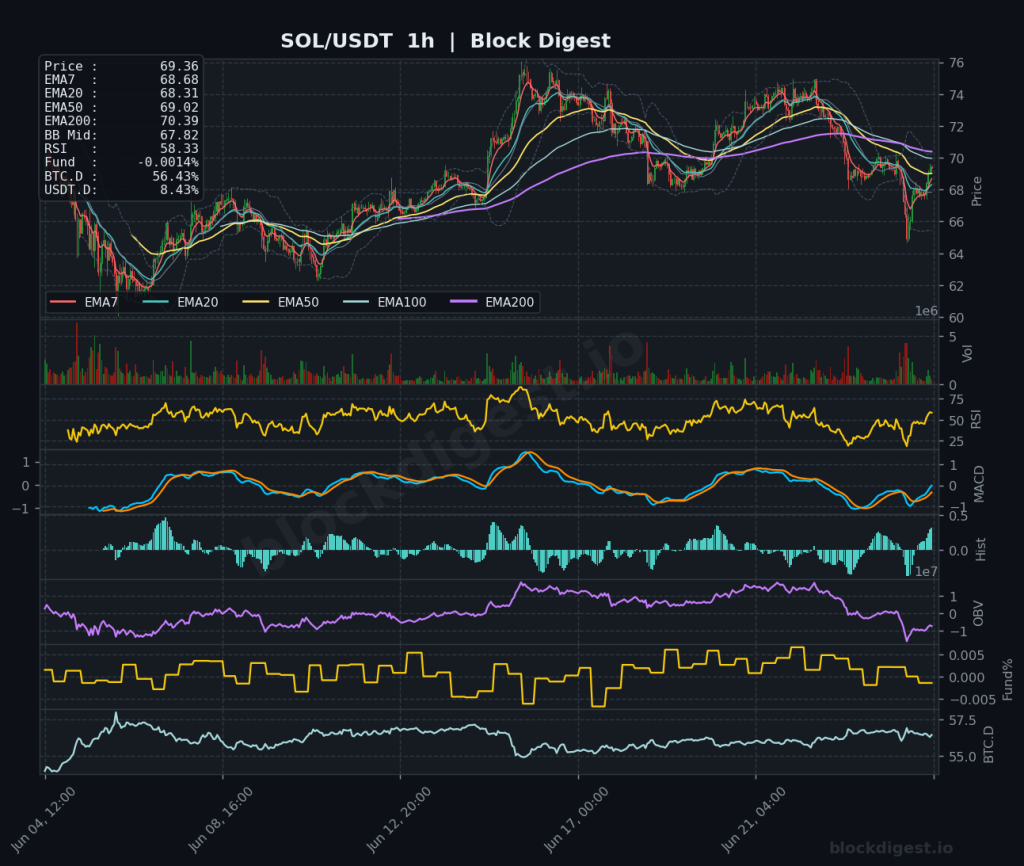
Altcoin Daily Analysis: BTC Dominance at 56.43% Suppresses Altcoin Capital
Market Context The broader altcoin market is operating under notable pressure as of June 25, 2026, with BTC dominance holding at 56.43% — a level that continues to suppress meaningful capital rotation into alts. USDT dominance at 8.43% indicates a defensive posture from market participants, with liquidity remaining on the sidelines rather than flowing aggressively...
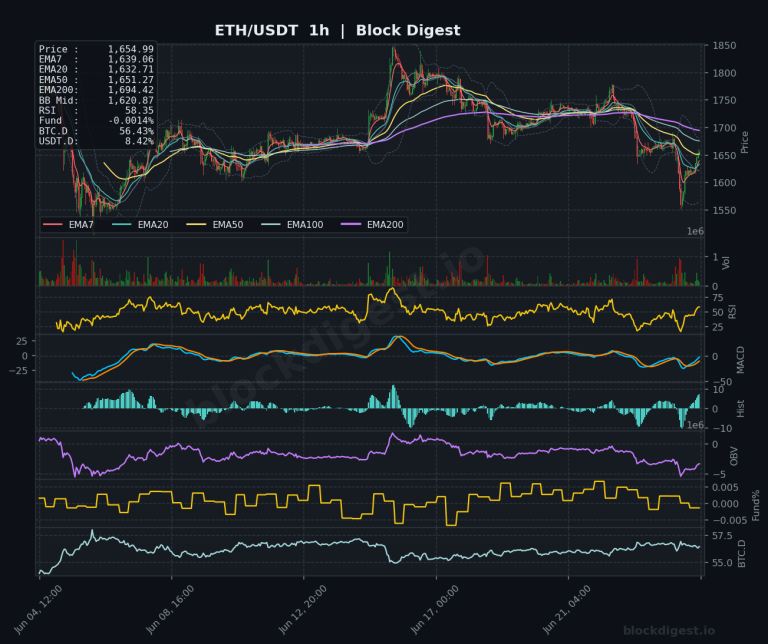
Ethereum Daily Analysis: ETH Below Key EMAs at $1,655 Amid Downtrend
Market Overview ETH/USDT is currently trading at $1,655.00, situated in a structurally weak position across all major timeframes. On the daily chart, price remains well below all key EMAs — the EMA7 at $1,679.75, EMA20 at $1,732.83, EMA50 at $1,880.66, and the distant EMA200 at $2,321.43 — confirming a sustained downtrend that has been in...
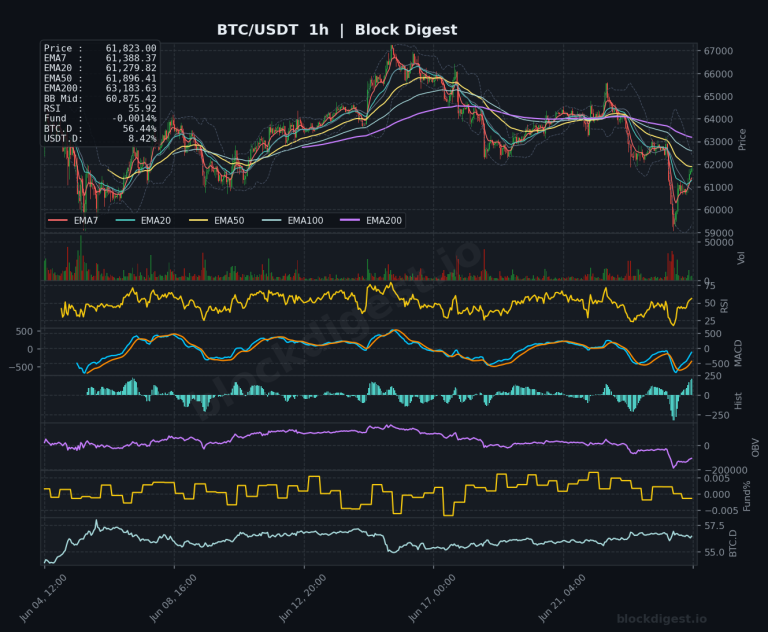
Bitcoin Daily Analysis: Price breaks below key EMAs amid bearish structure
Market Overview Bitcoin is currently trading at $61,823, sitting in a structurally weak position across all major timeframes. On the daily chart, price has broken decisively below all key EMAs — the EMA7 at $62,700, EMA20 at $64,412, EMA50 at $68,237, and the long-term EMA200 at $77,289 — confirming a sustained bearish trend structure. Price...
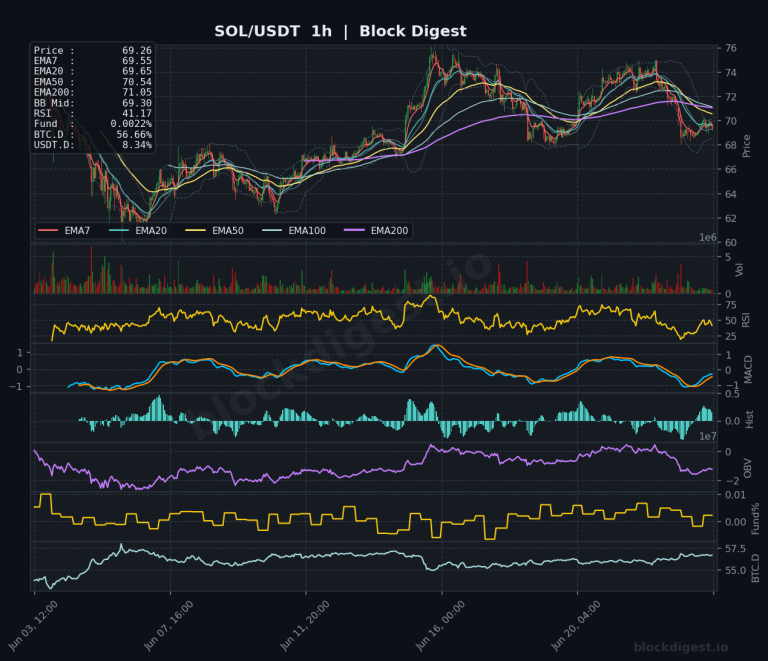
Altcoin Daily Analysis: Bitcoin dominance at 56.66% amid elevated stablecoin reserves
Market Context Bitcoin dominance sits at approximately 56.66–56.68% across the observed altcoin pairs, reflecting a persistent BTC-heavy market environment that continues to suppress altcoin outperformance on a relative basis. USDT dominance remains elevated at 8.34%, signaling that a meaningful portion of capital remains parked in stablecoins rather than rotating into risk assets. This combination points...
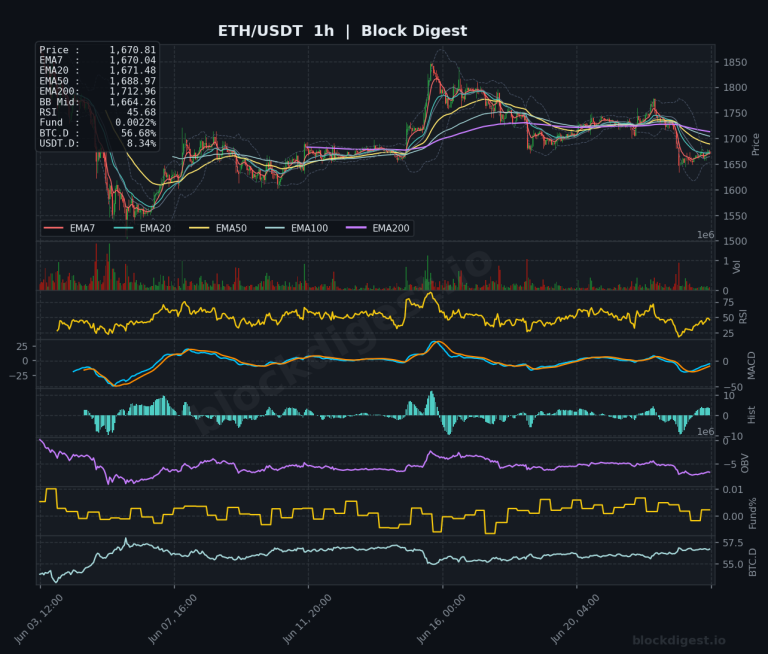
Ethereum Daily Analysis: ETH Below All Major EMAs, Bearish Pressure Continues
Market Overview ETH/USDT is currently trading at $1,671.28, sitting in a structurally weak position across all timeframes. On the daily chart, price is trading well below all major EMAs — the EMA7 at $1,700.43, EMA20 at $1,745.76, EMA50 at $1,891.82, and the EMA200 at $2,329.02 — confirming that the dominant trend remains firmly bearish. The...
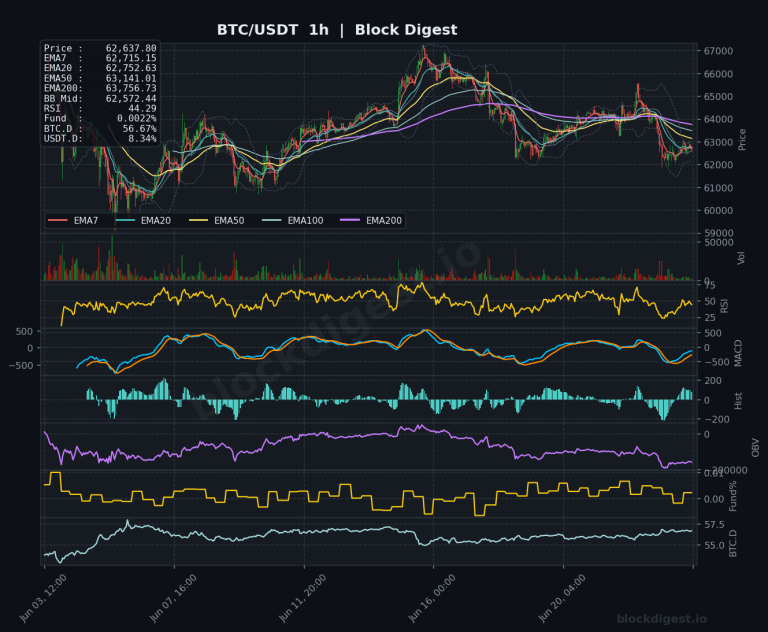
Bitcoin Daily Analysis: Bitcoin Below All EMAs, Bearish Structure Confirmed
Market Overview Bitcoin is currently trading at $62,637.80, positioned below all major EMAs on both the 4h and daily timeframes, painting a structurally bearish picture. On the daily chart, price sits beneath the EMA7 ($63,389), EMA20 ($64,836), EMA50 ($68,561), and the deeply overhead EMA200 ($77,472), confirming that the dominant trend remains firmly downward following the...
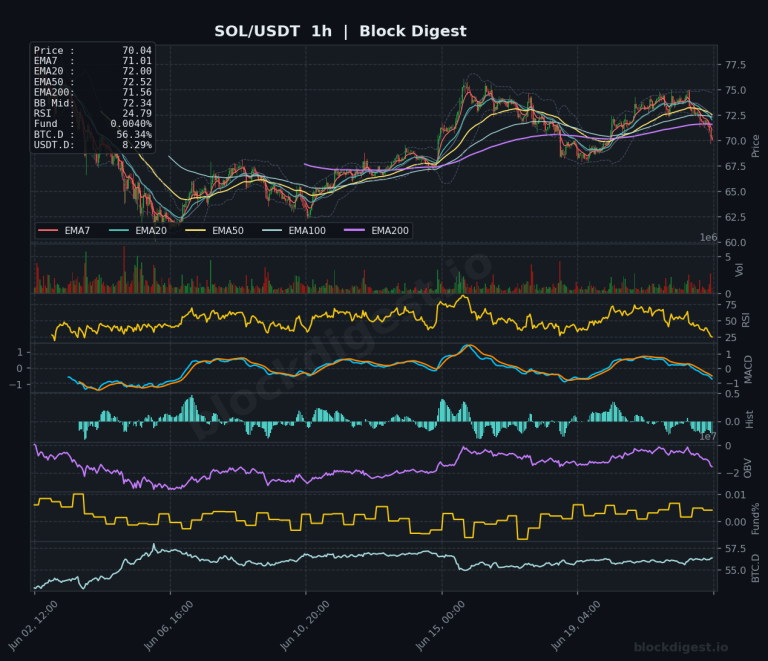
Altcoin Daily Analysis: BTC Dominance 56.34% Suppresses Altcoin Capital Rotation
Market Context The broader altcoin market is operating under meaningful pressure as of June 23, 2026, with BTC dominance holding at 56.34% — a level that continues to suppress sustained capital rotation into altcoins. USDT.D at 8.29% signals that a notable portion of sidelined capital remains in stablecoins, reflecting cautious risk appetite rather than outright...
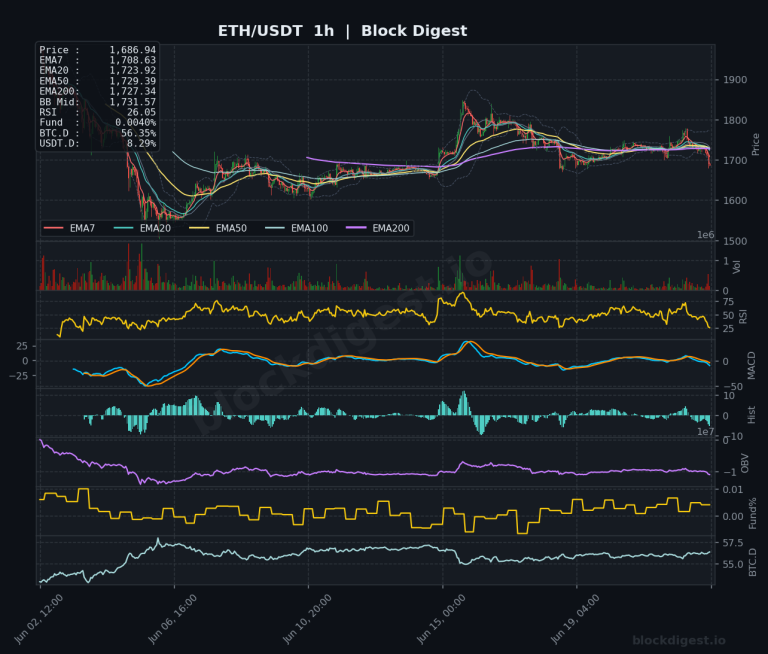
Ethereum Daily Analysis: ETH Below EMA200, Bollinger Band Resistance
Market Overview ETH/USDT is currently trading at $1,686.94, positioned beneath every key exponential moving average across all observed timeframes — a structurally bearish configuration. On the daily chart, price sits well below the EMA200 at $2,335.61, the EMA50 at $1,901.64, and the EMA20 at $1,755.58, confirming that the dominant trend remains firmly downward. The daily...
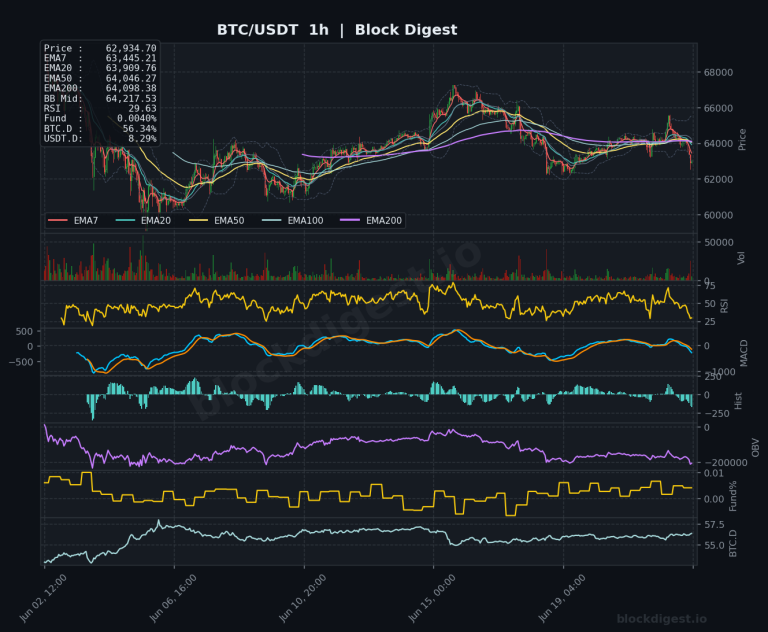
Bitcoin Daily Analysis: Bitcoin Below All EMAs at $62,934
Market Overview Bitcoin is currently trading at $62,934.70, sitting below all major EMAs across the daily timeframe — EMA7 ($63,699), EMA20 ($65,090), EMA50 ($68,812), and EMA200 ($77,617) — confirming a structurally bearish macro backdrop. Price has broken down significantly from the cycle highs and is now trading near the lower Bollinger Band on the daily...
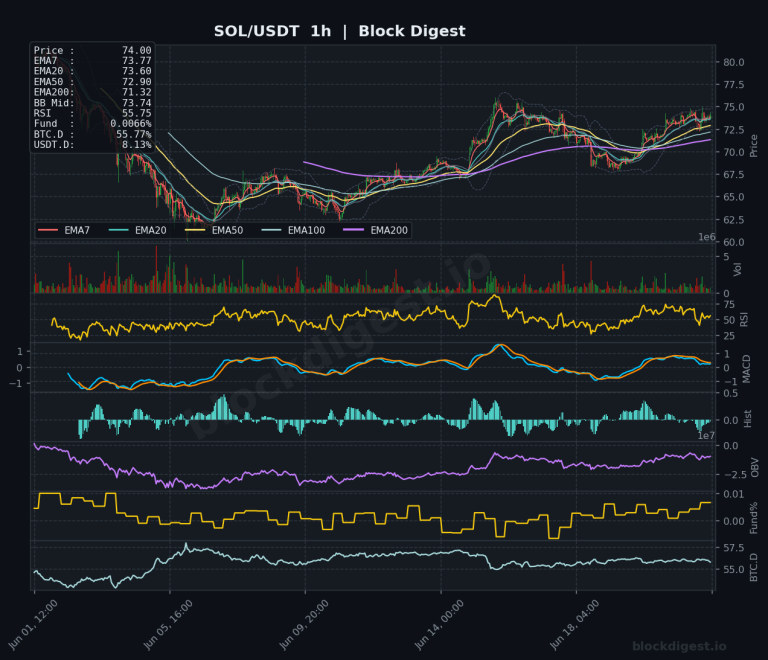
Altcoin Daily Analysis: Bitcoin Dominance 55.77% Keeps Altcoins Suppressed
Market Context Bitcoin dominance sits at 55.77% as of June 22, 2026, maintaining a persistent grip on overall crypto market capitalization that continues to suppress altcoin performance across the board. USDT dominance at 8.13% remains elevated, signaling that a meaningful portion of capital is still parked on the sidelines rather than deployed into risk assets....
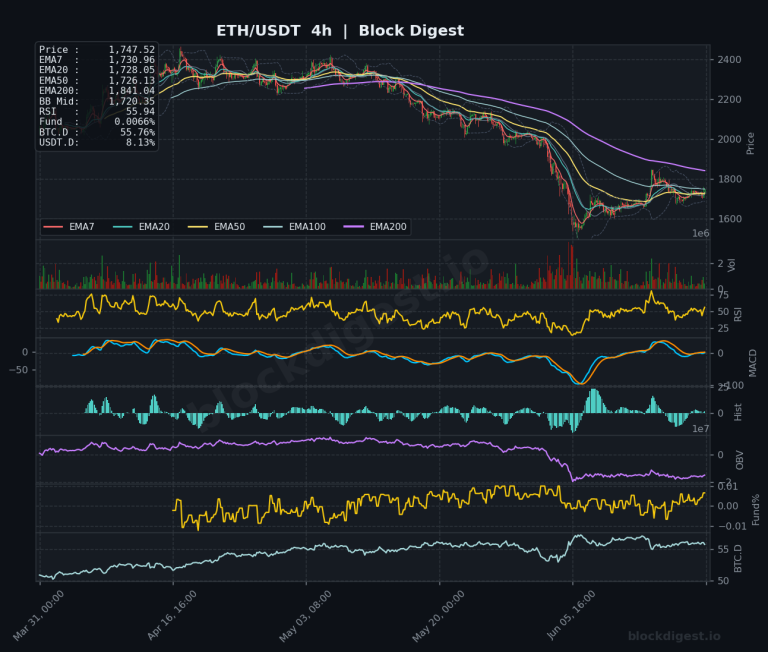
Ethereum Weekly Analysis: ETH Consolidates at $1,747 After Multi-Month Decline
Weekly Market Overview ETH/USDT enters the week of June 22, 2026 trading at approximately $1,747–$1,748, consolidating after a prolonged multi-month downtrend that saw price collapse from the $4,500 region into the mid-$1,500s. The current weekly candle structure suggests a tentative stabilization attempt, with price finding some footing above the recent capitulation lows near $1,540–$1,570. However,...
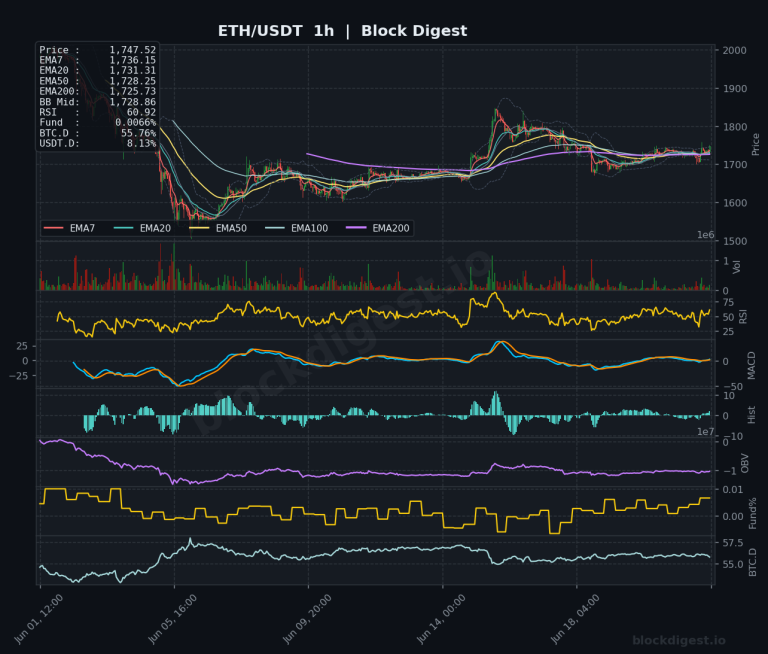
Ethereum Daily Analysis: ETH at $1,747 Reclaims Short-Term EMAs
Market Overview ETH/USDT is currently trading at $1,747.52, sitting in a structurally weak position on the daily timeframe despite a modest short-term recovery from recent lows. On the 1-hour chart, price has reclaimed all short-term EMAs — EMA7 ($1,736.15), EMA20 ($1,731.31), EMA50 ($1,728.25), and EMA200 ($1,725.73) — suggesting near-term bullish momentum has returned after a...