
Market Overview
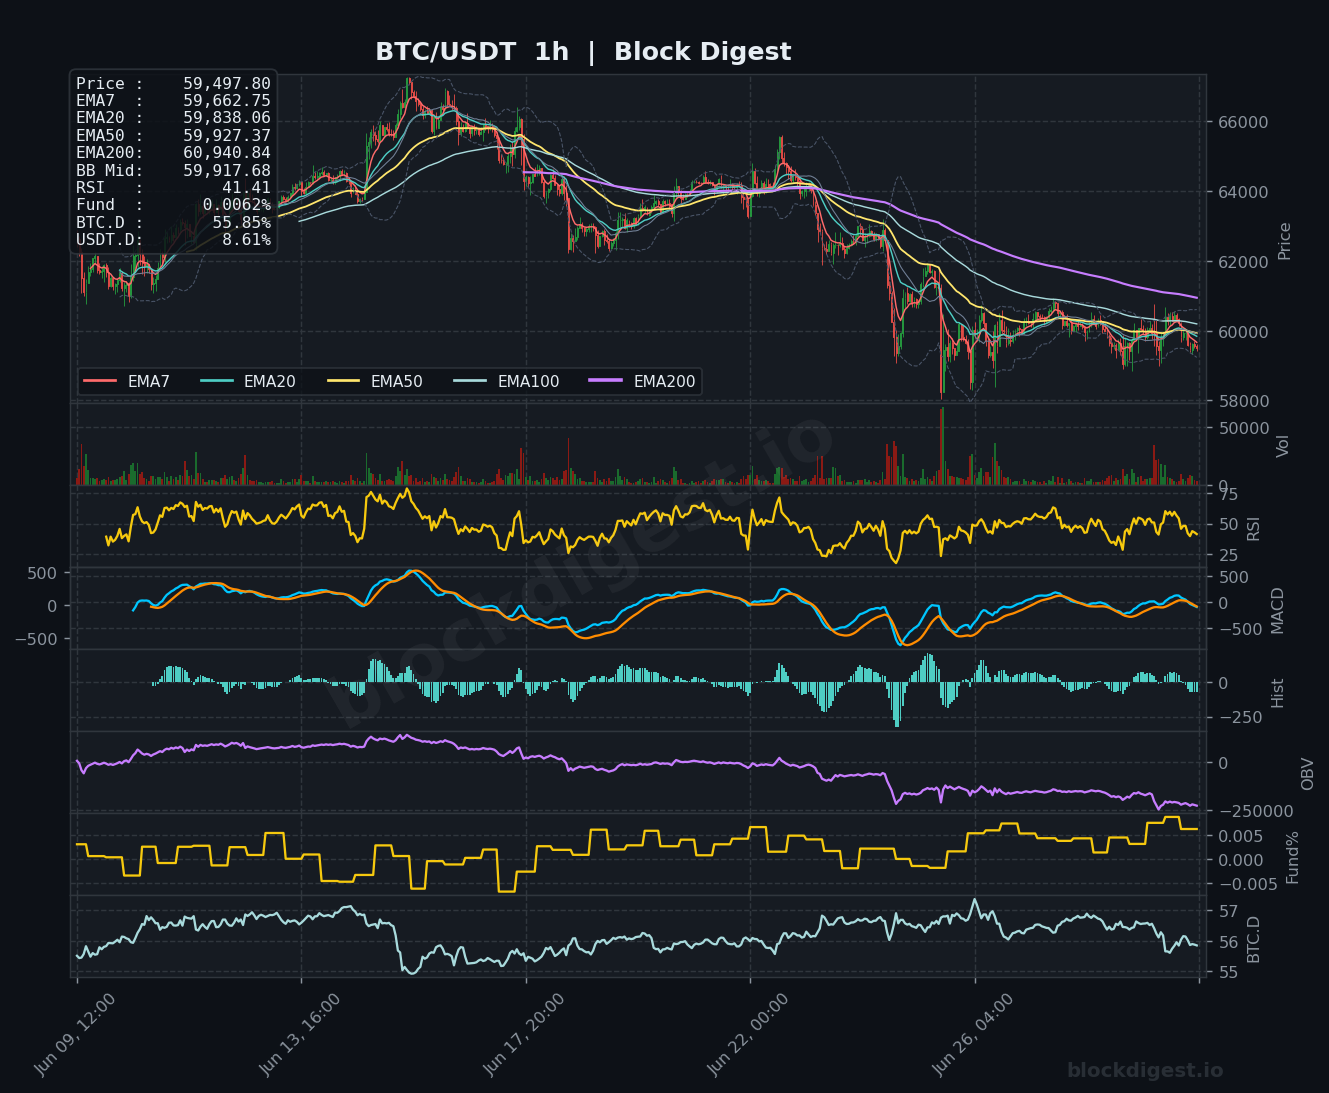
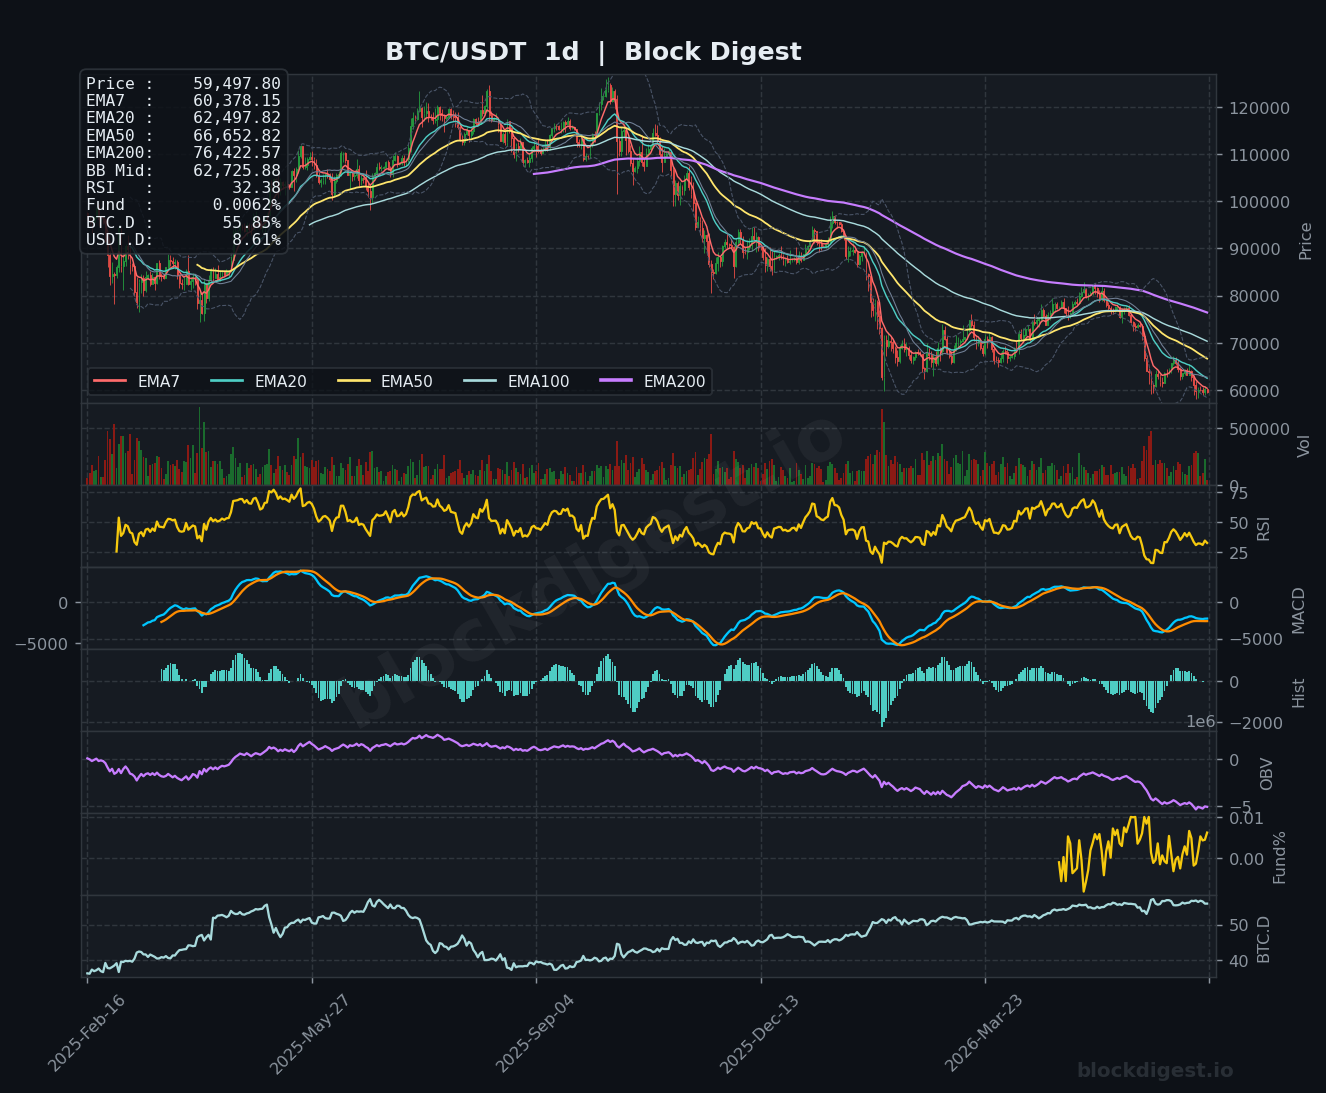
Bitcoin is currently trading at $59,497.80, firmly below all major exponential moving averages across every timeframe — a structurally bearish configuration. On the daily chart, price is well beneath the EMA7 ($60,378), EMA20 ($62,497), EMA50 ($66,652), and the distant EMA200 ($76,422), confirming a sustained downtrend from the highs set earlier in the cycle. The Bollinger Band midline on the daily sits at $62,725, and price is pressing against the lower band, reflecting persistent selling pressure with no meaningful mean-reversion attempt yet. The dominant daily trend remains decisively bearish, with each EMA layer acting as overhead resistance on any bounce attempt.
Multi-Timeframe Confluence
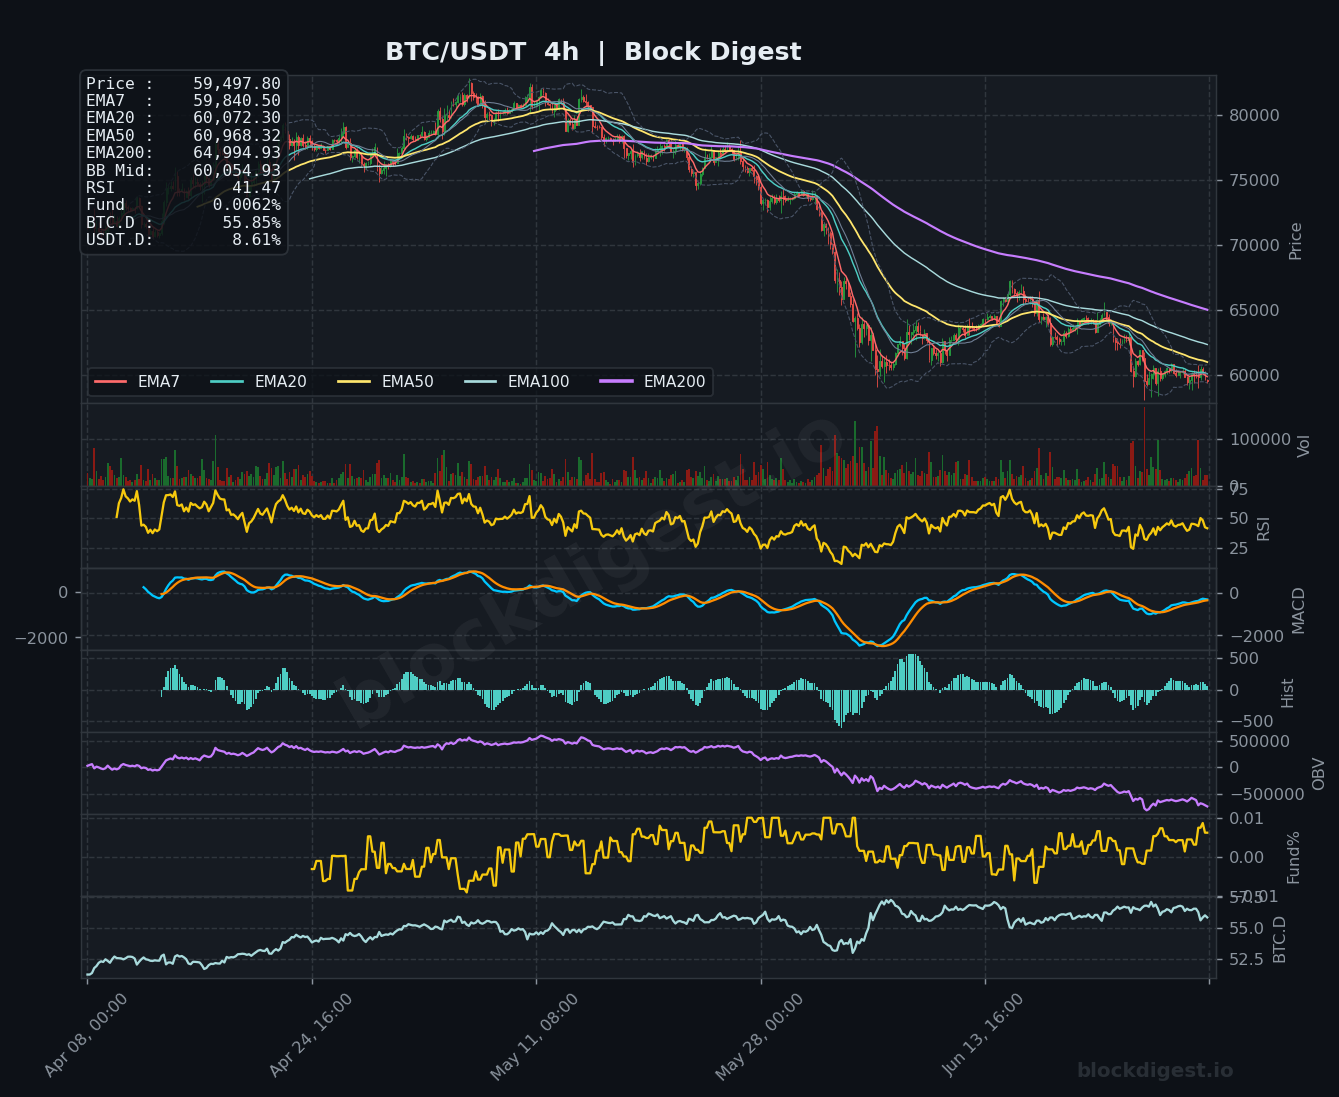
Across all three timeframes, the bearish EMA stack is fully aligned — short-term EMAs are below intermediate ones, which are below longer-term ones, leaving no timeframe showing constructive structure. On the 1-hour chart, price is trading below EMA7 ($59,662), EMA20 ($59,838), EMA50 ($59,927), and the critical EMA200 ($60,940), with the BB midline at $59,917 acting as immediate overhead resistance. The 4-hour chart reinforces this picture, with the EMA7 at $59,840, EMA20 at $60,072, and EMA50 at $60,968 all stacked bearishly above current price, while the daily timeframe provides the macro context of a market that has been in sustained distribution since cycle highs above $109,000. Short-term momentum on the 1-hour offers no meaningful divergence from the higher timeframe trend — the structure is uniformly bearish.
Key Levels to Watch
- Resistance: $60,072 — 4H EMA20, the nearest dynamic resistance level that has capped multiple intraday bounces
- Resistance: $60,940–$60,968 — confluence of the 1H EMA200 and 4H EMA50, a significant overhead supply zone where sellers are likely to re-engage
- Resistance: $62,497–$62,725 — daily EMA20 and BB midline cluster, representing the minimum recovery needed to suggest a trend shift is underway
- Support: $59,000 — psychological round number that has provided short-term floor; a clean break below invites accelerated selling
- Support: $58,000–$58,500 — prior consolidation zone visible on the 4H chart following the most recent leg lower, likely next demand area
- Support: $56,500–$57,000 — deeper structural support from earlier in the current cycle, representing a more significant demand cluster on the daily
Momentum & On-Chain Signals
The daily RSI at 32.38 is approaching oversold territory but has not yet printed a definitive bottom signal, and historically BTC can remain compressed in the 30–35 RSI zone during protracted downtrends. The 4-hour RSI at 41.47 and the 1-hour RSI at 41.41 are both in bearish territory without any clear bullish divergence forming. The MACD on the 4-hour chart shows the signal and MACD lines converging near zero from below, with the histogram shrinking — a potential early sign of momentum exhaustion rather than reversal. OBV across both the 1-hour and 4-hour timeframes remains in a clear downtrend, confirming ongoing distribution without evidence of meaningful accumulation at current levels.
BTC Dominance & Market Sentiment
BTC dominance currently reads 55.85%, a notably elevated level that reflects a flight to relative safety within crypto — altcoins are bearing a disproportionate share of the broader market selloff. USDT dominance at 8.61% signals that a meaningful portion of capital has rotated into stablecoins, reflecting risk-off sentiment and suggesting sidelined liquidity rather than active buying interest. For BTC specifically, sustained elevated BTC.D does not necessarily precede an immediate recovery — it more likely indicates that altcoin exposure is being reduced before broader de-risking resumes.
Risk Scenarios
- Bullish case: A reclaim of $60,940 on a 4-hour closing basis, accompanied by increasing OBV and an RSI cross above 50, would suggest a short-term recovery toward the $62,500–$63,000 resistance cluster and potentially a retest of the daily BB midline.
- Bearish case: A confirmed daily close below $59,000 with sustained selling volume would validate further downside continuation, opening a measured move toward the $56,500–$57,000 structural support zone and increasing the probability of a broader capitulation event.
Outlook
The overall bias heading into June 30, 2026 is cautiously bearish, with BTC trading beneath every key EMA on the daily, 4-hour, and 1-hour charts and OBV confirming distribution. The key trigger to watch over the next 24–48 hours is whether price can sustain a hold above the $59,000 psychological level or whether selling pressure escalates toward a decisive breakdown. A reclaim of $60,940 — the 1H EMA200 and 4H EMA50 confluence — would be the minimum requirement to begin considering any bullish thesis with conviction. Until that threshold is reclaimed on a closing basis, the path of least resistance remains to the downside, and any bounce should be treated as a potential shorting opportunity within the prevailing trend.
Disclaimer: This analysis is for informational purposes only and does not constitute financial advice. Cryptocurrency markets are highly volatile and unpredictable. All trading decisions should be made based on your own research and risk tolerance. Block Digest is not responsible for any financial losses incurred as a result of acting on this content.
Stay Ahead of the Market
Follow BlockDigest for crypto market intelligence, research and real-time updates.


