
market analysis
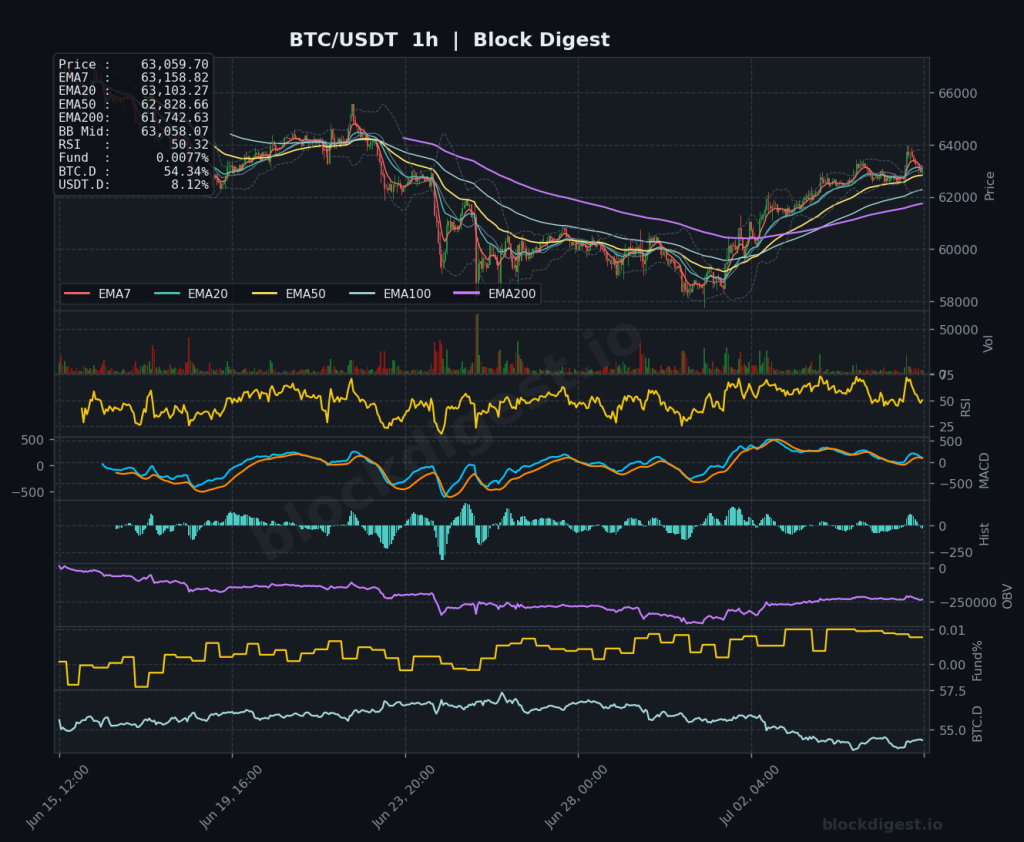
Bitcoin Daily Analysis: Bitcoin at $63K Between Key Moving Averages
Market Overview Bitcoin is currently trading at $63,059.70, sitting just above the Bollinger Band midline on the daily chart ($61,916.33) while remaining well beneath the descending EMA50 ($65,715.33) and far below the EMA200 ($75,596.59). The dominant daily trend remains bearish, with price having declined from all-time highs and all major EMAs stacked in a bearish...
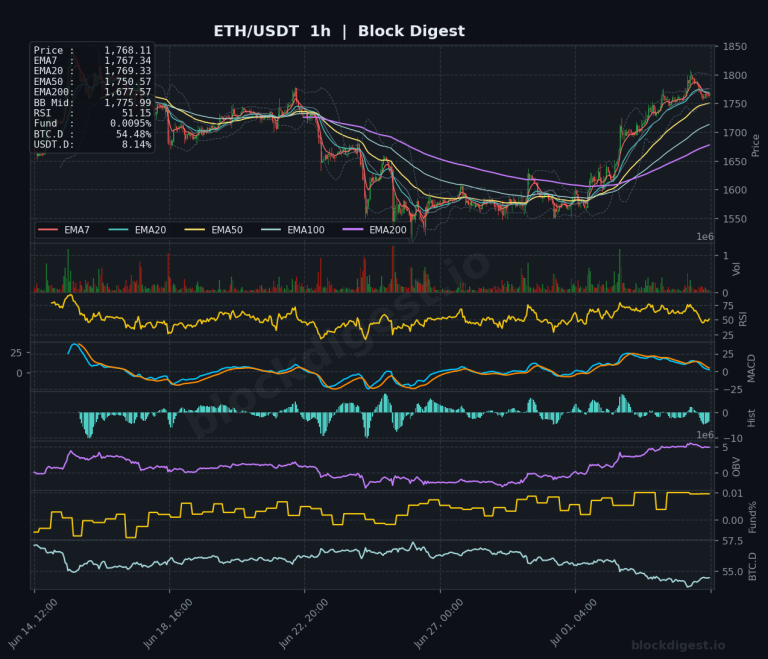
Ethereum Daily Analysis: ETH consolidates at $1,767 above EMA7 support
Market Overview ETH/USDT is currently trading at approximately $1,767–$1,768, consolidating near the upper end of its recent recovery range after a significant June selloff that saw prices bottom near the $1,540–$1,560 zone. On the daily timeframe, price has reclaimed both the EMA7 ($1,709) and EMA20 ($1,692) from below, signaling improving short-term structure, but remains firmly...
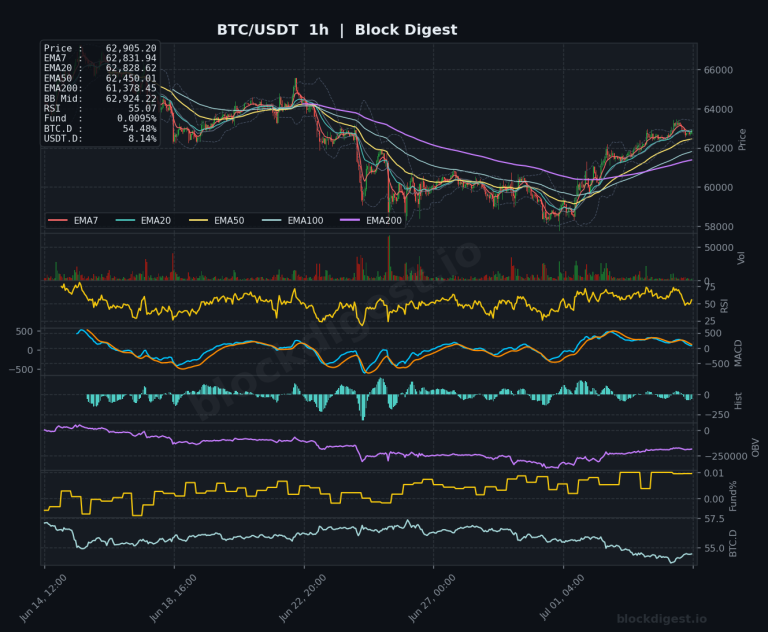
Bitcoin Daily Analysis: Consolidation at $62.9K Below EMA50 Critical Level
Market Overview Bitcoin is trading at approximately $62,902–$62,905 as of July 5, 2026, consolidating near a critical inflection point following a significant bear market drawdown from the $126,000 all-time high reached in October 2025. On the daily timeframe, price remains firmly below the EMA50 ($65,795) and EMA200 ($75,712), confirming that the macro trend structure is...
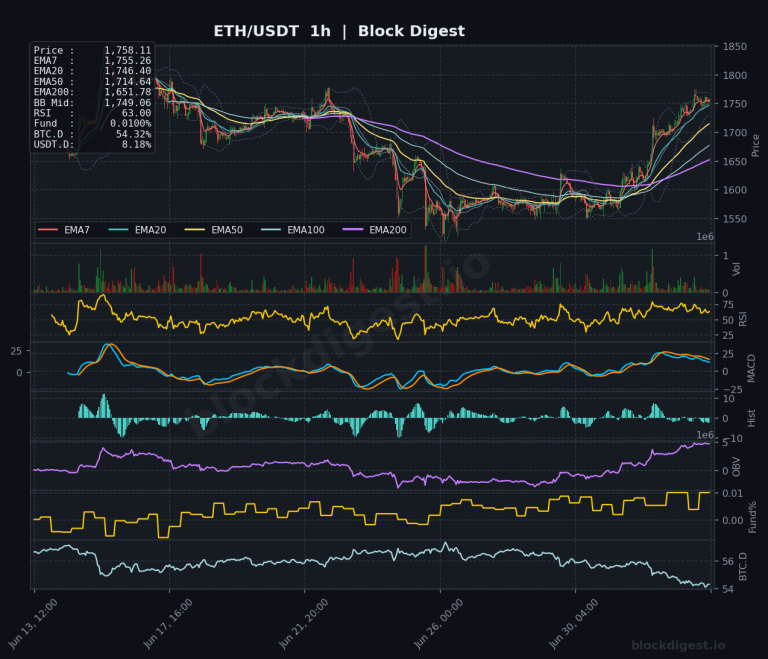
Ethereum Daily Analysis: Ethereum bounces to $1,758 above EMA7 resistance
Market Overview Ethereum is trading at $1,758.30 as of July 4, 2026, posting a notable recovery after weeks of sustained selling pressure that pushed price into the mid-$1,500s. On the daily timeframe, ETH remains structurally bearish over the longer term — trading well below the EMA200 ($2,262.70) and EMA50 ($1,806.57) — but the recent bounce...
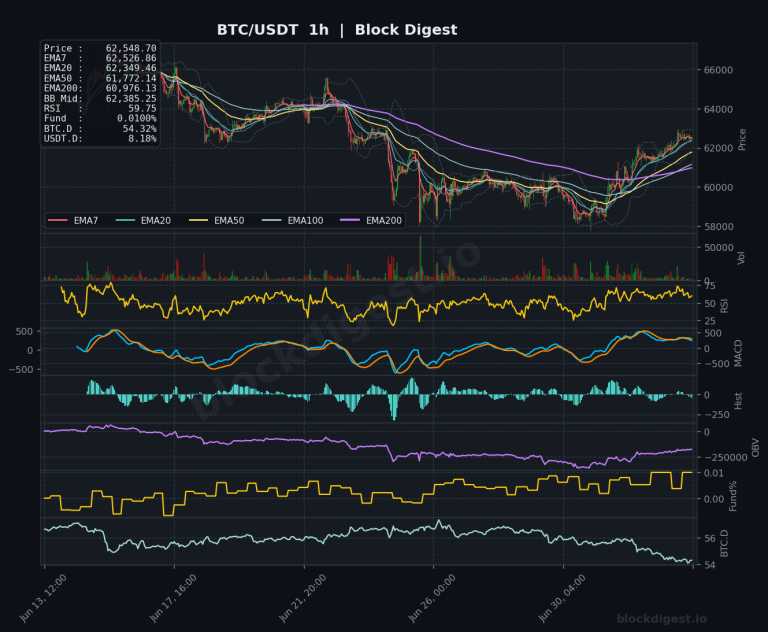
Bitcoin Daily Analysis: Bitcoin at $62.5K Tests EMA20 Resistance
Market Overview Bitcoin is trading at approximately $62,548–$62,677 as of July 4, 2026, having staged a meaningful recovery from multi-month lows near $58,000 seen in late June. On the daily timeframe, price remains in a well-defined downtrend, trading well below the EMA50 ($65,892), EMA200 ($75,850), and the descending EMA100, reflecting sustained macro bearish structure. However,...
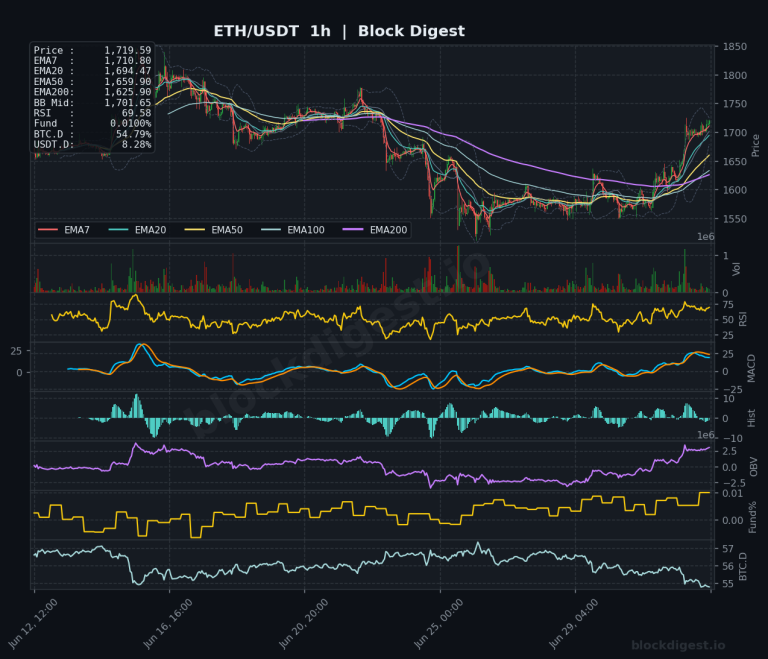
Ethereum Daily Analysis: Ethereum breaks above key EMAs with 5.38% gain
Market Overview Ethereum is trading at $1,719.60, posting a sharp 5.38% single-day gain that has pushed price decisively above the 1-hour and 4-hour short-term EMAs in a broad short-squeeze rally. On the 1-hour chart, ETH has reclaimed all key intraday EMAs — with price sitting above the EMA7 ($1,710.80), EMA20 ($1,694.47), EMA50 ($1,659.90), and EMA200...
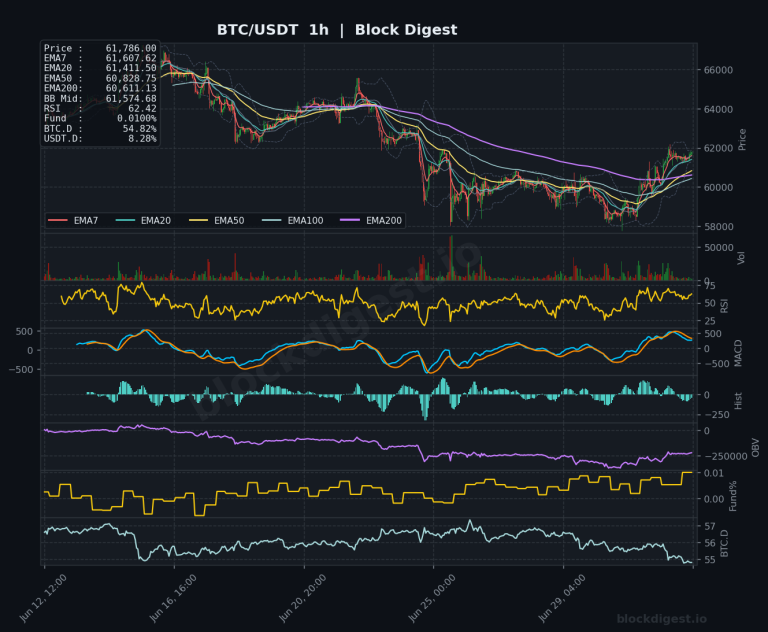
Bitcoin Daily Analysis: Bitcoin at $61.7K Below Key EMAs
Market Overview Bitcoin is trading at approximately $61,776–$61,786 as of July 3, 2026, having recovered meaningfully off recent lows near $58,000 but remaining well below its all-time high of $126,080. On the daily timeframe, the dominant structure is bearish: price sits below the EMA20 ($62,088), EMA50 ($65,997), and the steeply declining EMA200 ($75,965), confirming a...
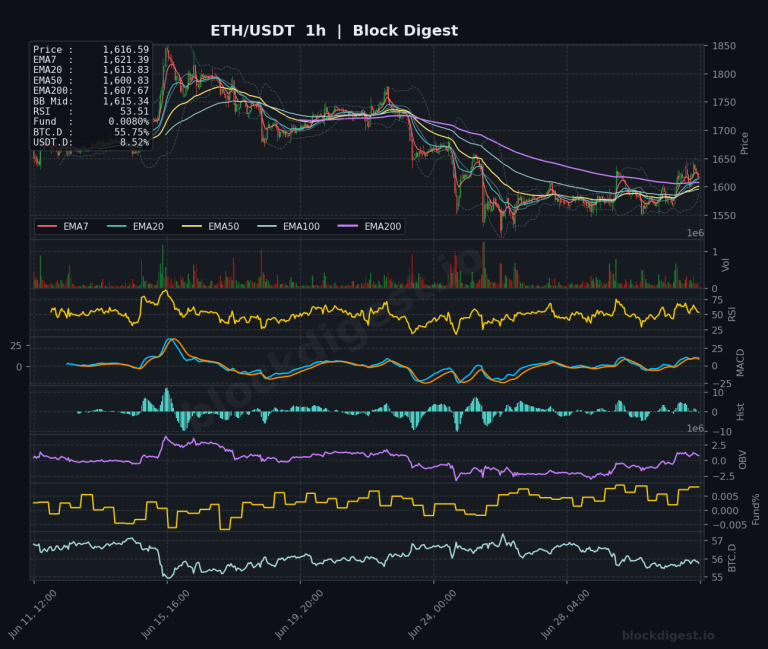
Ethereum Daily Analysis: Ethereum Below Key EMAs Amid Multi-Month Downtrend
Market Overview Ethereum is trading at $1,616.76 as of July 2, 2026, attempting a modest recovery after a prolonged multi-month downtrend that has seen price fall from highs above $4,000 on the daily chart. Price currently sits well below the daily EMA200 ($2,271.62), EMA50 ($1,807.37), and EMA20 ($1,658.20), confirming the dominant macro trend remains firmly...
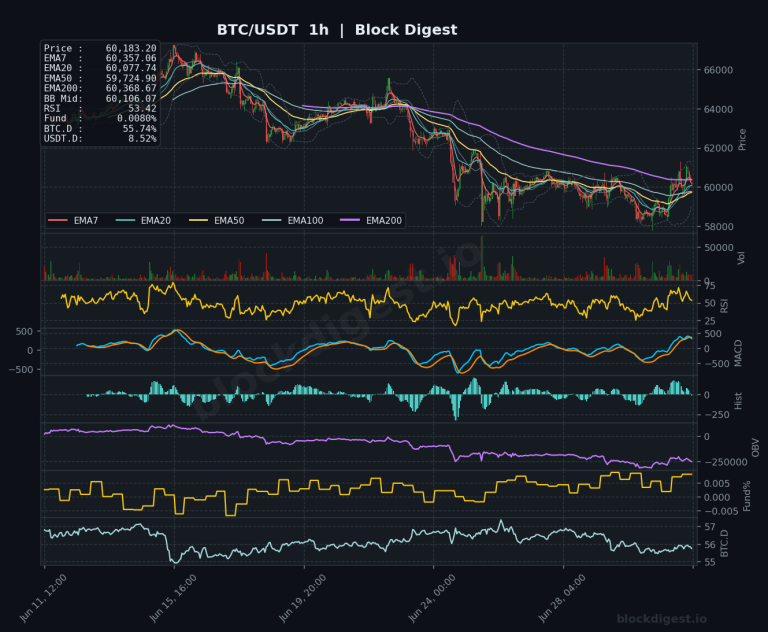
Bitcoin Daily Analysis: Bitcoin at $60K Below All Major EMAs
Market Overview Bitcoin is trading at approximately $60,185 as of July 2, 2026, navigating a structurally damaged macro environment following a decline of more than 50% from its October 2025 peak near $126,000. On the daily timeframe, price is currently sitting well below all major EMAs — the EMA20 at $61,992, EMA50 at $66,116, EMA200...
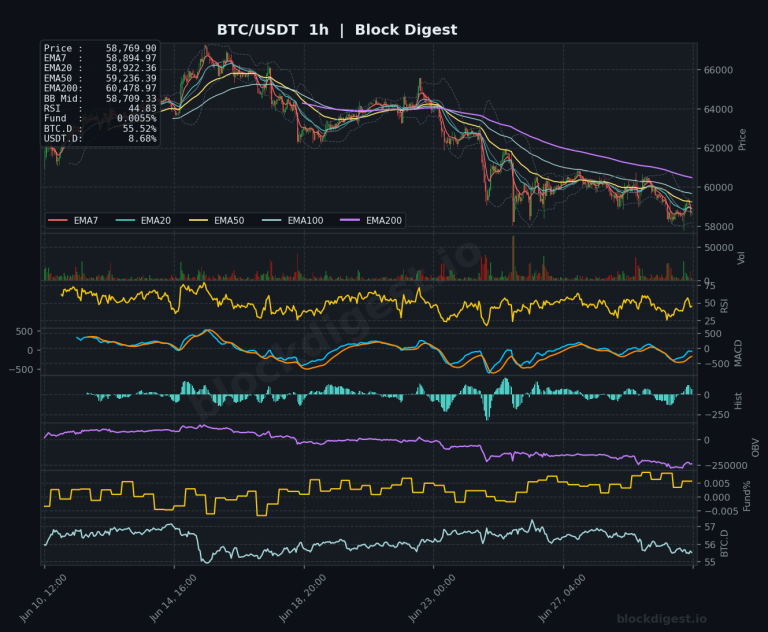
Bitcoin Daily Analysis: BTC Below All EMAs at $58,774 Resistance
Market Overview BTC/USDT is currently trading at $58,774–$58,778, sitting below all major EMAs across every timeframe — a structurally bearish configuration. On the daily chart, price has failed to reclaim the EMA7 ($59,809) and trades well beneath the EMA20 ($62,066), EMA50 ($66,310), and EMA200 ($76,236), confirming a sustained downtrend from the cycle highs. The Bollinger...

Here’s What Happened in Crypto Today
Bitcoin’s grip on the $60,000 support level weakened today as macroeconomic headwinds intensified, with PCE inflation data triggering a sharp selloff that pushed the leading cryptocurrency below $58,000. Meanwhile, Ethereum faced internal challenges as the Ethereum Foundation announced significant workforce reductions, though the network itself continued to outperform Bitcoin on the day. On a brighter...
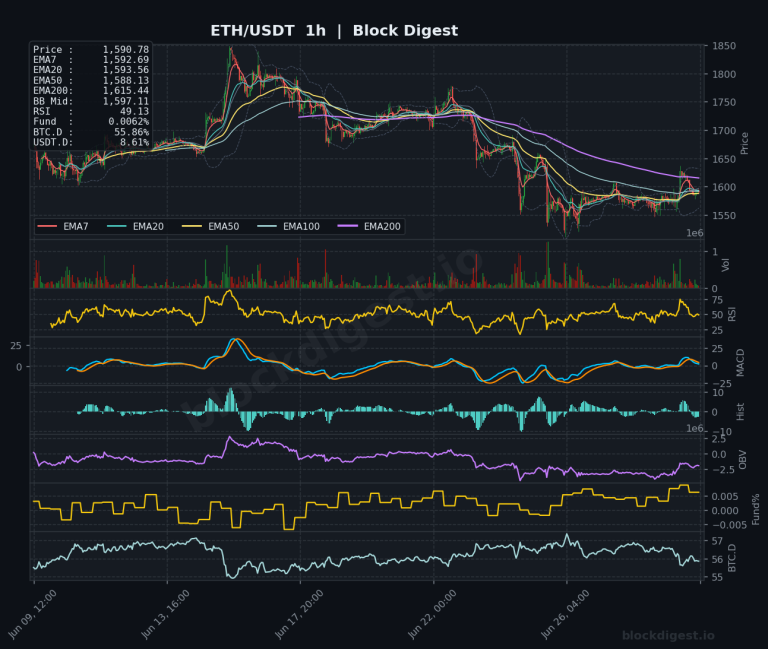
Ethereum Daily Analysis: ETH drops below key EMAs amid prolonged downtrend
Market Overview ETH/USDT is currently trading at $1,590.78, caught in a pronounced downtrend that has persisted across multiple timeframes. On the daily chart, price sits well below all major EMAs — the EMA7 at $1,605.04, EMA20 at $1,670.06, EMA50 at $1,824.33, and EMA200 at $2,285.05 — confirming a deeply bearish macro structure. The Bollinger Band...