
Market Overview
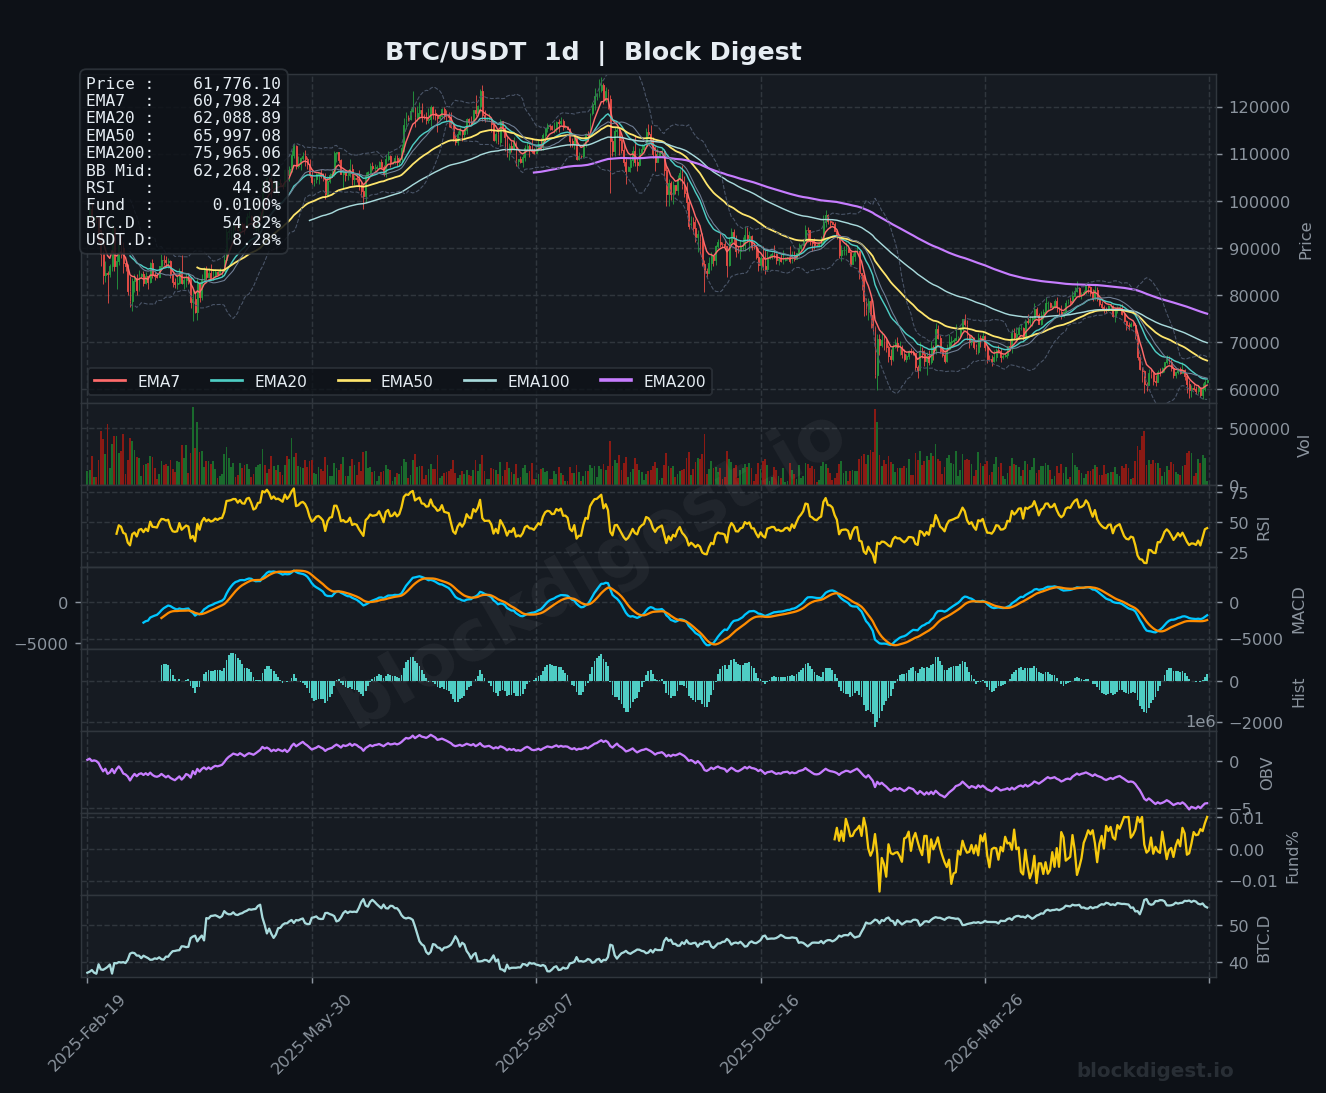
Bitcoin is trading at approximately $61,776–$61,786 as of July 3, 2026, having recovered meaningfully off recent lows near $58,000 but remaining well below its all-time high of $126,080. On the daily timeframe, the dominant structure is bearish: price sits below the EMA20 ($62,088), EMA50 ($65,997), and the steeply declining EMA200 ($75,965), confirming a prolonged downtrend from peak levels. The Bollinger Band midline on the daily sits at $62,268, and price is currently pressing against that level from below — a technically significant test. The recent bounce above $60,000, catalyzed by weaker-than-expected U.S. jobs data and renewed hopes that the Federal Reserve will pause rate hikes, has injected short-term momentum, but has not yet changed the macro trend structure.
Multi-Timeframe Confluence
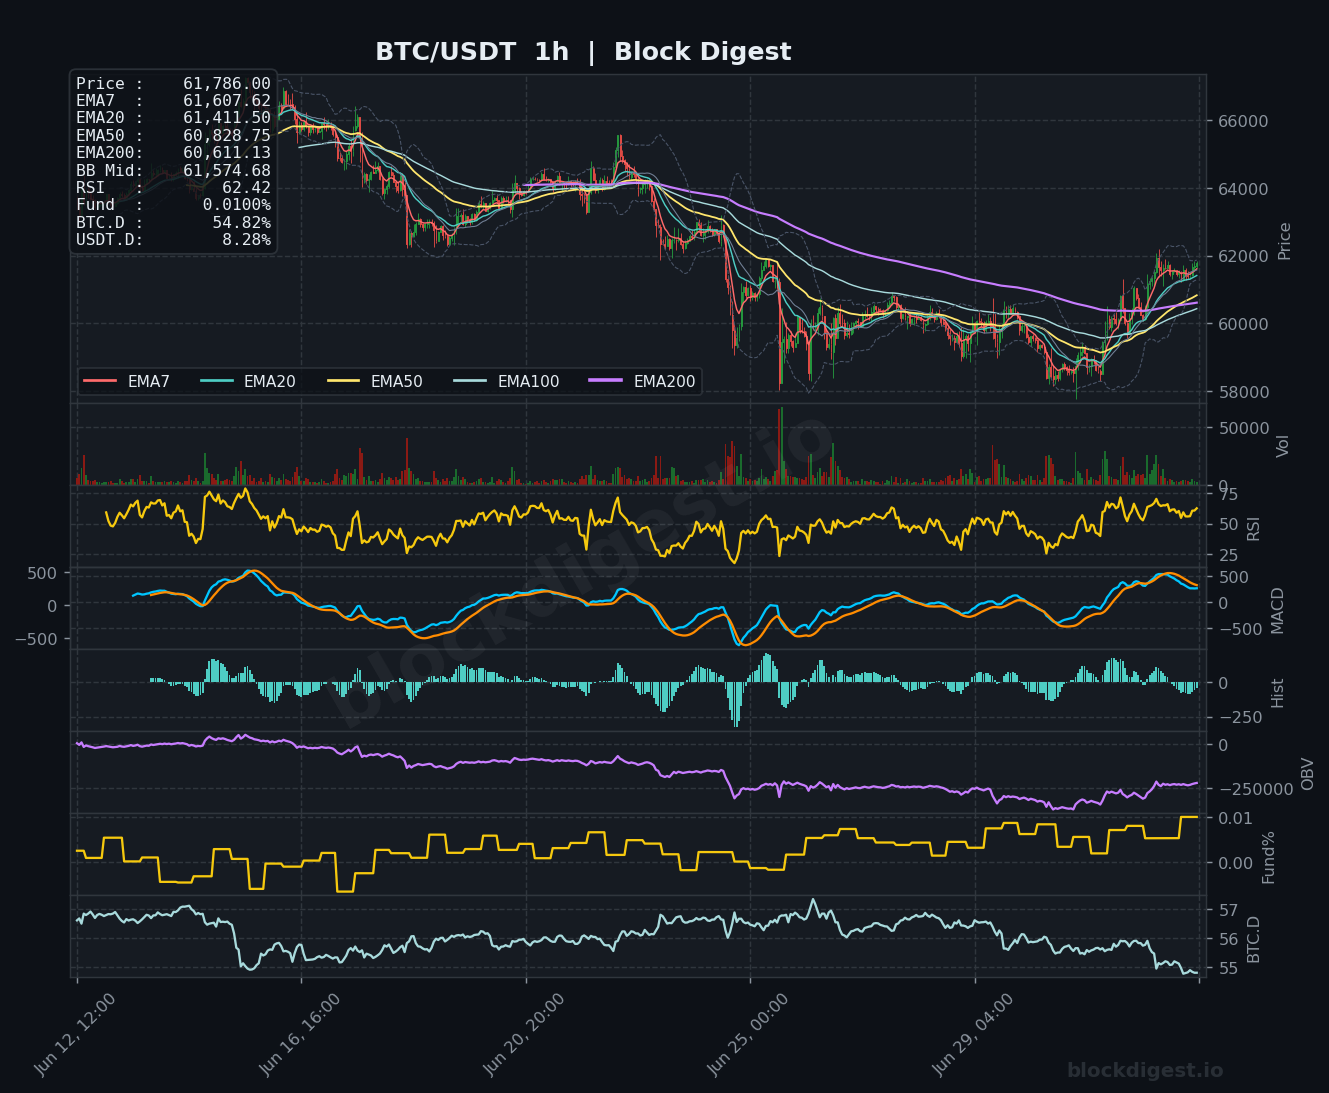
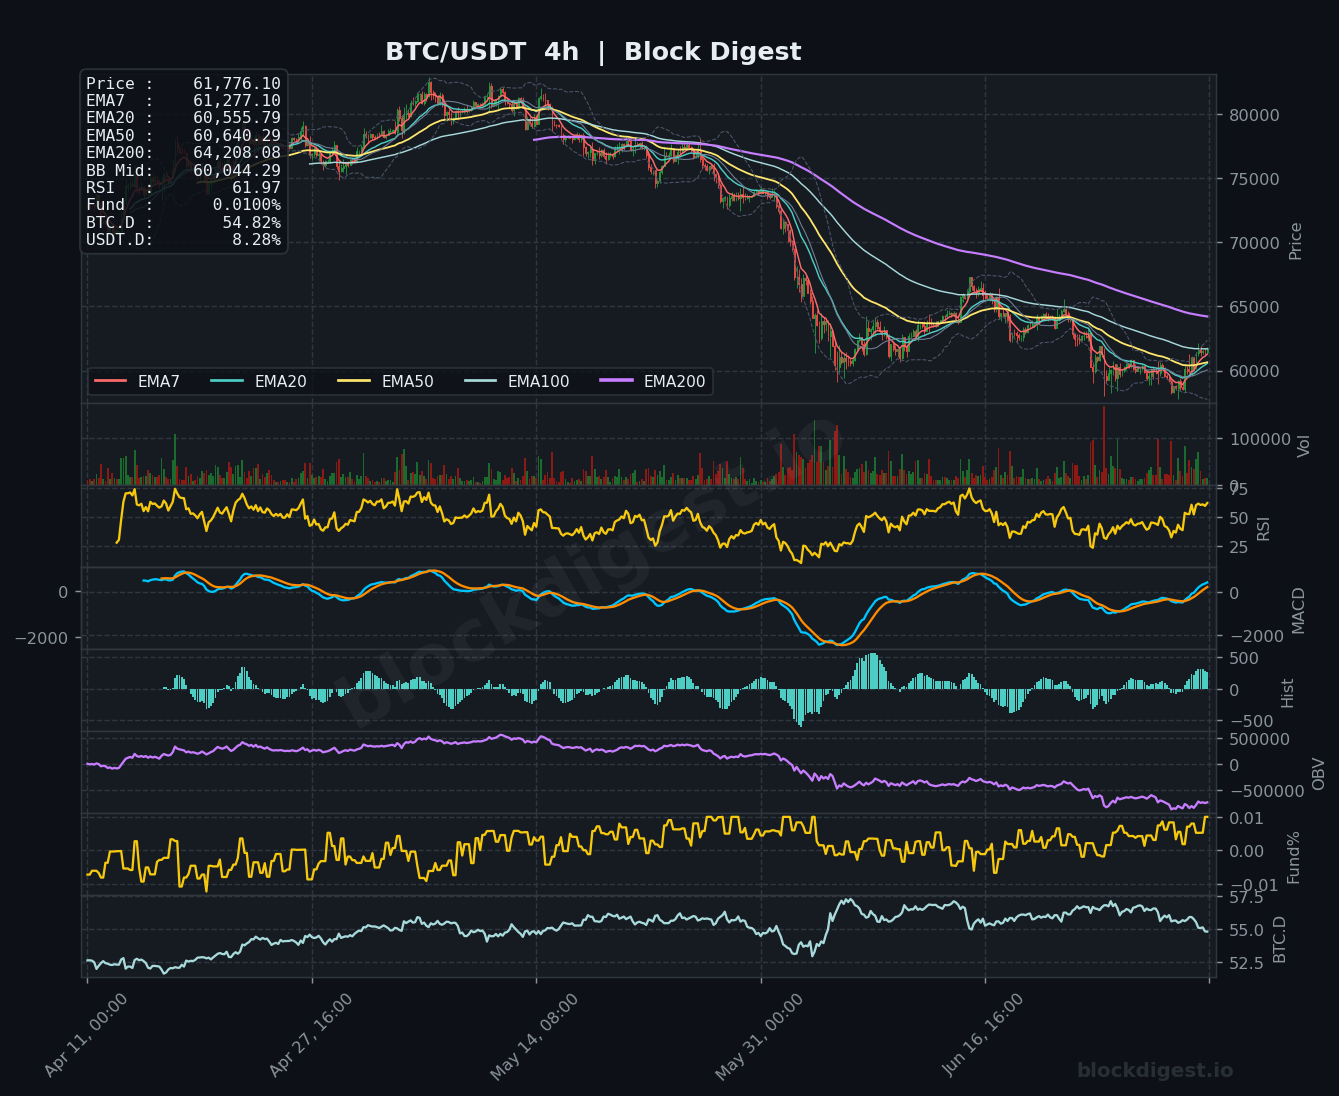
On the 1-hour chart, BTC has reclaimed all short-term EMAs (EMA7: $61,607, EMA20: $61,411, EMA50: $60,828, EMA200: $60,611), and price is trading above the Bollinger Band midline at $61,574 — a constructive near-term setup. The 4-hour chart tells a similar story: EMA7 ($61,277) and EMA20 ($60,555) have curled upward with price above both, though EMA50 ($60,640) and EMA200 ($64,208) remain overhead as meaningful resistance layers. The daily timeframe, however, remains in a bearish EMA stack, meaning the short-term recovery is swimming against the higher timeframe current. Confluence of resistance sits between $62,000 and $62,300, where the daily BB midline and daily EMA20 converge — this zone must be cleared convincingly for the short-term momentum to gain credibility.
Key Levels to Watch
- Resistance: $62,088–$62,268 — Confluence of the daily EMA20 and Bollinger Band midline; failure to close above here on the daily would reinforce the bearish trend
- Resistance: $64,208 — The 4-hour EMA200, which has been sloping down aggressively and represents the next major structural hurdle for any sustained recovery
- Resistance: $65,997 — Daily EMA50, a key macro resistance that marked prior rejection zones during the broader downtrend
- Support: $60,555–$60,828 — Cluster of the 4-hour EMA20 and 1-hour EMA50; reclaimed during the recent recovery and now acting as first-line support
- Support: $59,000–$58,500 — Recent swing low region where price found buyers; a retest of this zone would be critical for maintaining the recovery thesis
- Support: $57,000 — Structural support from prior consolidation lows; a break below would signal significant deterioration and potential continuation lower
Momentum & On-Chain Signals
The 1-hour RSI at 62.42 and 4-hour RSI at 61.97 are both in bullish territory, showing healthy momentum without yet reaching overbought levels — leaving room for further short-term upside. The daily RSI at 44.81 remains below the neutral 50 line, reflecting that the macro trend is still net bearish and the current bounce has not yet shifted the broader momentum picture. On the MACD front, the 1-hour and 4-hour both show positive histogram bars and MACD lines curling upward, indicating building bullish momentum in the short-to-medium term; however, the daily MACD remains in negative territory with a bearish signal line crossover still in effect. OBV on both the 4-hour and daily charts continues to trend downward, suggesting ongoing distribution pressure that has not yet been reversed despite the recent price bounce — a notable bearish divergence worth monitoring. The funding rate at a modest 0.0100% across timeframes indicates the derivatives market is not overly leveraged long, reducing the risk of a sudden flush, but also suggesting limited conviction from futures participants.
BTC Dominance & Market Sentiment
BTC dominance stands at 54.82%, a level that reflects Bitcoin’s relative strength compared to altcoins during this corrective period, though the 1-hour chart shows BTC.D has been gradually sliding lower in recent sessions — a signal that some capital may be rotating cautiously into altcoins as risk appetite tentatively returns. USDT dominance at 8.28% remains elevated historically, indicating that a meaningful portion of crypto market capital is still parked in stablecoins, reflecting broader caution and lack of conviction among market participants. Until USDT.D shows a decisive decline alongside BTC.D stabilization, the broader market risk appetite remains restrained.
Risk Scenarios
- Bullish case: A daily close above $62,268 (BB midline and EMA20 confluence) on strong volume would represent a meaningful structural shift, opening a path toward the 4-hour EMA200 near $64,208 and potentially the daily EMA50 at $65,997 in the near-to-medium term.
- Bearish case: Failure to hold above $60,555 on the 4-hour EMA20 and a rejection at the $62,088–$62,268 resistance band would likely trigger a retest of the $58,500–$59,000 support zone, with a break below $57,000 pointing to deeper structural weakness.
Outlook
The near-term bias is cautiously bullish, supported by macro-fundamental tailwinds from weaker U.S. labor data and technically constructive short-term EMA alignment on the 1-hour and 4-hour charts. However, the daily structure remains bearish, and the OBV’s continued downtrend is a meaningful warning against aggressive positioning. The critical trigger to watch in the next 24–48 hours is whether BTC can achieve and sustain a daily close above $62,088–$62,268; success would validate the recovery narrative, while rejection would likely see price fade back toward the $59,000 region. Until the daily EMA stack begins to flatten and OBV confirms accumulation, this is best characterized as a bear market bounce in need of further evidence before the trend bias can shift to bullish with conviction.
Disclaimer: This analysis is for informational purposes only and does not constitute financial advice. Cryptocurrency markets are highly volatile and unpredictable. All trading decisions should be made based on your own research and risk tolerance. Block Digest is not responsible for any financial losses incurred as a result of acting on this content.
Stay Ahead of the Market
Follow BlockDigest for crypto market intelligence, research and real-time updates.


