
Market Overview
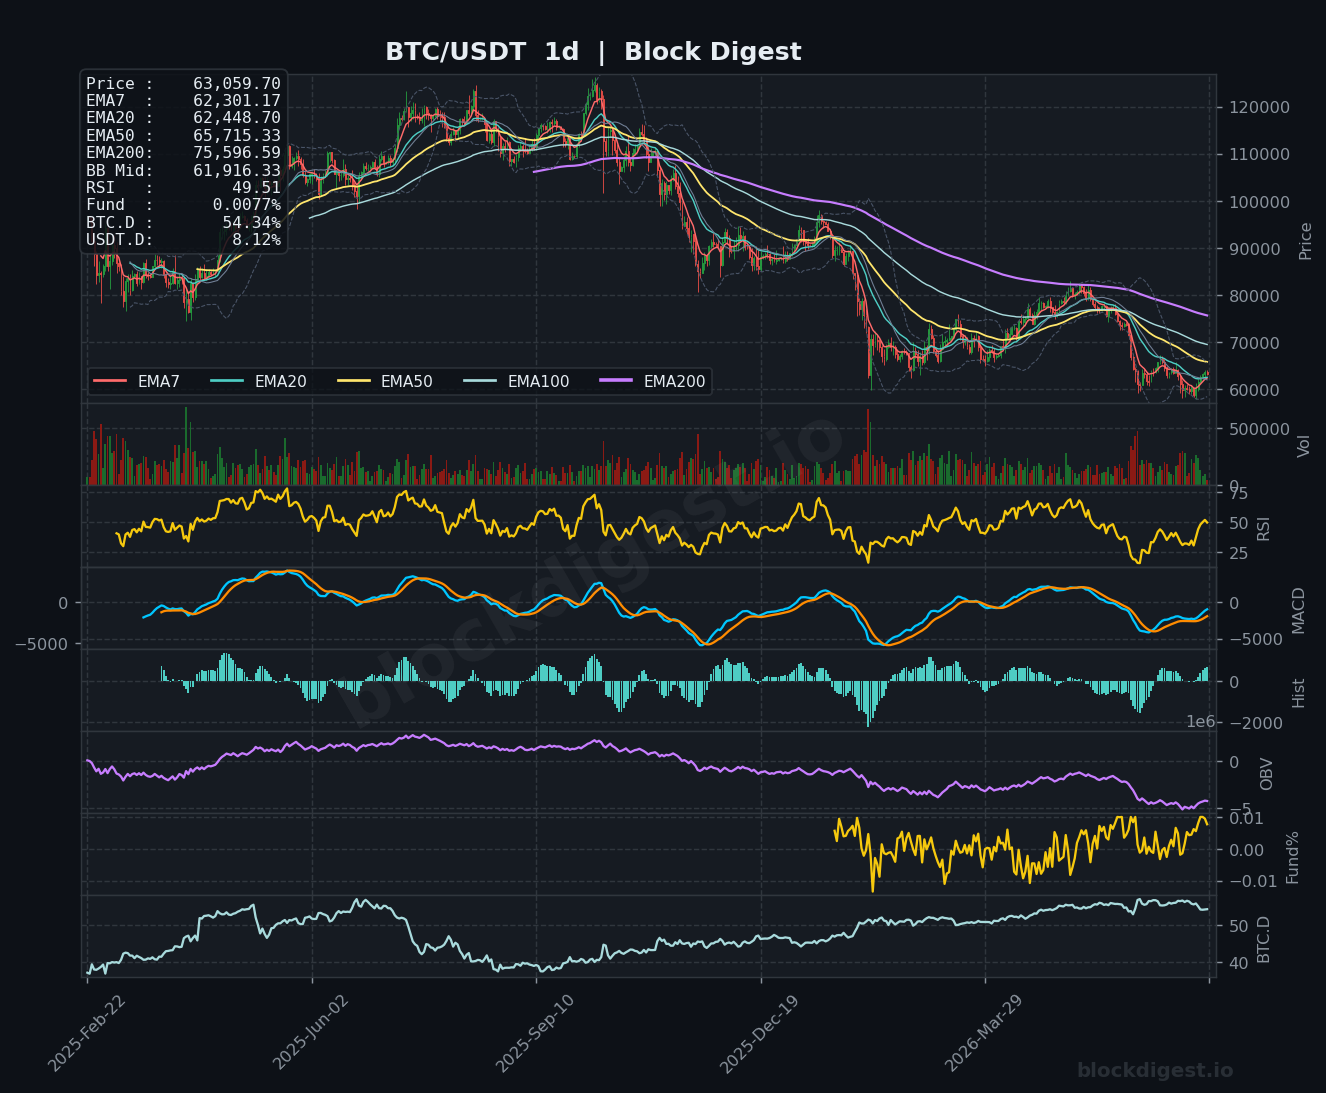
Bitcoin is currently trading at $63,059.70, sitting just above the Bollinger Band midline on the daily chart ($61,916.33) while remaining well beneath the descending EMA50 ($65,715.33) and far below the EMA200 ($75,596.59). The dominant daily trend remains bearish, with price having declined from all-time highs and all major EMAs stacked in a bearish order above current price. That said, recent price action shows a tentative recovery from the $58,000–$59,000 lows, with the daily EMA7 ($62,301.17) and EMA20 ($62,448.70) now providing near-term dynamic support just below spot. The Bollinger Bands on the daily have begun to contract after the recent expansion during the sell-off, suggesting momentum is decelerating and a directional resolution may be approaching.
Multi-Timeframe Confluence
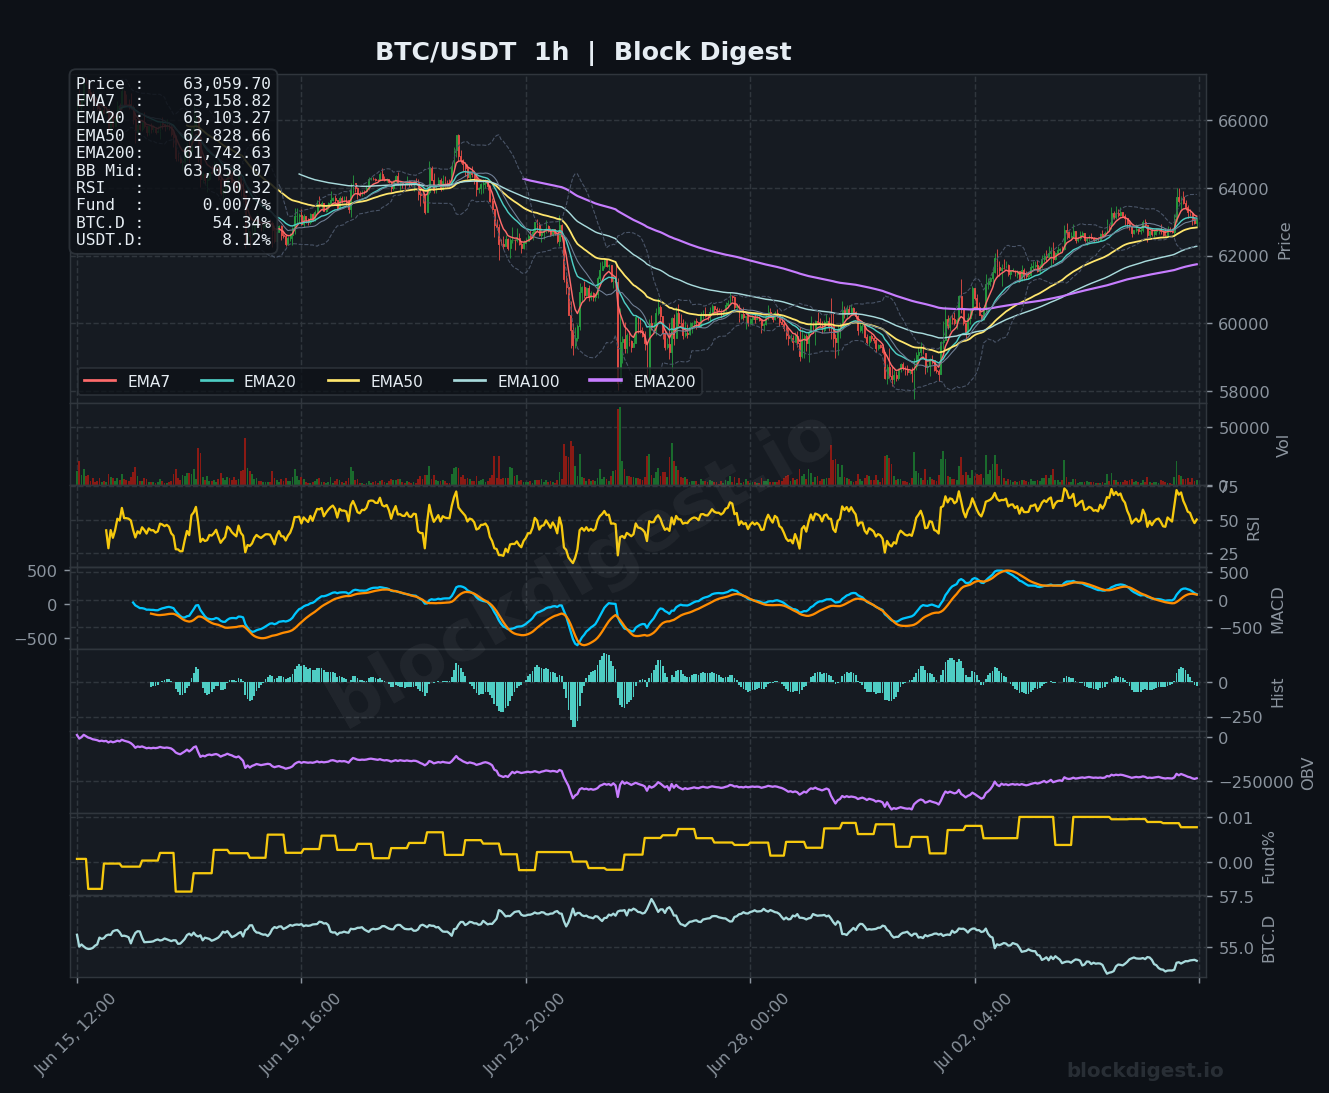
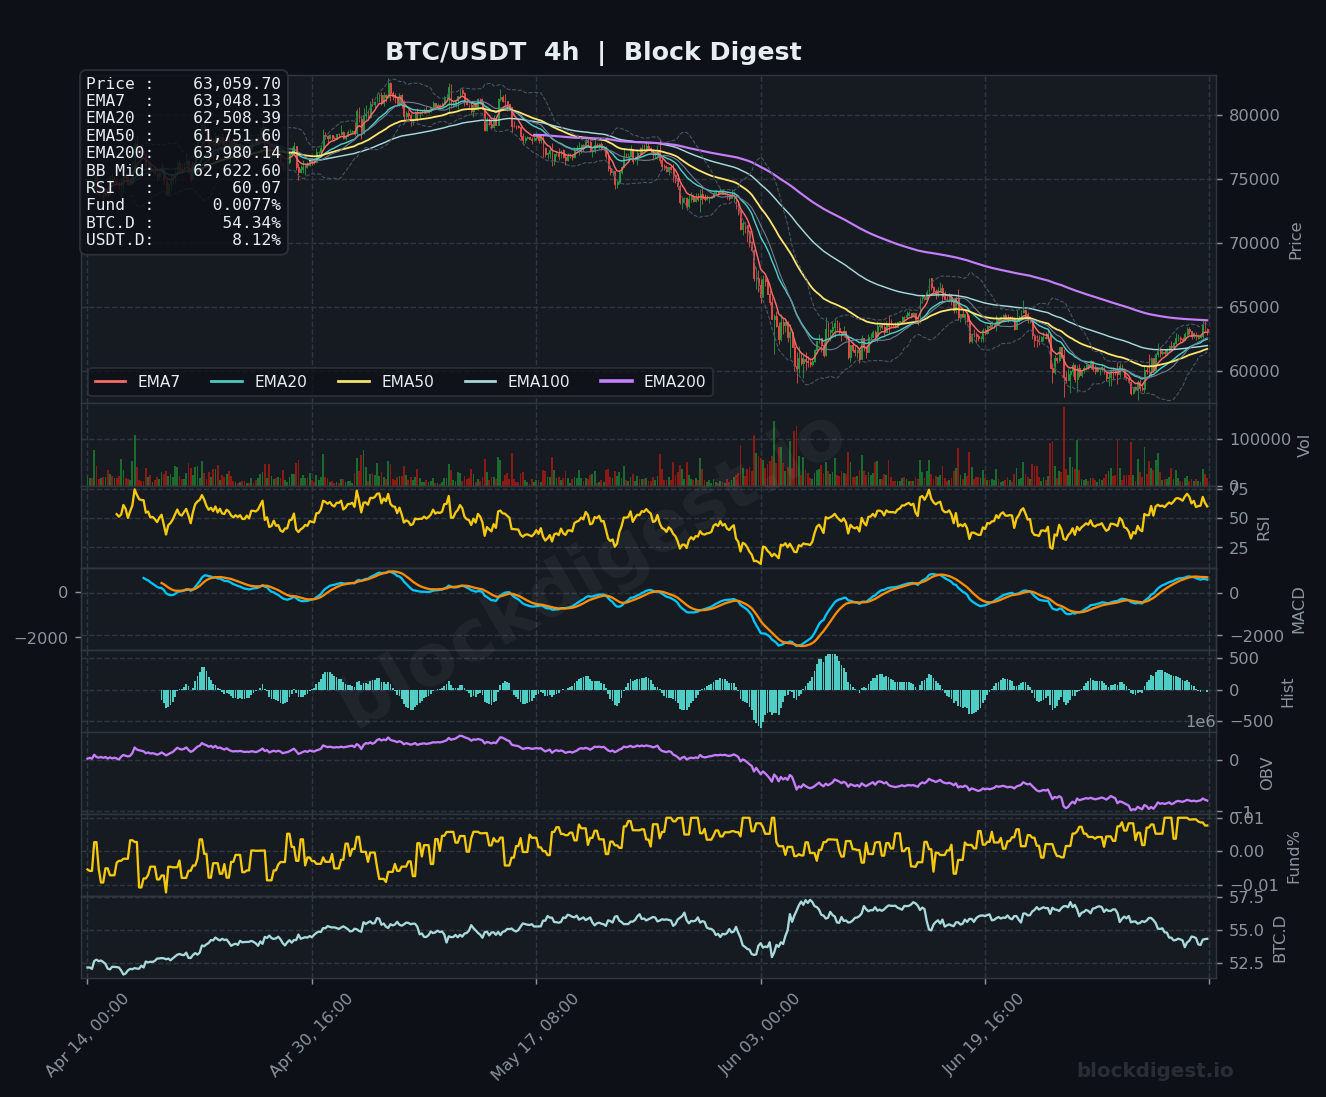
On the 1-hour chart, price is tightly compressed between the EMA7 ($63,158.82), EMA20 ($63,103.27), and current spot — a cluster that signals short-term indecision following the sharp recovery from the $58,500 area. The 4-hour chart presents a modestly more constructive picture: price has crossed above the EMA7 ($63,048.13) and EMA20 ($62,508.39), with RSI at 60.07 indicating emerging bullish momentum without yet reaching overbought territory. However, the daily timeframe continues to exert a bearish override, with price still trading beneath the EMA50 and EMA200 — both sloping downward — meaning any short-term recovery remains a counter-trend move within a broader downtrend. The $63,000–$63,200 zone represents a key area of confluence where all short-term EMAs converge across the 1h and 4h timeframes.
Key Levels to Watch
- Resistance: $64,000–$64,500 — The upper Bollinger Band on the 1-hour chart and a prior consolidation zone; options market activity flags $66,000–$68,000 as the next significant resistance trap above this.
- Resistance: $65,715 — The descending daily EMA50, which has capped every recovery attempt in recent weeks and represents the most critical structural barrier to a trend reversal.
- Resistance: $67,000–$68,000 — Analyst-identified supply zone where significant long liquidations occurred previously; a confirmed break here would materially alter the bearish thesis.
- Support: $62,300–$62,500 — Confluence of the daily EMA7 and EMA20, as well as the 4-hour EMA20; losing this zone on a closing basis would weaken the recovery narrative.
- Support: $61,750–$61,916 — The 4-hour EMA50 ($61,751.60) and the daily Bollinger Band midline ($61,916.33); a critical demand zone that held during the recent consolidation phase.
- Support: $58,500–$59,000 — The recent swing low visible across all timeframes; a retest of this level would suggest the corrective bounce has failed entirely.
Momentum & On-Chain Signals
The RSI readings across timeframes paint a mixed but cautiously improving picture: the 1-hour RSI sits at 50.32 (neutral), the 4-hour at 60.07 (constructive), and the daily at 49.51 (neutral, hovering near the midline after recovering from oversold readings near 25). The daily MACD remains in negative territory but the histogram bars are shrinking, suggesting the bearish impulse is losing steam — a potential bullish crossover on the daily MACD would be a meaningful signal to watch. OBV on the 4-hour and daily charts continues to trend lower, however, indicating that the recovery has not yet been accompanied by sustained accumulation volume, which tempers optimism. The funding rate of 0.0077% is essentially flat, reflecting neither aggressive long nor short positioning and consistent with a market in wait-and-see mode.
BTC Dominance & Market Sentiment
BTC.D sits at 54.34%, having pulled back from recent highs above 57% visible on the 4-hour chart — this modest decline in dominance suggests some capital rotation into altcoins, though the level remains elevated by historical standards, reflecting continued risk-off positioning across the broader crypto market. USDT.D at 8.12% remains elevated, signaling that a meaningful portion of crypto capital is parked in stablecoins, consistent with cautious sentiment and limited appetite for aggressive risk deployment. Together, these readings suggest the market is not in full risk-on mode, and any sustained BTC rally will likely require a more decisive drop in USDT.D.
Risk Scenarios
- Bullish case: A clean daily close above $65,715 (EMA50) on expanding volume, accompanied by a MACD bullish crossover on the daily, would shift the intermediate-term bias to neutral-to-bullish, opening a path toward $68,000–$70,000. Confirmation from a declining USDT.D below 7.5% and an OBV inflection higher would further support this scenario.
- Bearish case: Failure to hold $62,300–$62,500 on a daily closing basis, particularly if accompanied by a re-expansion of the Bollinger Bands to the downside and RSI breaking below 40 on the daily, would expose the $58,500 swing low and potentially the $55,000–$56,000 region beyond it.
Outlook
The near-term bias is cautiously neutral with a slight bullish lean on the short timeframes, given the 4-hour RSI strength and price reclaiming the key short-term EMAs — but this recovery remains fragile within a structurally bearish daily trend. The next 24–48 hours are critical: a hold above $62,300 and a push through $64,500 would build confidence in the bounce, while rejection at current levels and a slide back below $62,000 would signal exhaustion. The $65,715 daily EMA50 is the single most important level that would change the broader thesis — until that is decisively reclaimed, rallies should be treated as counter-trend. With Citi cutting its BTC target to $82,000 and sticky inflation data continuing to weigh on risk appetite, the macro environment remains a headwind that technical recoveries must contend with.
Disclaimer: This analysis is for informational purposes only and does not constitute financial advice. Cryptocurrency markets are highly volatile and unpredictable. All trading decisions should be made based on your own research and risk tolerance. Block Digest is not responsible for any financial losses incurred as a result of acting on this content.
Stay Ahead of the Market
Follow BlockDigest for crypto market intelligence, research and real-time updates.


