
market analysis
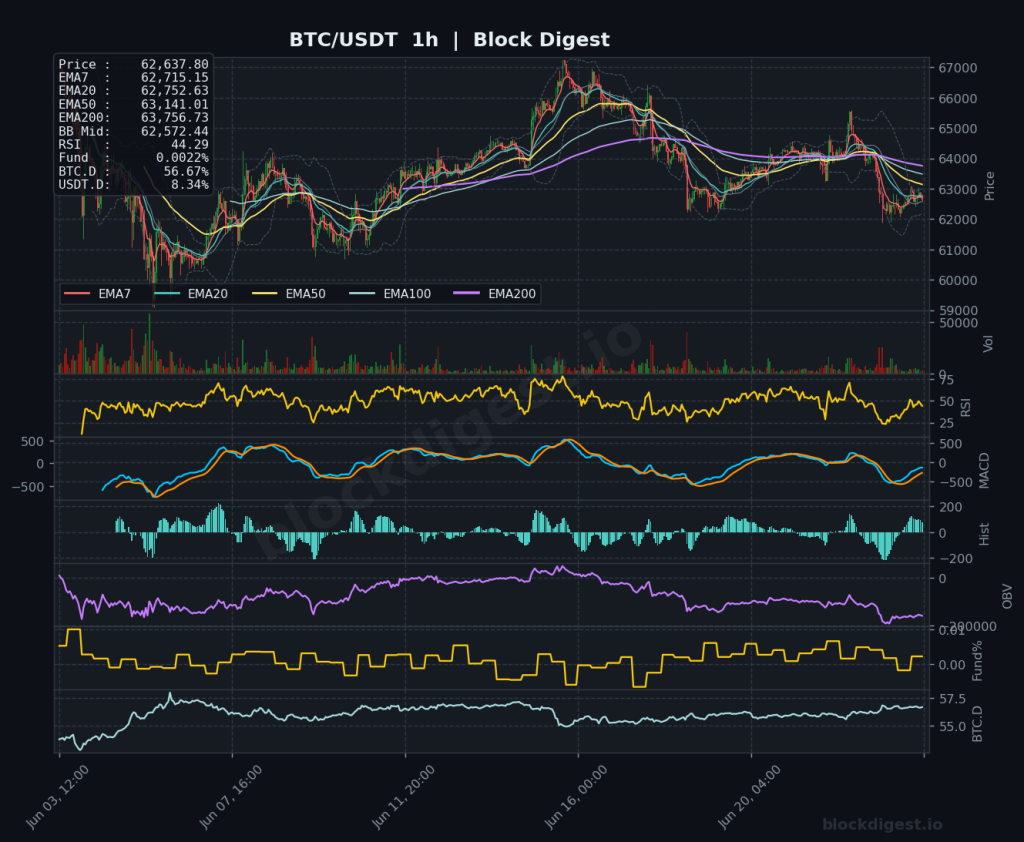
Bitcoin Daily Analysis: Bitcoin Below All EMAs, Bearish Structure Confirmed
Market Overview Bitcoin is currently trading at $62,637.80, positioned below all major EMAs on both the 4h and daily timeframes, painting a structurally bearish picture. On the daily chart, price sits beneath the EMA7 ($63,389), EMA20 ($64,836), EMA50 ($68,561), and the deeply overhead EMA200 ($77,472), confirming that the dominant trend remains firmly downward following the...
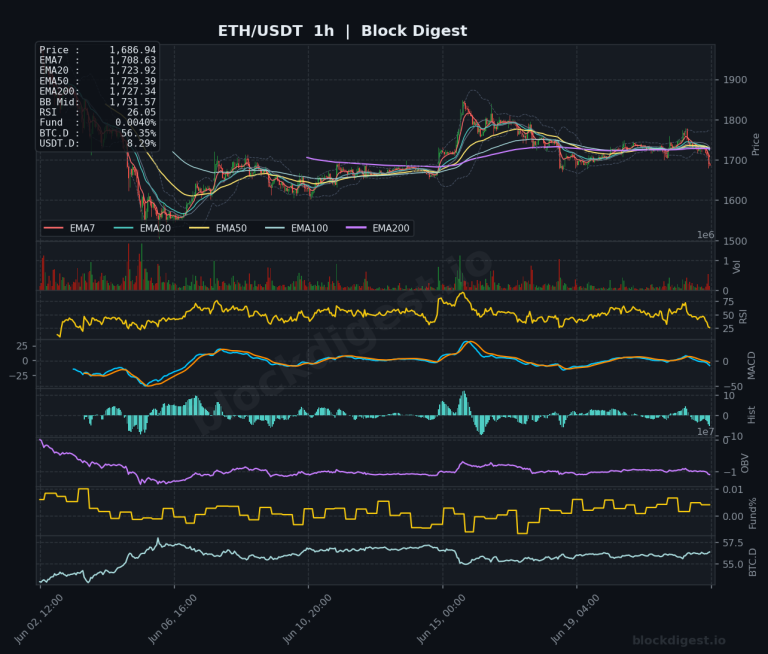
Ethereum Daily Analysis: ETH Below EMA200, Bollinger Band Resistance
Market Overview ETH/USDT is currently trading at $1,686.94, positioned beneath every key exponential moving average across all observed timeframes — a structurally bearish configuration. On the daily chart, price sits well below the EMA200 at $2,335.61, the EMA50 at $1,901.64, and the EMA20 at $1,755.58, confirming that the dominant trend remains firmly downward. The daily...
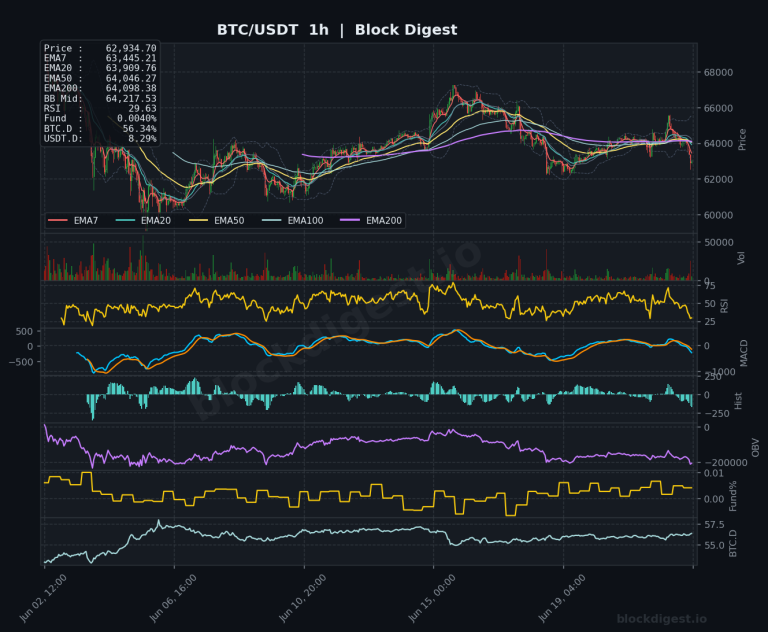
Bitcoin Daily Analysis: Bitcoin Below All EMAs at $62,934
Market Overview Bitcoin is currently trading at $62,934.70, sitting below all major EMAs across the daily timeframe — EMA7 ($63,699), EMA20 ($65,090), EMA50 ($68,812), and EMA200 ($77,617) — confirming a structurally bearish macro backdrop. Price has broken down significantly from the cycle highs and is now trading near the lower Bollinger Band on the daily...
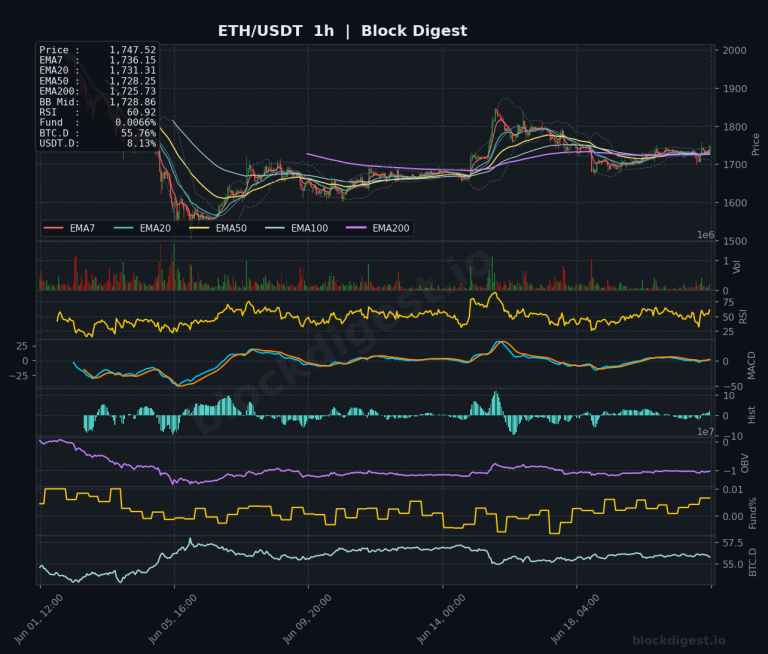
Ethereum Daily Analysis: ETH at $1,747 Reclaims Short-Term EMAs
Market Overview ETH/USDT is currently trading at $1,747.52, sitting in a structurally weak position on the daily timeframe despite a modest short-term recovery from recent lows. On the 1-hour chart, price has reclaimed all short-term EMAs — EMA7 ($1,736.15), EMA20 ($1,731.31), EMA50 ($1,728.25), and EMA200 ($1,725.73) — suggesting near-term bullish momentum has returned after a...

Bitcoin Daily Analysis: Bitcoin at $64K, Below Key EMA Levels
Market Overview Bitcoin is currently trading at $64,247, navigating a structurally challenging environment following a prolonged decline from cycle highs well above $100,000. On the daily timeframe, price remains firmly below the EMA50 ($69,061), EMA200 ($77,767), and EMA20 ($65,339), confirming that the dominant trend is bearish. The daily Bollinger Band midline sits at $63,563, and...

Ethereum Daily Analysis: ETH Below EMA20 at $1,732 Amid Downtrend
Market Overview ETH/USDT is currently trading at $1,732.11, sitting in a structurally precarious position on the daily timeframe following a prolonged downtrend from highs above $4,000. Price is trading below the daily EMA20 ($1,768.96), EMA50 ($1,918.88), and far beneath the EMA200 ($2,348.52), confirming that the dominant macro trend remains firmly bearish. On the positive side,...
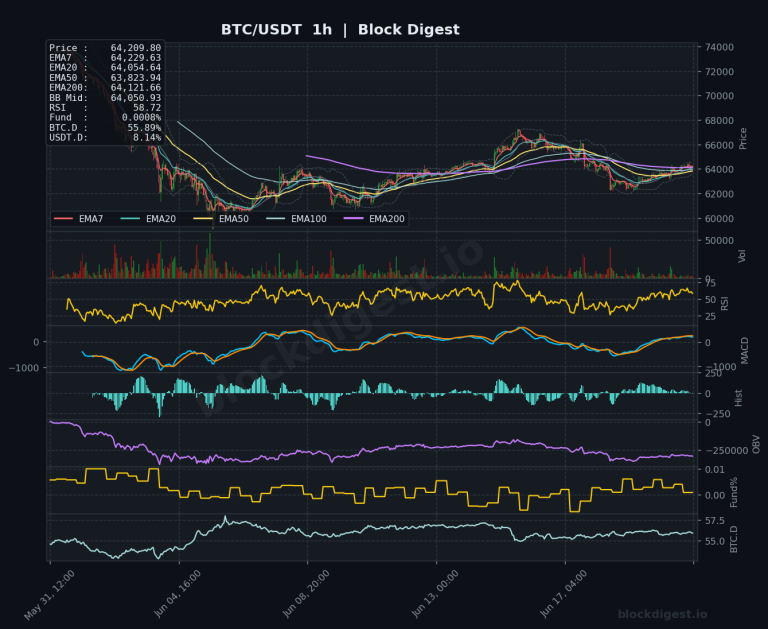
Bitcoin Daily Analysis: Below EMAs, Stabilizing Above Bollinger Midline
Market Overview Bitcoin is currently trading at $64,209.80, navigating a technically precarious zone following a significant multi-month correction from highs near $109,000. On the daily timeframe, price sits below all major EMAs — the EMA20 at $65,544, EMA50 at $69,294, EMA200 at $77,912 — confirming a dominant bearish structure. Price is trading slightly above the...
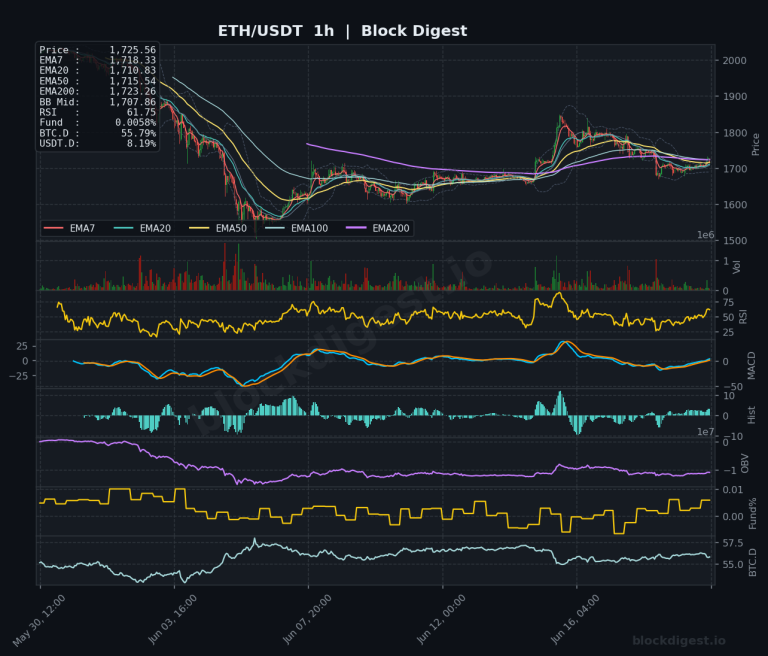
Ethereum Daily Analysis: ETH Trades Below EMA50 Amid Downtrend
Market Overview ETH/USDT is currently trading at $1,725.66, sitting in a precarious position within a prolonged macro downtrend that has erased significant value from the late-2025 highs above $4,000. On the daily timeframe, price is trading well beneath the EMA50 ($1,925.94), EMA200 ($2,355.01), and even the EMA20 ($1,771.48), confirming that the dominant structure remains bearish....

Bitcoin Daily Analysis: Bitcoin Below EMA7 in Bearish Technical Setup
Market Overview Bitcoin is currently trading at $63,699.40, navigating a technically precarious position as price sits below its daily EMA7 ($64,017.91), EMA20 ($65,630.81), EMA50 ($69,480.07), and EMA200 ($78,045.12) — a full bearish EMA stack on the daily timeframe. Price is hugging the lower Bollinger Band region on the daily chart, with the BB Midline at...

Ethereum Daily Analysis: ETH trades below all key moving averages
Market Overview ETH/USDT is currently trading at $1,696.83, positioned well beneath every key moving average across all timeframes — a structurally bearish configuration. On the daily chart, price sits below the EMA7 ($1,722.92), EMA20 ($1,775.02), EMA50 ($1,933.59), and the distant EMA200 ($2,361.90), confirming that the dominant trend remains firmly to the downside. The Bollinger Band...
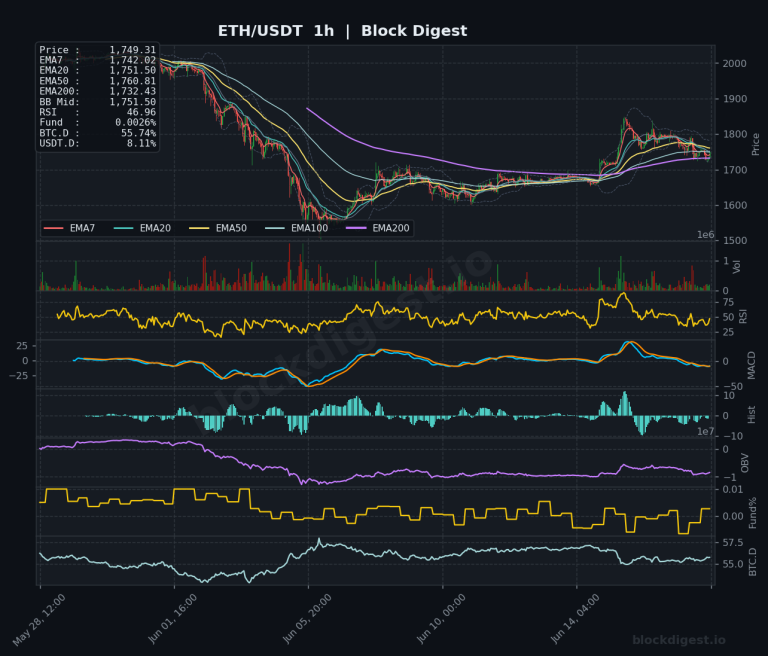
Ethereum Daily Analysis: ETH slides below EMA50 amid bearish structure
Market Overview ETH/USDT is currently trading at $1,749.31, sitting in a structurally weak position across all major timeframes. On the daily chart, price remains well below its EMA50 ($1,944.79), EMA100, and the steeply declining EMA200 ($2,368.58), confirming that the dominant trend is firmly bearish. The Bollinger Band midline on the daily sits at $1,754.70, with...

Bitcoin Daily Analysis: Bitcoin Below EMA50 as Sellers Maintain Control
Market Overview Bitcoin is currently trading at $64,433.60, sitting in a technically precarious position relative to its key moving averages. On the daily timeframe, price remains well below the EMA50 ($70,028) and EMA200 ($78,359), confirming that the dominant trend remains bearish from the macro perspective. Price is trading just beneath the daily Bollinger Band midline...