
Market Overview
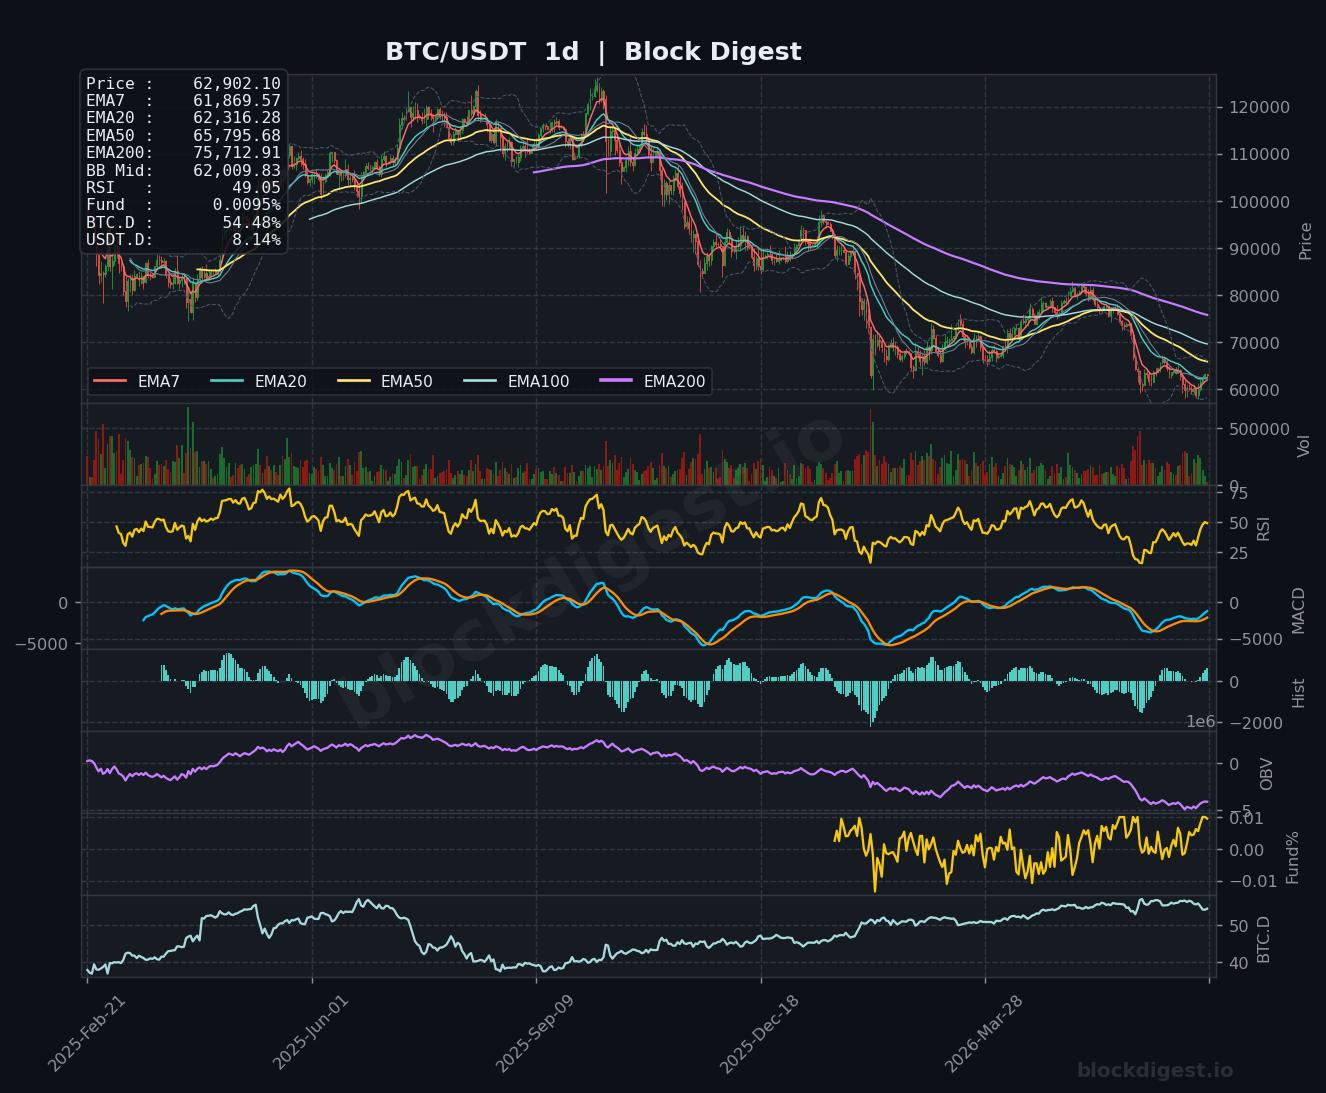
Bitcoin is trading at approximately $62,902–$62,905 as of July 5, 2026, consolidating near a critical inflection point following a significant bear market drawdown from the $126,000 all-time high reached in October 2025. On the daily timeframe, price remains firmly below the EMA50 ($65,795) and EMA200 ($75,712), confirming that the macro trend structure is still bearish despite the recent recovery off lows near $58,000. Price is currently hugging the Bollinger Band midline ($62,009 daily) from above, suggesting a tentative stabilization rather than a confirmed trend reversal. The dominant daily structure remains one of lower highs and lower lows, and any meaningful recovery must first contend with a dense cluster of overhead EMAs.
Multi-Timeframe Confluence
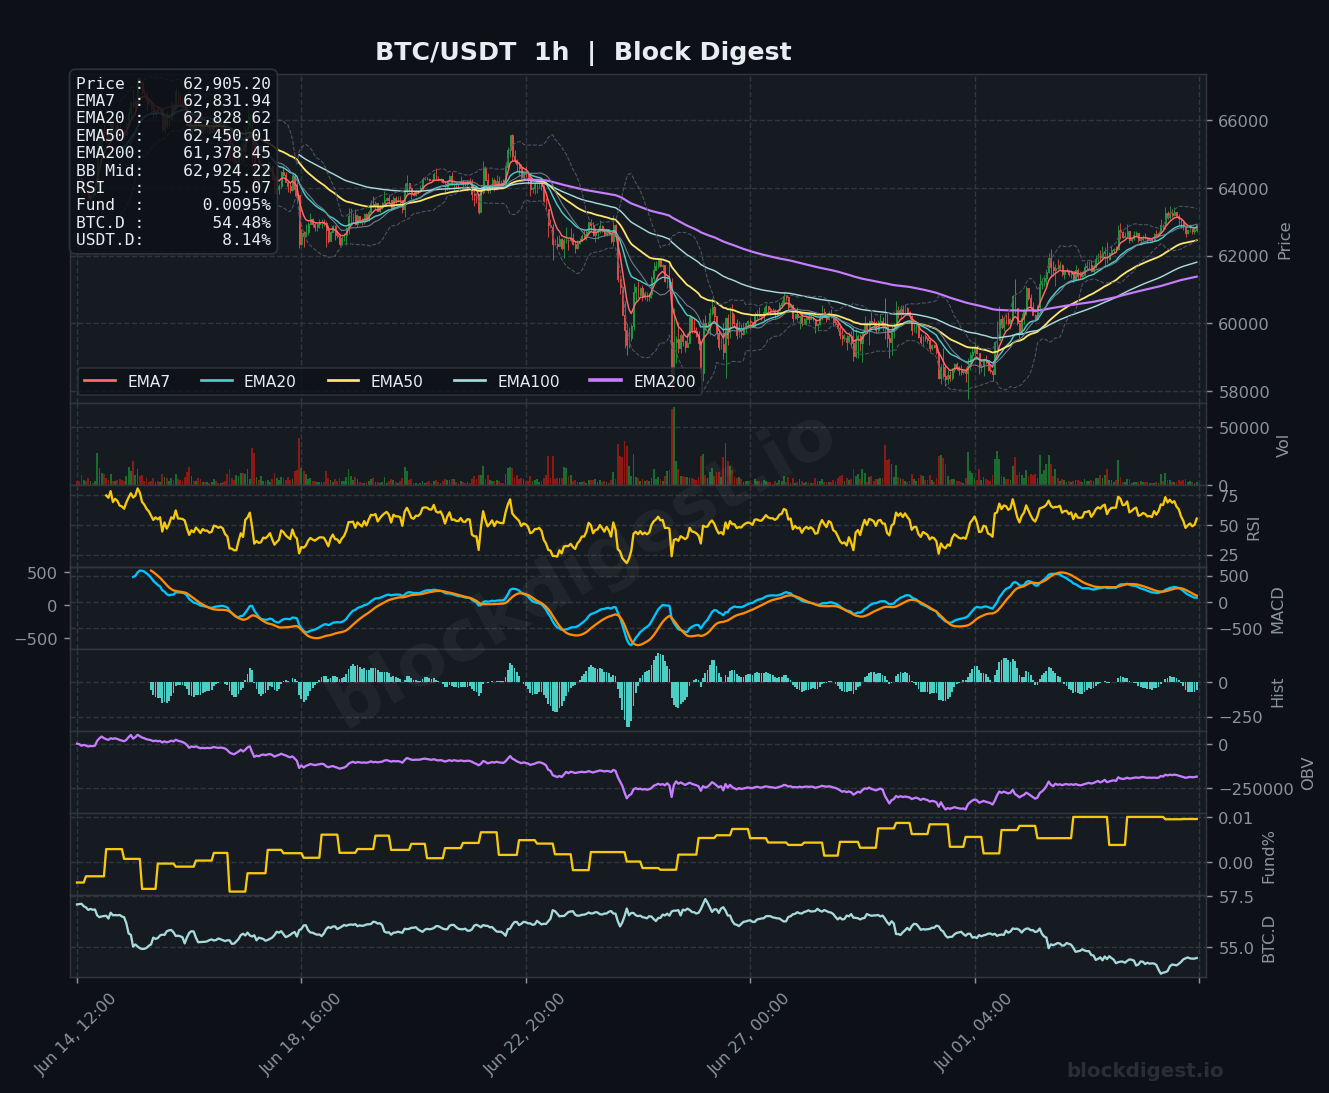
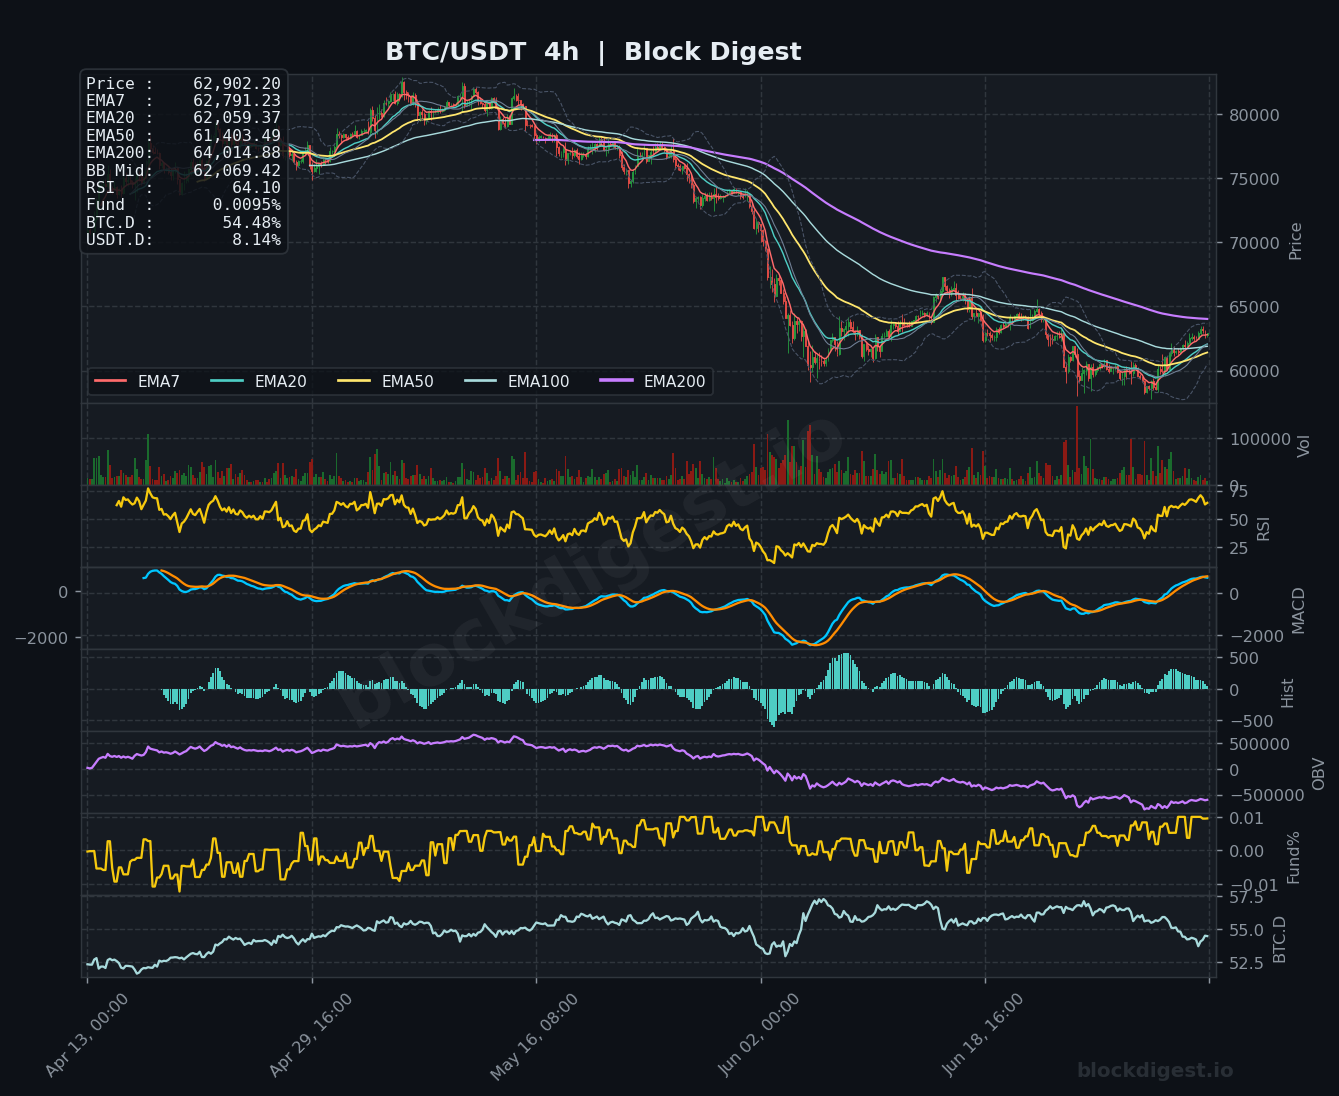
On the 1-hour chart, price is trading just above the tightly compressed EMA cluster (EMA7: $62,831, EMA20: $62,828, EMA50: $62,450), indicating very short-term bullish alignment but with limited separation — a sign of indecision rather than strong momentum. The 4-hour timeframe shows price breaking above the EMA7 ($62,791) and EMA20 ($62,059), with the RSI at 64.10 reflecting emerging upside momentum, though the EMA200 at $64,014 looms as significant resistance directly overhead. Critically, the daily chart shows price still positioned below all major EMAs, meaning the short-term recoveries visible on lower timeframes are counter-trend moves within a larger bearish structure. There is meaningful confluence of resistance in the $64,000–$65,800 zone across all three timeframes.
Key Levels to Watch
- Resistance: $64,014 — the 4h EMA200, which has acted as dynamic resistance throughout the post-peak decline and represents the first major ceiling for any sustained recovery attempt
- Resistance: $65,795 — the daily EMA50, a macro-level resistance level where sellers have repeatedly defended during the broader downtrend; a close above here would significantly shift the structural outlook
- Resistance: $66,000–$66,500 — the upper Bollinger Band region on the 1h chart and a prior consolidation zone that capped price before the June sell-off
- Support: $62,009 — the daily Bollinger Band midline, currently acting as the first meaningful floor; a decisive close below here would re-expose downside
- Support: $61,378 — the 1h EMA200, the last dynamic support layer before price would re-enter the prior consolidation range near $60,000
- Support: $59,000–$58,500 — the recent swing low region, which represents the critical macro support floor; a breach here would invalidate the current recovery thesis entirely
Momentum & On-Chain Signals
The RSI readings tell a layered story: the 1-hour RSI sits at a neutral-to-mildly-bullish 55.07, the 4-hour RSI is more constructive at 64.10 approaching mildly overbought territory, while the daily RSI has recovered to approximately 49.05 — just below the 50 midline, confirming that macro momentum remains neutral-to-bearish. The 4-hour MACD has crossed into positive territory with a rising histogram, supportive of the near-term bounce, though the daily MACD remains in a slow bearish curl with minimal histogram expansion. OBV on both the 1h and 4h charts shows a subdued recovery — volume has not meaningfully surged on up moves, suggesting accumulation is tepid and the rally lacks strong conviction. Funding rates at 0.0095% are slightly positive but negligible, indicating the market is not heavily leveraged to the upside, which reduces liquidation cascade risk but also limits forced momentum.
BTC Dominance & Market Sentiment
BTC dominance stands at 54.48%, having declined from highs closer to 57–58% visible on the daily chart, suggesting that altcoins have been capturing some capital flows during the recent stabilization phase. USDT dominance at 8.14% remains elevated relative to bull market norms, reflecting that a significant portion of market participants continue to hold cash-equivalent positions — a sign of persistent caution and reduced overall risk appetite. For BTC specifically, the declining dominance combined with elevated stablecoin dominance implies that the broader market has not yet committed to a sustained risk-on rotation, keeping the recovery fragile.
Risk Scenarios
- Bullish case: A decisive 4-hour close above the $64,014 EMA200 on expanding volume, with RSI holding above 60 on the daily, would open the path toward the $65,795 daily EMA50 and potentially $68,000–$70,000 in subsequent sessions as short-seller covering accelerates.
- Bearish case: A rejection at current levels and a 4-hour close below $61,378 (1h EMA200) would likely trigger a retest of the $59,000–$58,500 support zone, and a breakdown through that floor would signal the recovery has failed and re-open the risk of a deeper structural decline.
Outlook
The current setup is cautiously recovery-oriented on the short-term timeframes, but structurally bearish on the daily — placing BTC at a pivotal juncture where the next 24–48 hours will be telling. The $64,000 resistance zone, defined by the 4h EMA200, is the most critical near-term level: a sustained breakout would shift momentum meaningfully, while a rejection from that zone would reinforce the broader downtrend. Traders should monitor whether the 4h RSI can sustain levels above 60 without rolling over, and watch OBV closely for any volume-backed confirmation of accumulation. Reports of rising whale deposits to exchanges add an overhead supply risk that could cap the recovery and should be weighed against any near-term technical breakout signals.
Disclaimer: This analysis is for informational purposes only and does not constitute financial advice. Cryptocurrency markets are highly volatile and unpredictable. All trading decisions should be made based on your own research and risk tolerance. Block Digest is not responsible for any financial losses incurred as a result of acting on this content.
Stay Ahead of the Market
Follow BlockDigest for crypto market intelligence, research and real-time updates.


