
Market Overview
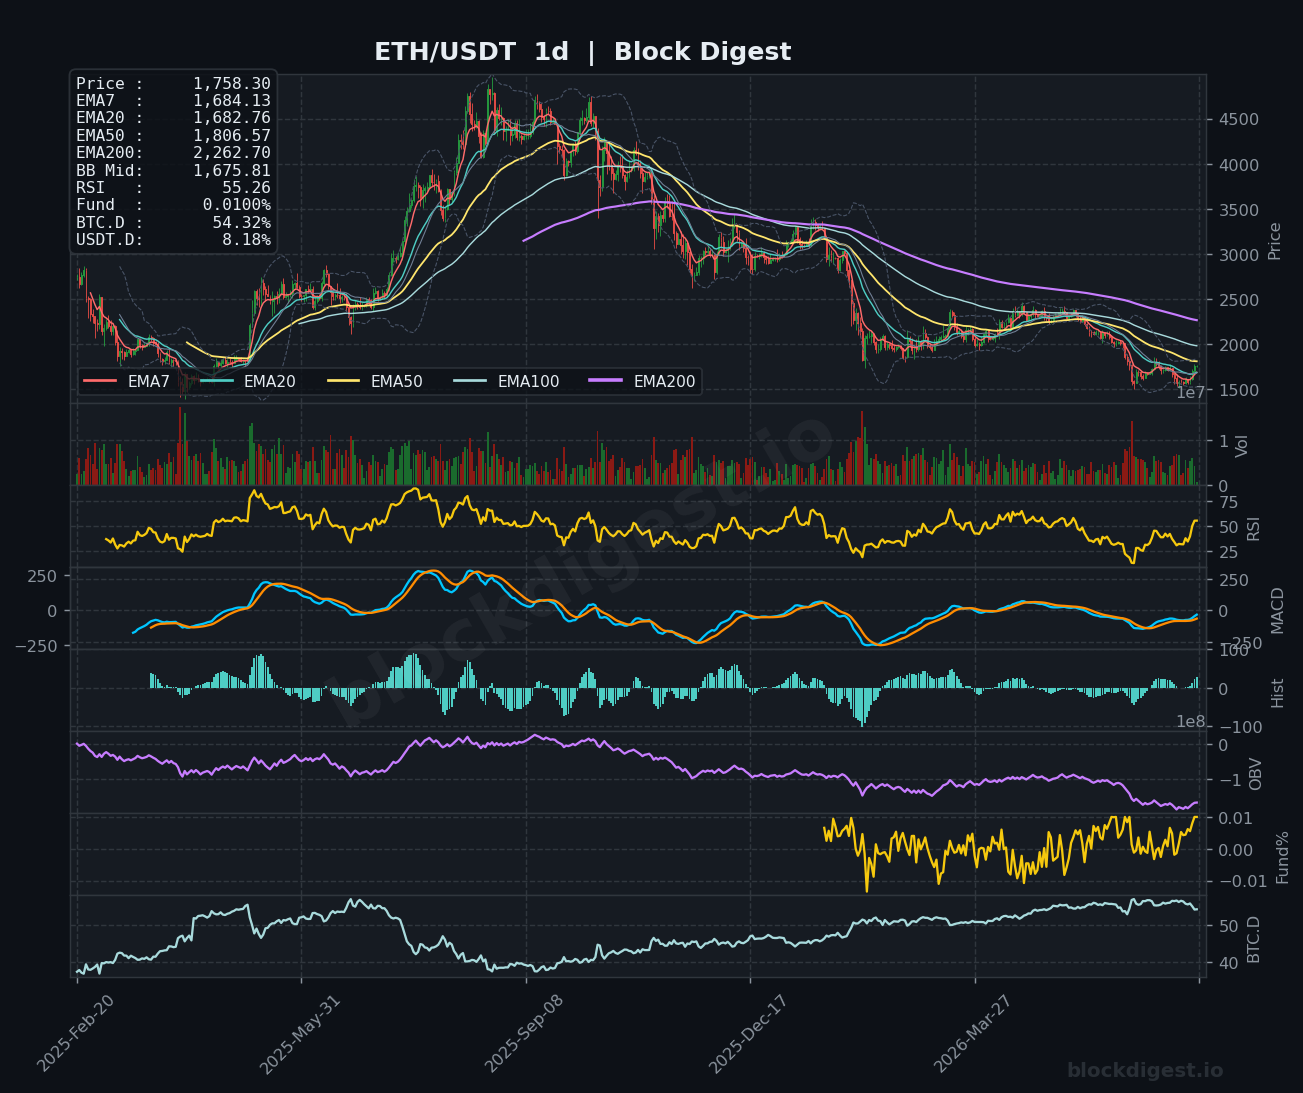
Ethereum is trading at $1,758.30 as of July 4, 2026, posting a notable recovery after weeks of sustained selling pressure that pushed price into the mid-$1,500s. On the daily timeframe, ETH remains structurally bearish over the longer term — trading well below the EMA200 ($2,262.70) and EMA50 ($1,806.57) — but the recent bounce has cleared both the daily EMA7 ($1,684.13) and EMA20 ($1,682.76), suggesting a nascent short-term shift in momentum. Price is currently pressing against the upper Bollinger Band on the 1-hour chart while sitting above the BB midline ($1,675.81) on the daily, a modest but meaningful reclaim. The dominant trend on the daily remains a protracted downtrend from the 2025 highs above $4,000, and the current move should be framed as a counter-trend recovery until higher timeframe structure is repaired.
Multi-Timeframe Confluence
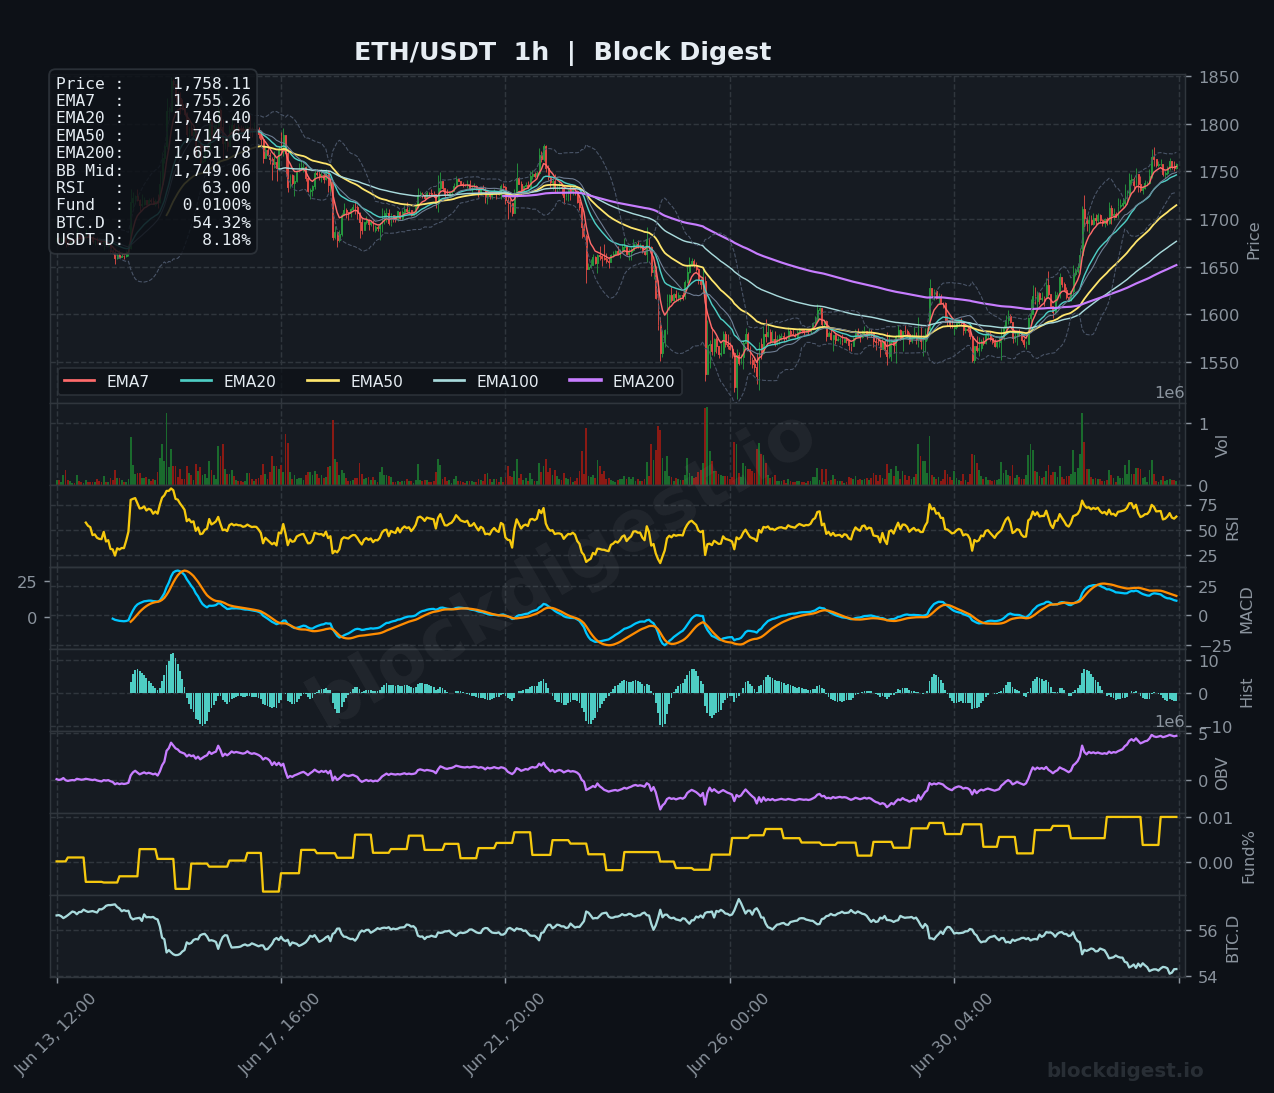
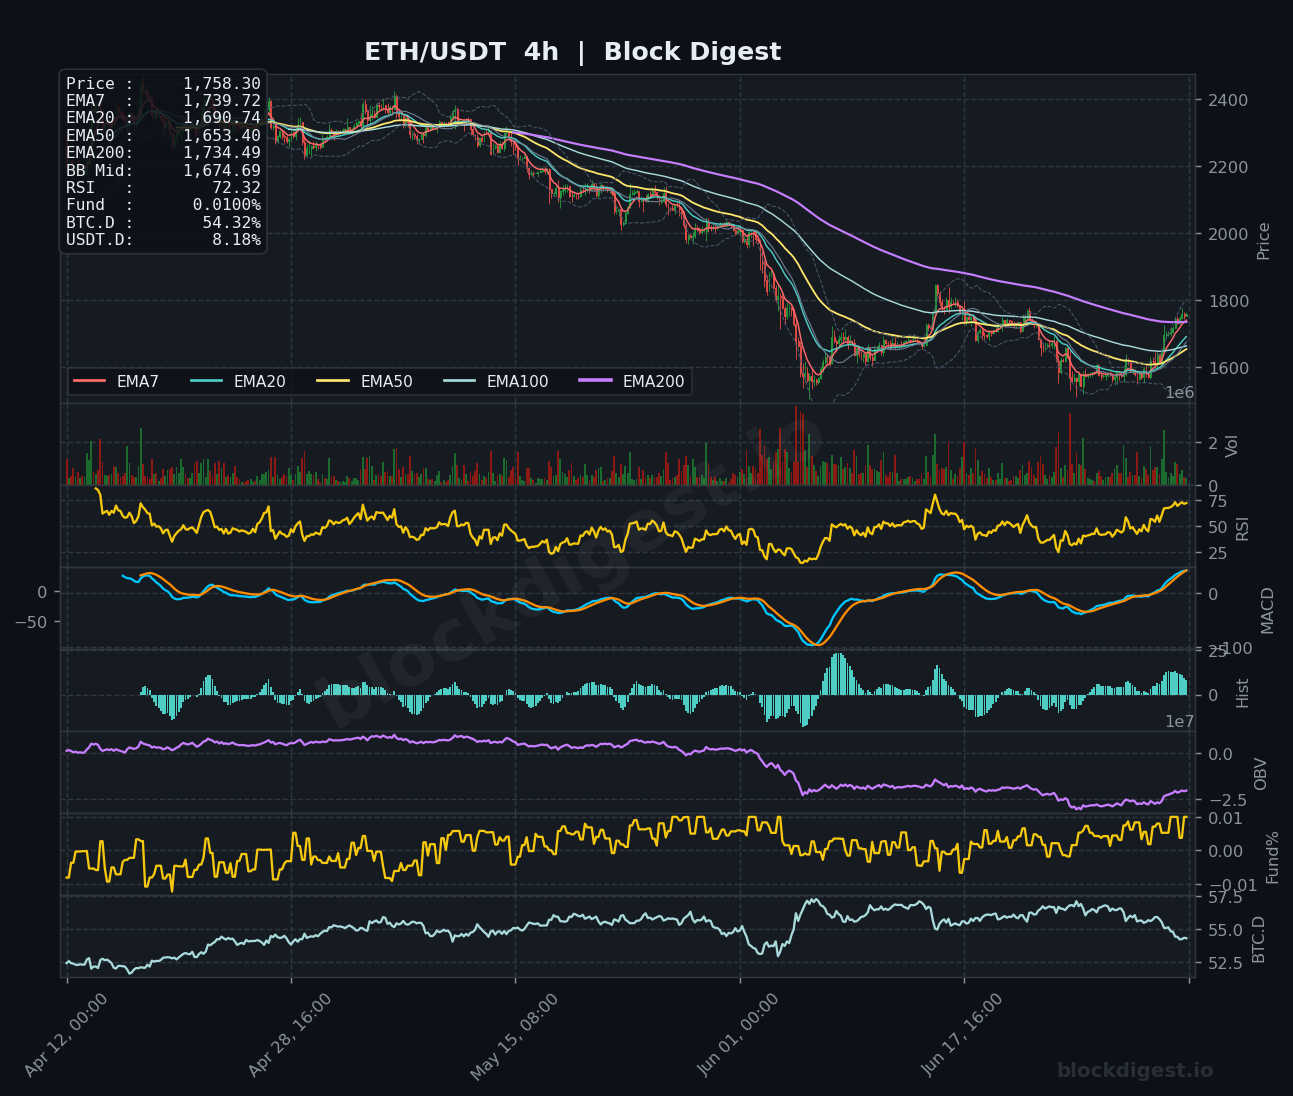
On the 1-hour chart, ETH is trading above all short-term EMAs — EMA7 ($1,755.26), EMA20 ($1,746.40), and EMA50 ($1,714.64) — in a well-stacked bullish configuration, with price pushing above the BB midline ($1,749.06), indicating intraday momentum is firmly to the upside. The 4-hour chart mirrors this strength, with EMA7 ($1,739.72) crossing above both EMA20 ($1,690.74) and EMA50 ($1,653.40), and price reclaiming the EMA200 at $1,734.49 — a significant intermediate-term level. However, the daily chart tells a more cautious story: while the EMA7 and EMA20 have been reclaimed, the EMA50 at $1,806.57 looms as a formidable resistance ceiling, and the broader EMA structure remains bearish. The confluence of short-term bullish momentum against a structurally weak higher timeframe setup creates a tension that traders should respect.
Key Levels to Watch
- Resistance: $1,806.57 — the daily EMA50, a critical overhead barrier that has capped price during prior recovery attempts and must be decisively cleared for trend reversal confirmation; $1,850 — the upper Bollinger Band zone on the 4-hour chart, where selling pressure is likely to emerge; $1,900–$1,920 — a broader structural resistance cluster and psychological level from prior consolidation.
- Support: $1,734.49 — the 4-hour EMA200, now acting as dynamic support following the recent reclaim and a key level bulls need to defend; $1,675–$1,682 — the daily EMA7/EMA20 cluster and BB midline confluence, representing the first meaningful support beneath current price; $1,600–$1,620 — the recent swing low region where heavy buying emerged, a critical floor for the broader recovery thesis.
Momentum & On-Chain Signals
The 4-hour RSI at 72.32 is pushing into overbought territory, flagging near-term exhaustion risk after the sharp recovery from the lows — traders should be alert to short-term pullbacks or consolidation at current levels. The 1-hour RSI at 63.00 remains elevated but has room to run before reaching overbought extremes, while the daily RSI at 55.26 is recovering from deeply oversold conditions and suggests the broader momentum shift is still in its early stages. MACD on the 4-hour is in a bullish crossover with expanding histogram bars, and the 1-hour MACD is tracking positive, though histogram momentum appears to be flattening near the highs. OBV on the 1-hour is trending sharply higher — a positive accumulation signal — but the 4-hour OBV remains in negative territory relative to prior peaks, indicating that cumulative buying pressure has not yet fully reversed the distribution phase. The funding rate sits at a neutral 0.0100% across timeframes, suggesting this rally is not yet over-leveraged, which reduces immediate liquidation cascade risk to the downside.
BTC Dominance & Market Sentiment
BTC dominance stands at 54.32% and is in a visible downtrend on the 1-hour chart, having declined from above 56% — a development that historically favors altcoin outperformance and aligns with ETH’s current relative strength. USDT dominance at 8.18% remains elevated but is not spiking, suggesting the market is not in acute risk-off flight-to-stablecoins mode. For ETH specifically, falling BTC.D in conjunction with $221 million in Bitcoin ETF inflows and broad short liquidations indicates a healthy rotation environment, supporting the case for continued ETH upside in the near term.
Risk Scenarios
- Bullish case: A sustained close above the daily EMA50 at $1,806.57 on meaningful volume would confirm a structural trend shift, opening a path toward the $1,850–$1,920 resistance band. Continued BTC ETF inflows and a dovish macro backdrop following the weak jobs report would further fuel upside momentum.
- Bearish case: Failure to hold the 4-hour EMA200 at $1,734.49 on any pullback would signal bull exhaustion and risk re-testing the $1,675–$1,682 support cluster. A breakdown below $1,600 would invalidate the recovery thesis entirely and expose the $1,500 lows once more.
Outlook
ETH’s near-term bias is cautiously bullish, driven by a confluence of macro tailwinds (weak jobs data reducing rate hike fears), a capitulation of bearish positioning ($281 million in short liquidations), and constructive short-term technical structure across the 1-hour and 4-hour charts. The key trigger to watch over the next 24–48 hours is whether price can consolidate above $1,734 (4H EMA200) and mount a credible challenge of the daily EMA50 at $1,806.57 — that level is the clearest line between a bear market bounce and a genuine trend reversal. The 4-hour RSI at 72 warrants respect; a brief retracement toward $1,700–$1,720 would be healthy and could offer a higher-probability re-entry zone for bulls. Until daily structure above $1,806 is reclaimed and held, this recovery should be treated as a counter-trend move within a larger downtrend.
Disclaimer: This analysis is for informational purposes only and does not constitute financial advice. Cryptocurrency markets are highly volatile and unpredictable. All trading decisions should be made based on your own research and risk tolerance. Block Digest is not responsible for any financial losses incurred as a result of acting on this content.
Stay Ahead of the Market
Follow BlockDigest for crypto market intelligence, research and real-time updates.


