
Market Overview
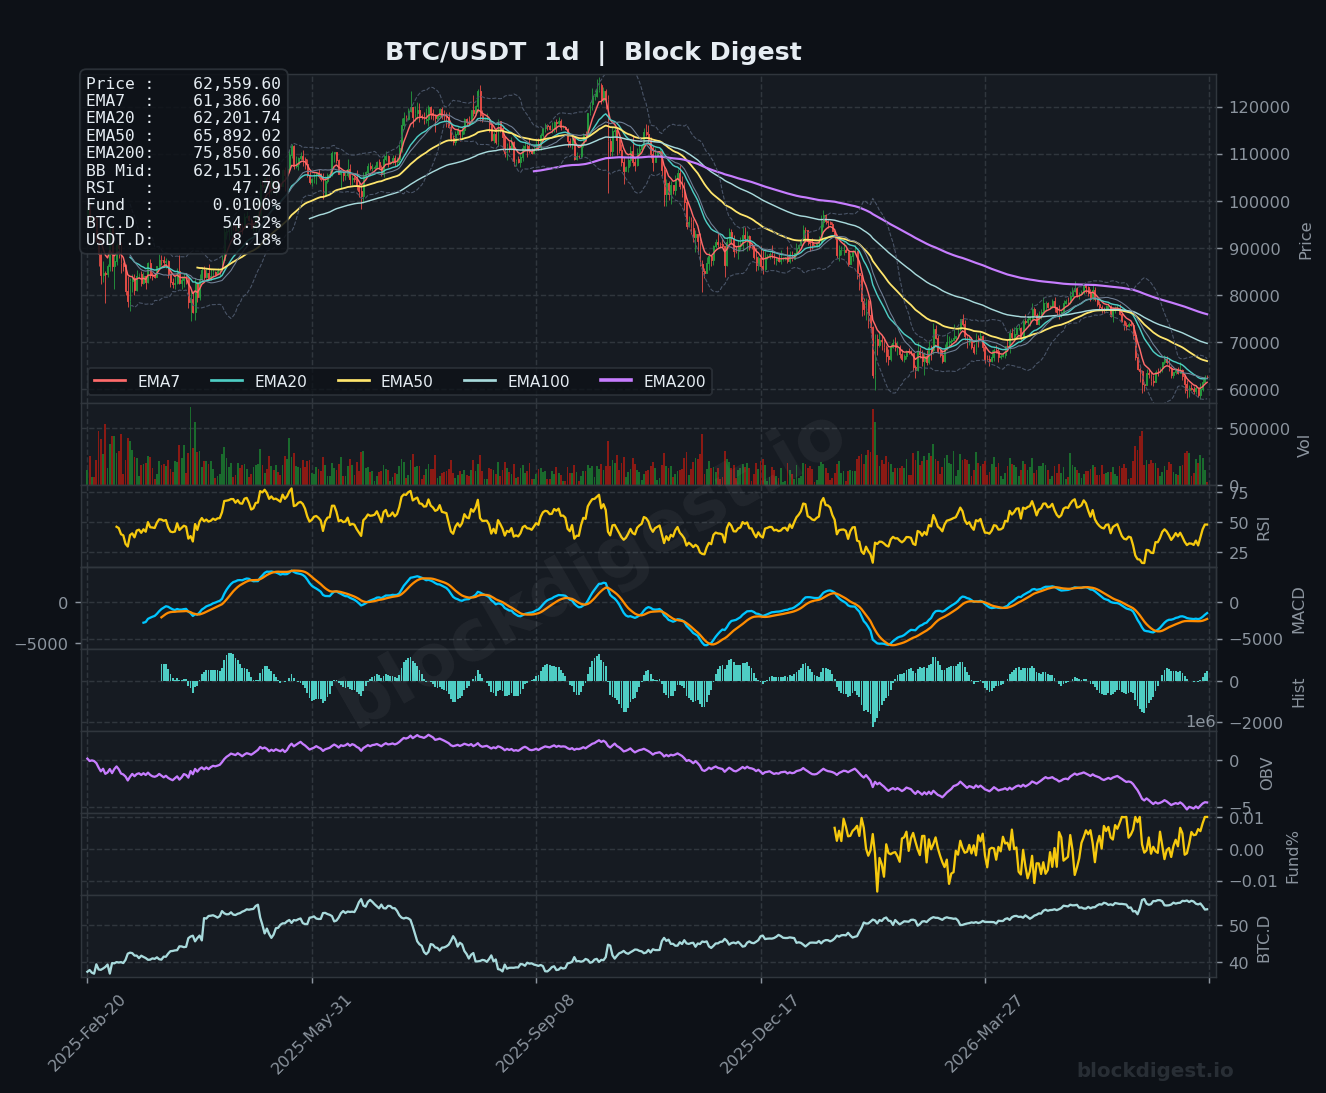
Bitcoin is trading at approximately $62,548–$62,677 as of July 4, 2026, having staged a meaningful recovery from multi-month lows near $58,000 seen in late June. On the daily timeframe, price remains in a well-defined downtrend, trading well below the EMA50 ($65,892), EMA200 ($75,850), and the descending EMA100, reflecting sustained macro bearish structure. However, price has reclaimed the daily EMA7 ($61,386) and is pressing against the EMA20 ($62,201), with the Bollinger Band midline sitting at $62,151 — a zone that now serves as the critical pivot for near-term directional bias. The dominant daily trend remains bearish, though the recent bounce is the most structurally significant recovery attempt in several weeks.
Multi-Timeframe Confluence
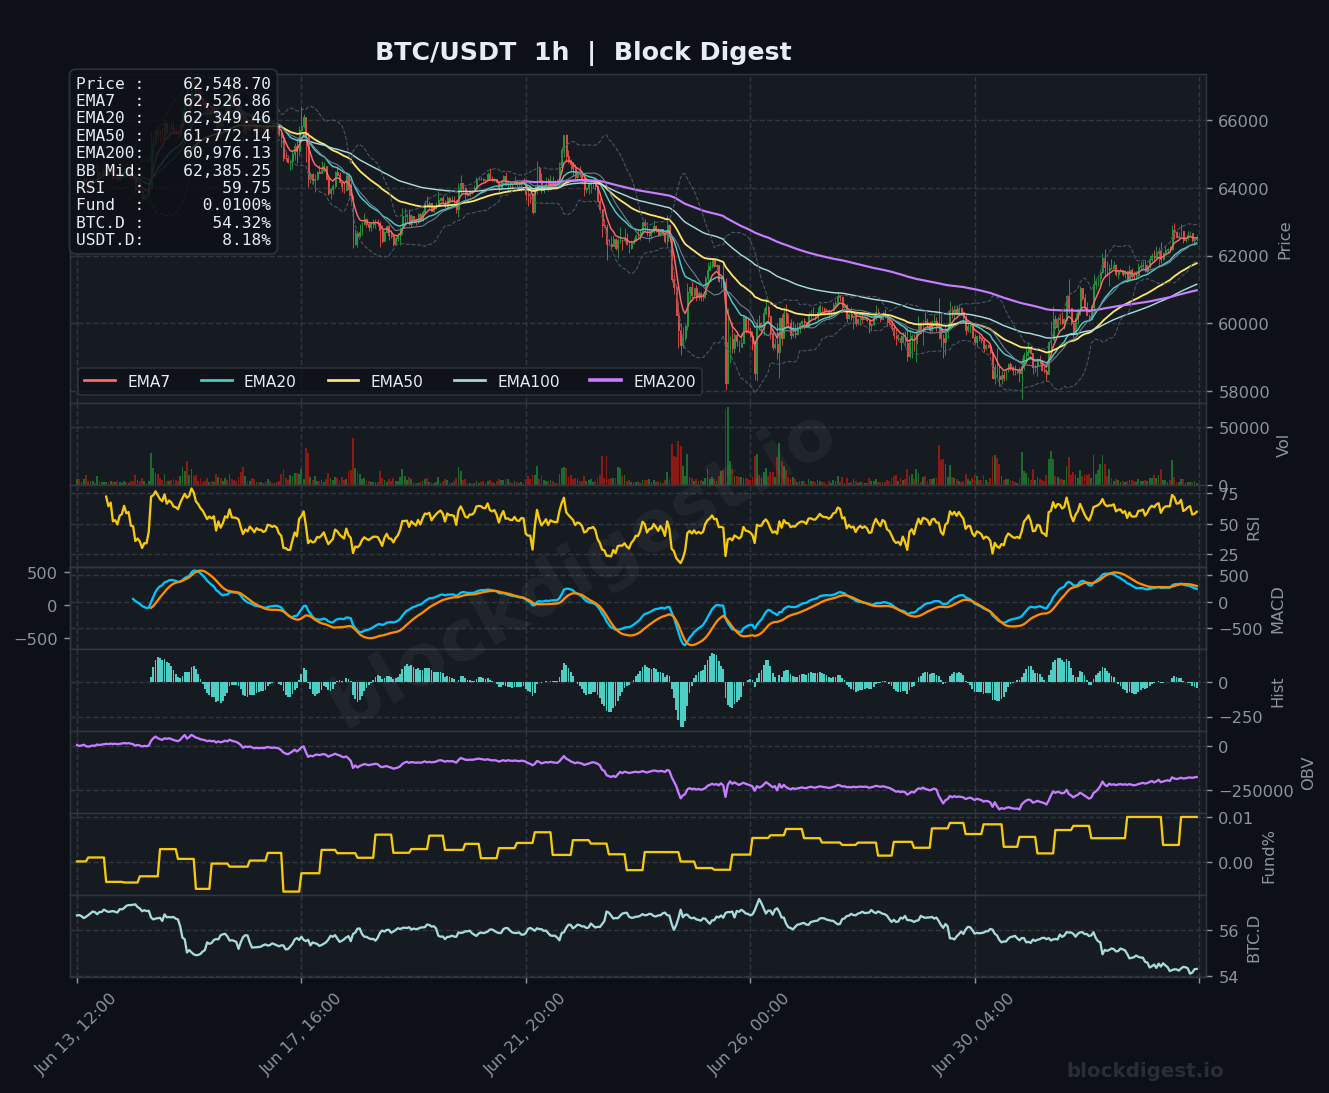
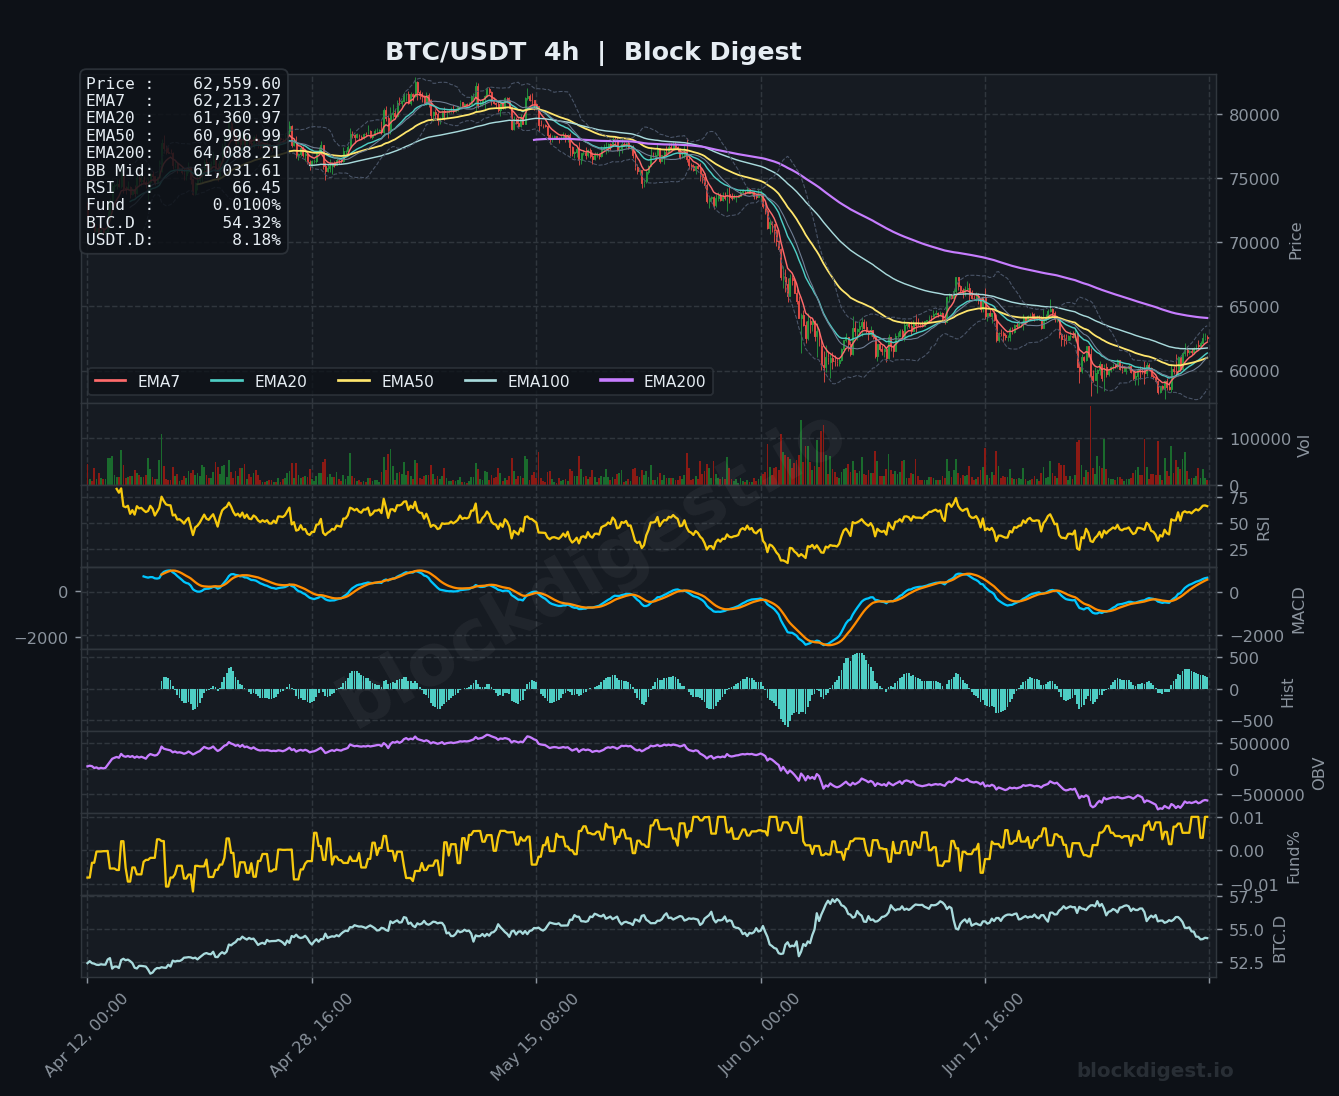
On the 1-hour chart, price is trading above all short-term EMAs (EMA7: $62,526, EMA20: $62,349, EMA50: $61,772, EMA200: $60,976), indicating a clean short-term bullish alignment that confirms the recovery impulse from the late-June lows. The 4-hour chart tells a similar story — price has reclaimed EMA7 ($62,213), EMA20 ($61,360), and EMA50 ($60,996) — but remains beneath the 4H EMA200 ($64,088), which looms as a significant overhead barrier. The daily chart’s EMA20 at $62,201 and the 4H EMA200 at $64,088 create a compressed resistance cluster that price must work through to validate a more sustained recovery. Short-term momentum supports higher prices, but higher timeframe structure remains decisively bearish, creating a cautious confluence environment.
Key Levels to Watch
- Resistance: $64,088 — the 4H EMA200, the most immediately relevant dynamic resistance capping the recovery; a sustained close above here would significantly alter the short-term outlook.
- Resistance: $65,892 — daily EMA50, which has acted as a ceiling throughout the broader downtrend and would need to be reclaimed to suggest any meaningful trend reversal on the macro timeframe.
- Resistance: $63,500–$64,000 — prior consolidation range from mid-June that formed before the breakdown leg to $58,000; likely to attract heavy supply on any continued push higher.
- Support: $61,772–$62,150 — confluence of the 1H EMA50 and the daily/1H Bollinger Band midline; a retest of this zone would be the first test of the current recovery’s structural integrity.
- Support: $60,976–$61,031 — 1H EMA200 and 4H Bollinger Band midline cluster; loss of this zone on a closing basis would put the recovery thesis in serious doubt.
- Support: $58,800–$59,200 — the late-June swing low area; represents the key demand zone and last line of defense before deeper structural damage.
Momentum & On-Chain Signals
The 1-hour RSI at 59.75 is constructive, sitting in bullish territory without yet reaching overbought conditions, leaving room for additional upside in the short term. The 4-hour RSI at 66.45 is more extended and approaching the 70 overbought threshold, which warrants caution as a pullback or consolidation may be imminent before any continuation. The 4H MACD has crossed bullish and the histogram is printing positive bars, supporting the recovery narrative, though the daily MACD remains in negative territory with the signal line above — a full daily MACD crossover has not yet materialized. On the OBV front, the 1H OBV is curling upward from depressed levels, aligning with reports of $221 million in ETF inflows ending the 10-day outflow streak, suggesting cautious accumulation rather than aggressive distribution. Funding rates at 0.0100% across timeframes remain neutral-to-slightly-positive, reflecting a balanced positioning environment without excessive long crowding.
BTC Dominance & Market Sentiment
BTC dominance currently sits at 54.32%, having declined notably over the recent period, suggesting some tentative rotation into altcoins as the market stabilizes — though dominance remains elevated by historical standards, meaning Bitcoin is still the primary destination for risk capital entering the crypto space. USDT dominance at 8.18% remains relatively elevated, indicating that a significant portion of market participants are still holding sideline liquidity rather than deploying aggressively into risk assets. The combination of elevated USDT.D and declining BTC.D could signal a transitional period where early altcoin rotation is underway but broader conviction remains limited.
Risk Scenarios
- Bullish case: A sustained 4-hour close above $64,088 (4H EMA200) on elevated volume would confirm the recovery is more than a short-covering bounce, opening a path toward $65,892 (daily EMA50) and potentially the $67,000–$68,000 range. Continued ETF inflows and further dovish signals from the Federal Reserve would serve as the fundamental catalysts required to drive this scenario.
- Bearish case: Failure to hold the $61,031–$61,360 support cluster on a 4-hour closing basis would signal that the current recovery is exhausted, risking a retest of the $58,800 swing lows. A breakdown below $58,800 with volume would constitute a significant structural failure, exposing the $55,000–$56,000 zone as the next major support.
Outlook
The near-term bias is cautiously bullish following a meaningful recovery from extreme oversold conditions and the end of a 10-day ETF outflow streak, but the macro structure remains bearish with price trading substantially below all major higher-timeframe EMAs. The critical trigger to watch over the next 24–48 hours is price behavior around the $63,500–$64,088 resistance cluster — acceptance above this zone would significantly improve the recovery case, while rejection here would likely produce a consolidation or pullback toward the $61,000–$62,000 range. The daily EMA20 at $62,201 is the immediate pivot: bulls need this level to hold on any intraday dips to maintain the short-term upward structure. Overall, this setup is best characterized as a potential accumulation bottom in early formation, but confirmation requires substantially more evidence before a trend reversal call can be made with confidence.
Disclaimer: This analysis is for informational purposes only and does not constitute financial advice. Cryptocurrency markets are highly volatile and unpredictable. All trading decisions should be made based on your own research and risk tolerance. Block Digest is not responsible for any financial losses incurred as a result of acting on this content.
Stay Ahead of the Market
Follow BlockDigest for crypto market intelligence, research and real-time updates.


