
Market Overview
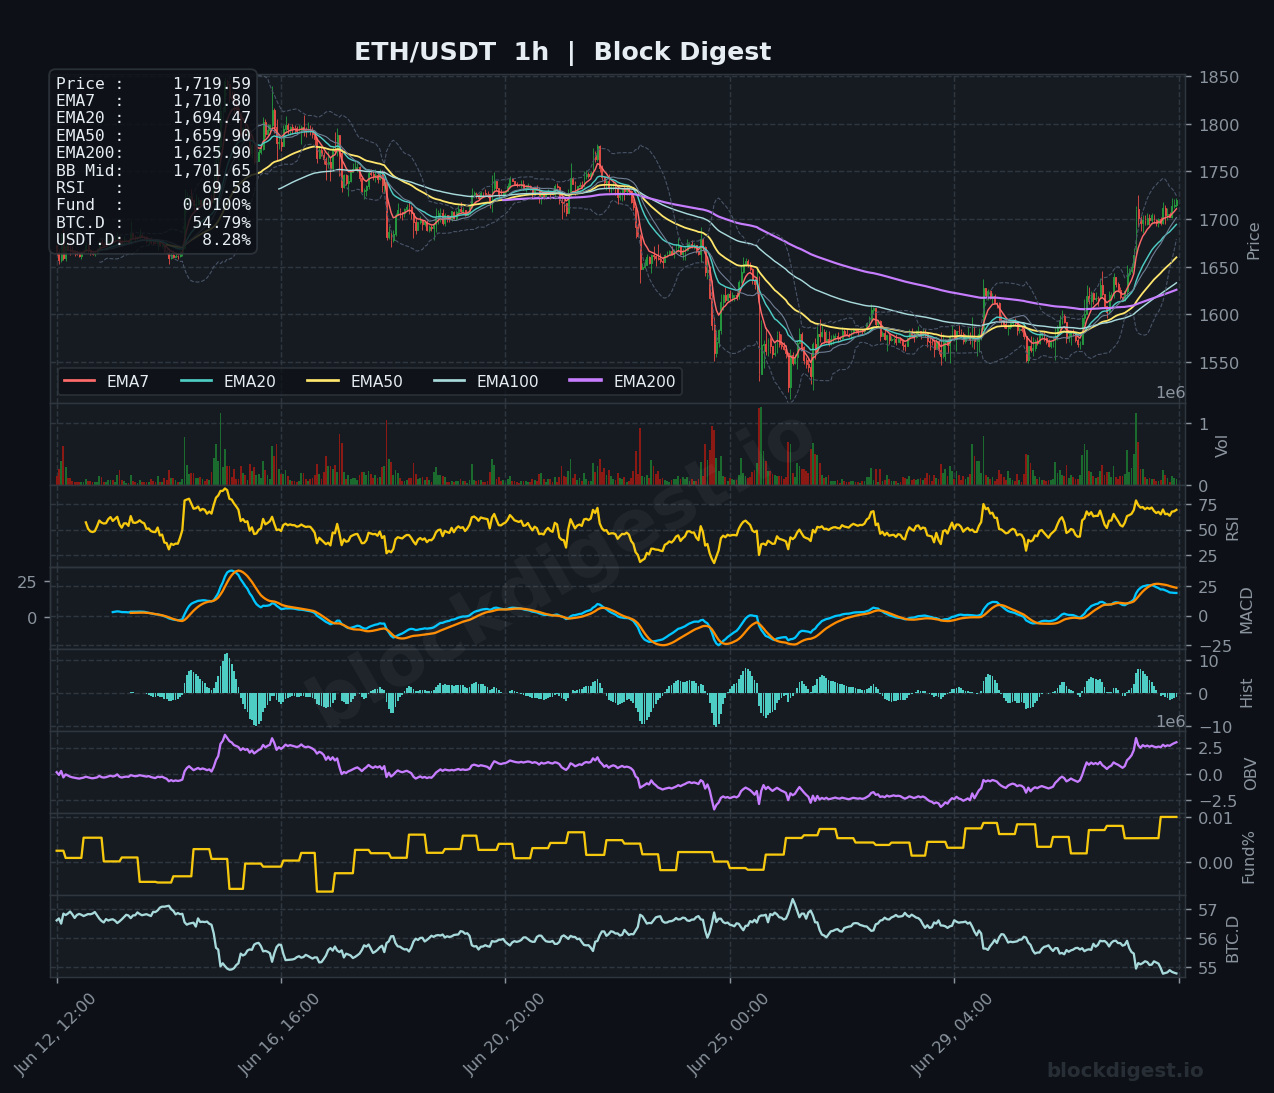
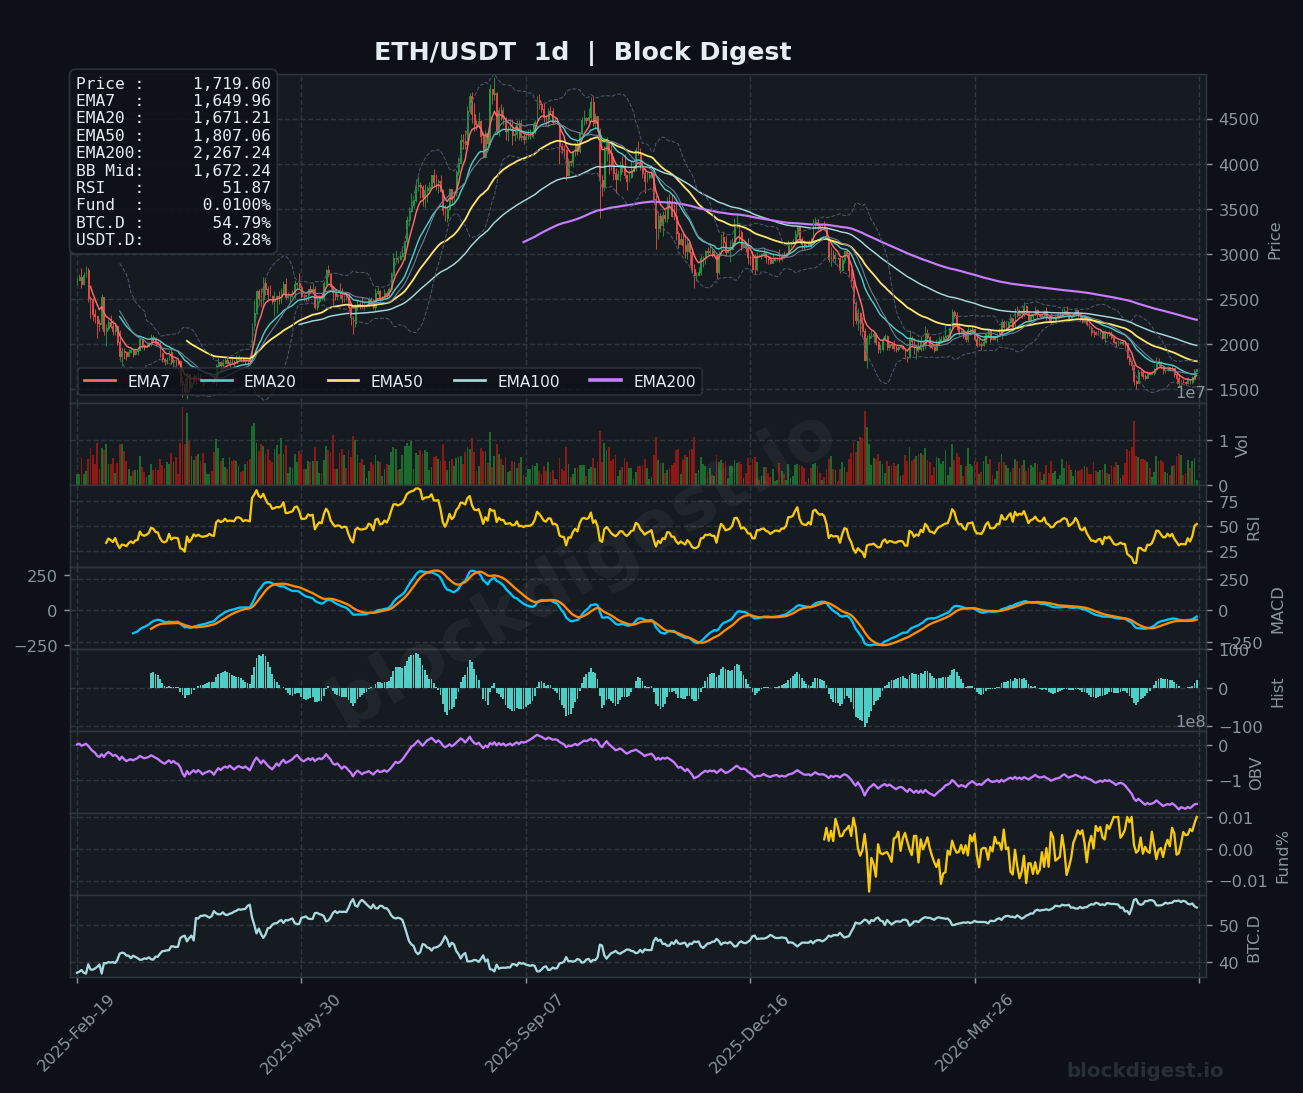
Ethereum is trading at $1,719.60, posting a sharp 5.38% single-day gain that has pushed price decisively above the 1-hour and 4-hour short-term EMAs in a broad short-squeeze rally. On the 1-hour chart, ETH has reclaimed all key intraday EMAs — with price sitting above the EMA7 ($1,710.80), EMA20 ($1,694.47), EMA50 ($1,659.90), and EMA200 ($1,625.90) — signaling a clean bullish stack on the lower timeframe. The Bollinger Band midline on the daily sits at $1,672.24, and today’s candle has broken above it for the first time in several weeks, a structurally meaningful development. Despite the intraday strength, the daily chart remains in a macro downtrend, with price still well below the daily EMA50 ($1,807.06) and EMA200 ($2,267.24), contextualizing this rally as a recovery attempt within a broader bearish structure.
Multi-Timeframe Confluence
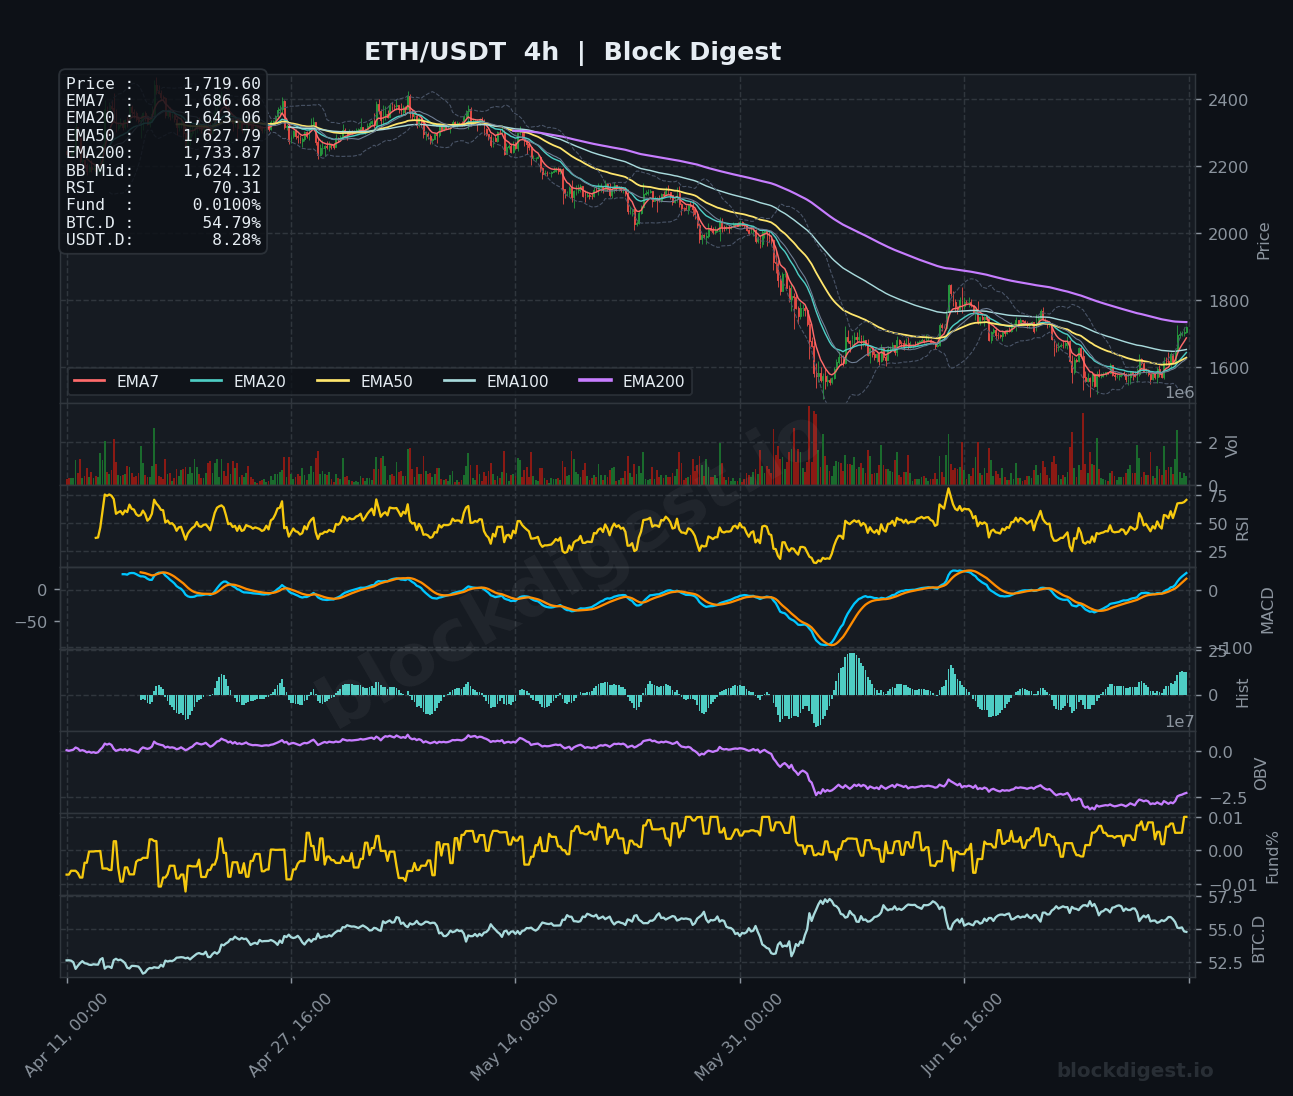
On the 1-hour timeframe, EMAs have fully bullishly aligned, with price printing a fresh local high near $1,720 and holding above the Bollinger Band midline at $1,701.65 — a constructive sign for intraday momentum. The 4-hour chart tells a similarly improving story: price has broken above the EMA7 ($1,686.68), EMA20 ($1,643.06), and EMA50 ($1,627.79), though the declining 4H EMA200 at $1,733.87 looms as the next critical resistance overhead. The daily chart diverges meaningfully — while the short-term structure is turning bullish, all major daily EMAs (EMA50 at $1,807.06, EMA200 at $2,267.24) remain well above current price, capping the macro recovery thesis. The $1,720–$1,735 zone, where the 4H EMA200 intersects, represents the first major test of whether this rally carries genuine follow-through.
Key Levels to Watch
- Resistance: $1,733.87 — The 4-hour EMA200, the single most important overhead barrier on the intermediate timeframe; a clean daily close above this level would mark a structural shift.
- Resistance: $1,807.06 — The daily EMA50, which has acted as a ceiling throughout the macro downtrend; reclaiming this would invalidate the prevailing bearish trend structure.
- Resistance: $1,800–$1,820 — Prior consolidation zone and psychological round number cluster that aligned with significant selling pressure in recent months.
- Support: $1,672.24 — The daily Bollinger Band midline; a re-test and hold here would confirm the breakout and serve as a higher-low structure.
- Support: $1,625.90–$1,643.06 — Confluence of the 1H EMA200 and 4H EMA20; this zone must hold on any pullback to preserve the short-term bullish structure.
- Support: $1,560–$1,580 — Recent swing lows and lower Bollinger Band support on the 4H; a break here would signal the rally has fully failed.
Momentum & On-Chain Signals
The 1-hour RSI at 69.58 and the 4-hour RSI at 70.31 are both approaching overbought territory, suggesting the immediate-term momentum is stretched and a brief consolidation or pullback is probable before a sustained continuation. The daily RSI has recovered to 51.87, moving back above the neutral 50 line for the first time in weeks — a meaningful regime shift on the higher timeframe. The MACD on both the 1H and 4H has made a decisive bullish crossover, with rising histograms confirming building momentum; the daily MACD remains in negative territory but the signal line gap is narrowing. OBV on the 1-hour chart has surged sharply alongside today’s move, indicating genuine volume-backed accumulation rather than a low-conviction spike, though the 4-hour OBV remains in a longer-term downtrend, warranting caution about sustained institutional commitment.
BTC Dominance & Market Sentiment
BTC dominance is currently sitting at 54.79% — notably, the 1-hour chart shows BTC.D declining sharply during this rally, which is a classic sign of capital rotating into altcoins like ETH and confirms the outperformance suggested by ETH’s 5.38% gain versus BTC’s 1.97%. USDT.D at 8.28% remains relatively elevated, indicating that a meaningful portion of sidelined capital has not yet fully re-entered risk assets, which could provide additional fuel for ETH if sentiment continues to improve. The SEC/CFTC joint commodity designation removing ETH’s security classification ambiguity is a fundamental tailwind that could sustain above-average inflows into ETH-specific products.
Risk Scenarios
- Bullish case: If ETH sustains above the 4H EMA200 at $1,733.87 on a closing basis and BTC.D continues its decline, the next logical target cluster is the $1,800–$1,807 zone where the daily EMA50 and prior resistance converge; a break there opens the door toward $1,900+.
- Bearish case: A failure to hold the $1,700 psychological level on a 4-hour close, combined with a reversal in BTC.D back above 55.5%, would suggest the move is an exhausted short squeeze and could see ETH retrace to the $1,625–$1,643 support confluence rapidly.
Outlook
The directional bias for the next 24–48 hours leans cautiously bullish, supported by the clean EMA realignment across lower timeframes, surging OBV on the 1-hour, improving daily RSI, and the fundamental catalyst of regulatory clarity reducing ETH’s legal risk premium. However, the $1,733.87 (4H EMA200) and $1,807.06 (daily EMA50) levels are critical gatekeepers — a failure to break through them with conviction would confirm this remains a bear market rally. Traders should watch for whether the 1H and 4H RSI can reset from near-overbought conditions through consolidation rather than a sharp selloff, which would be the healthiest continuation pattern. The macro daily structure remains bearish until proven otherwise; position sizing should reflect the reality that ETH is recovering within a downtrend, not leading a confirmed new bull leg.
Disclaimer: This analysis is for informational purposes only and does not constitute financial advice. Cryptocurrency markets are highly volatile and unpredictable. All trading decisions should be made based on your own research and risk tolerance. Block Digest is not responsible for any financial losses incurred as a result of acting on this content.
Stay Ahead of the Market
Follow BlockDigest for crypto market intelligence, research and real-time updates.


