
Market Overview
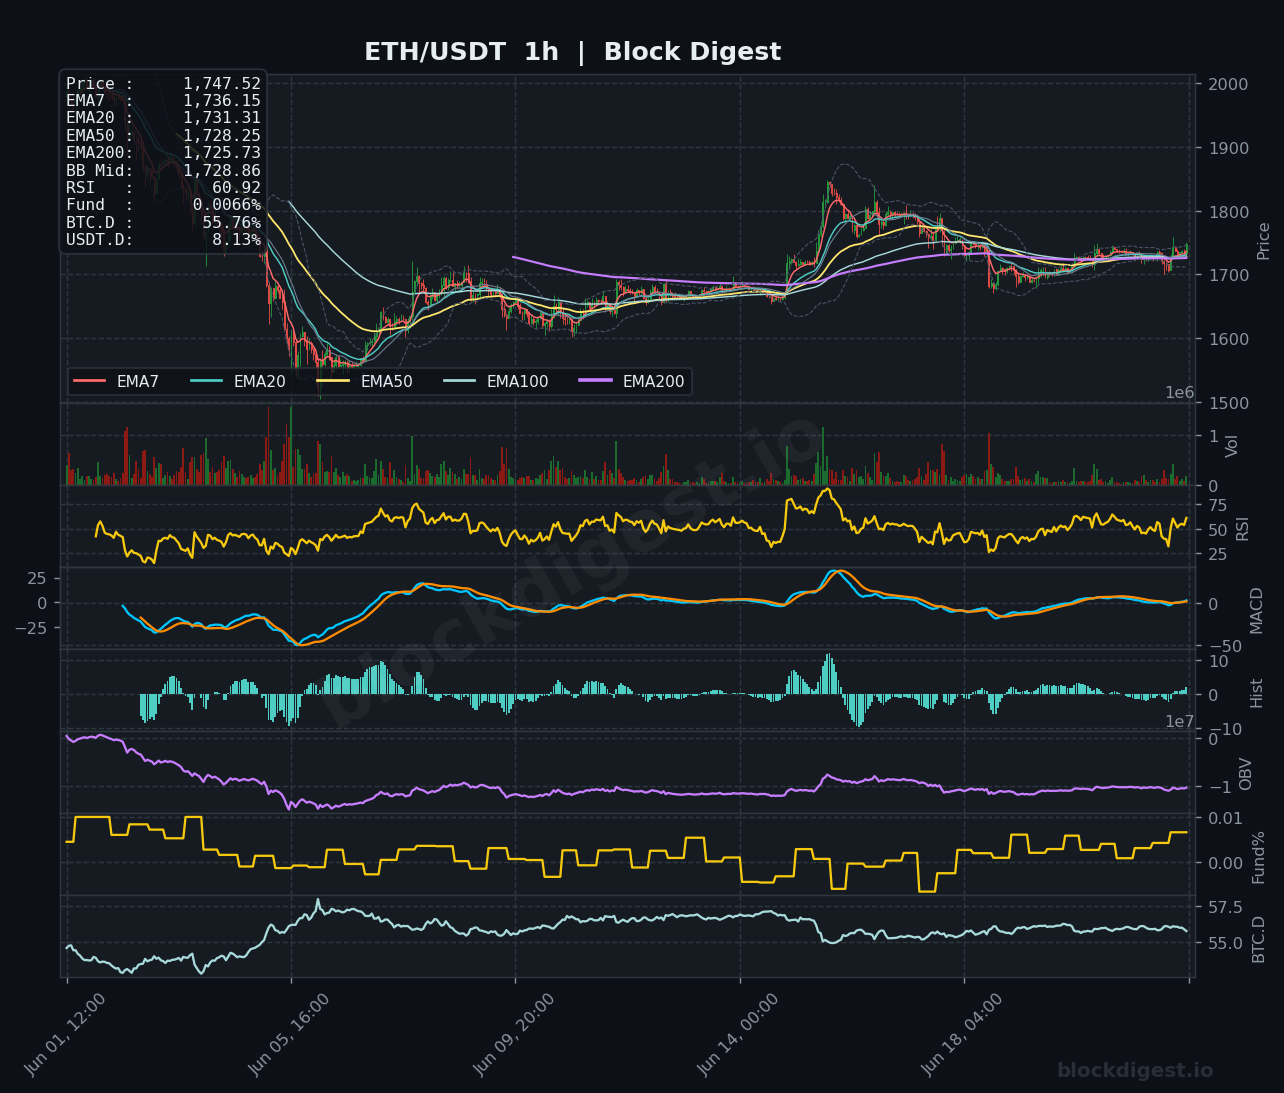
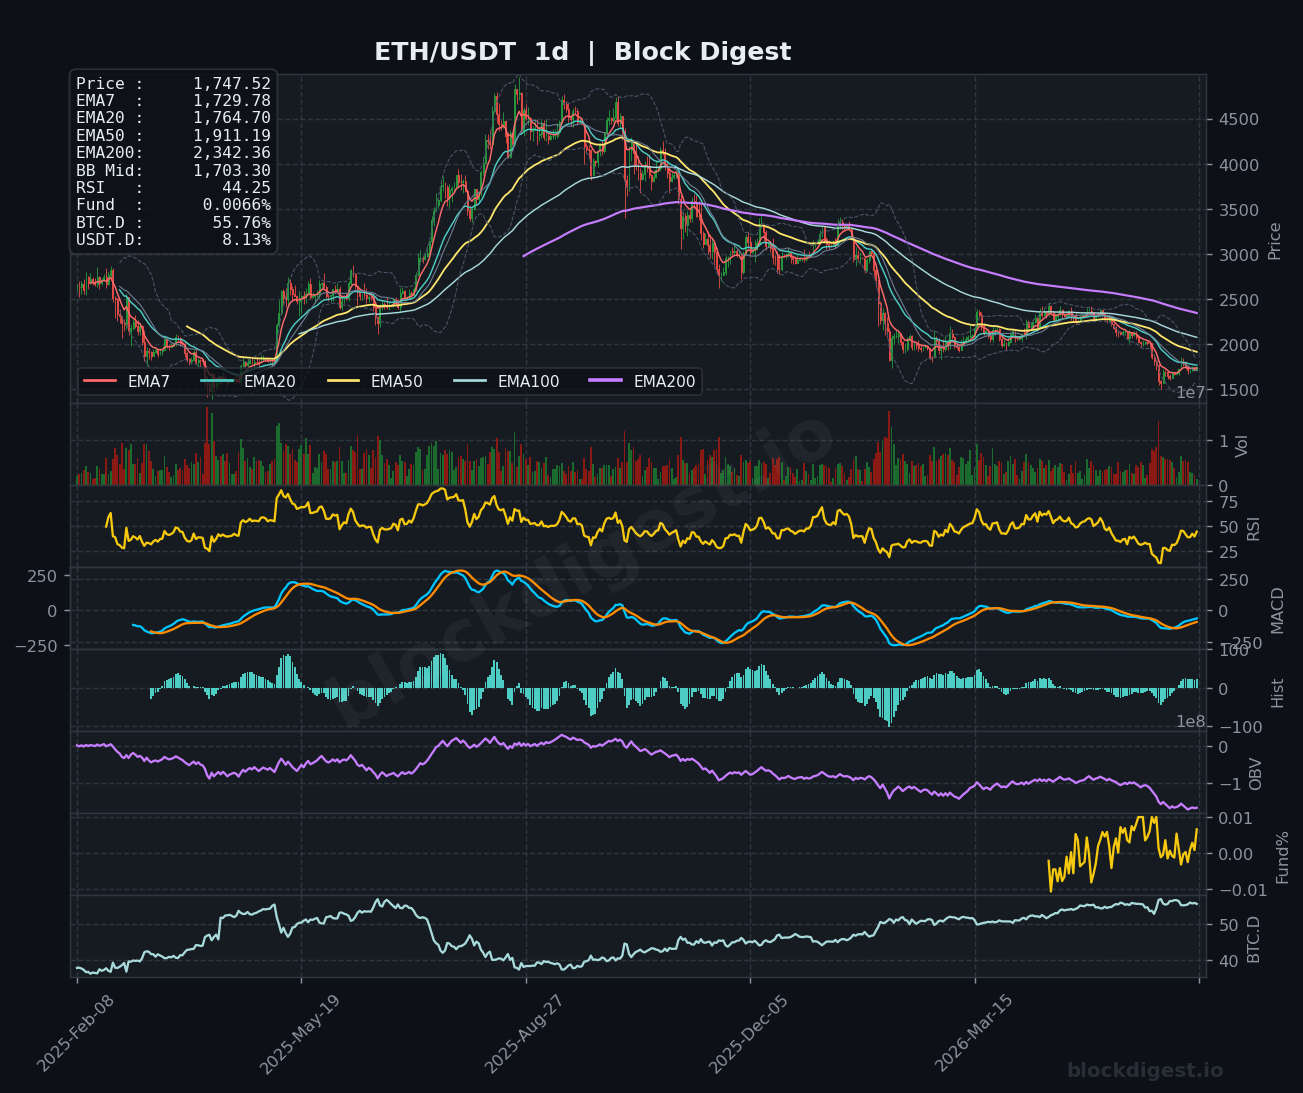
ETH/USDT is currently trading at $1,747.52, sitting in a structurally weak position on the daily timeframe despite a modest short-term recovery from recent lows. On the 1-hour chart, price has reclaimed all short-term EMAs — EMA7 ($1,736.15), EMA20 ($1,731.31), EMA50 ($1,728.25), and EMA200 ($1,725.73) — suggesting near-term bullish momentum has returned after a sharp post-spike consolidation. However, the daily chart tells a more cautionary story: price remains well below the daily EMA50 ($1,911.19) and the EMA200 ($2,342.36), confirming the macro downtrend remains firmly intact. The daily Bollinger Band midline sits at $1,703.30, and price is trading above it but has yet to demonstrate convincing breakout conviction.
Multi-Timeframe Confluence
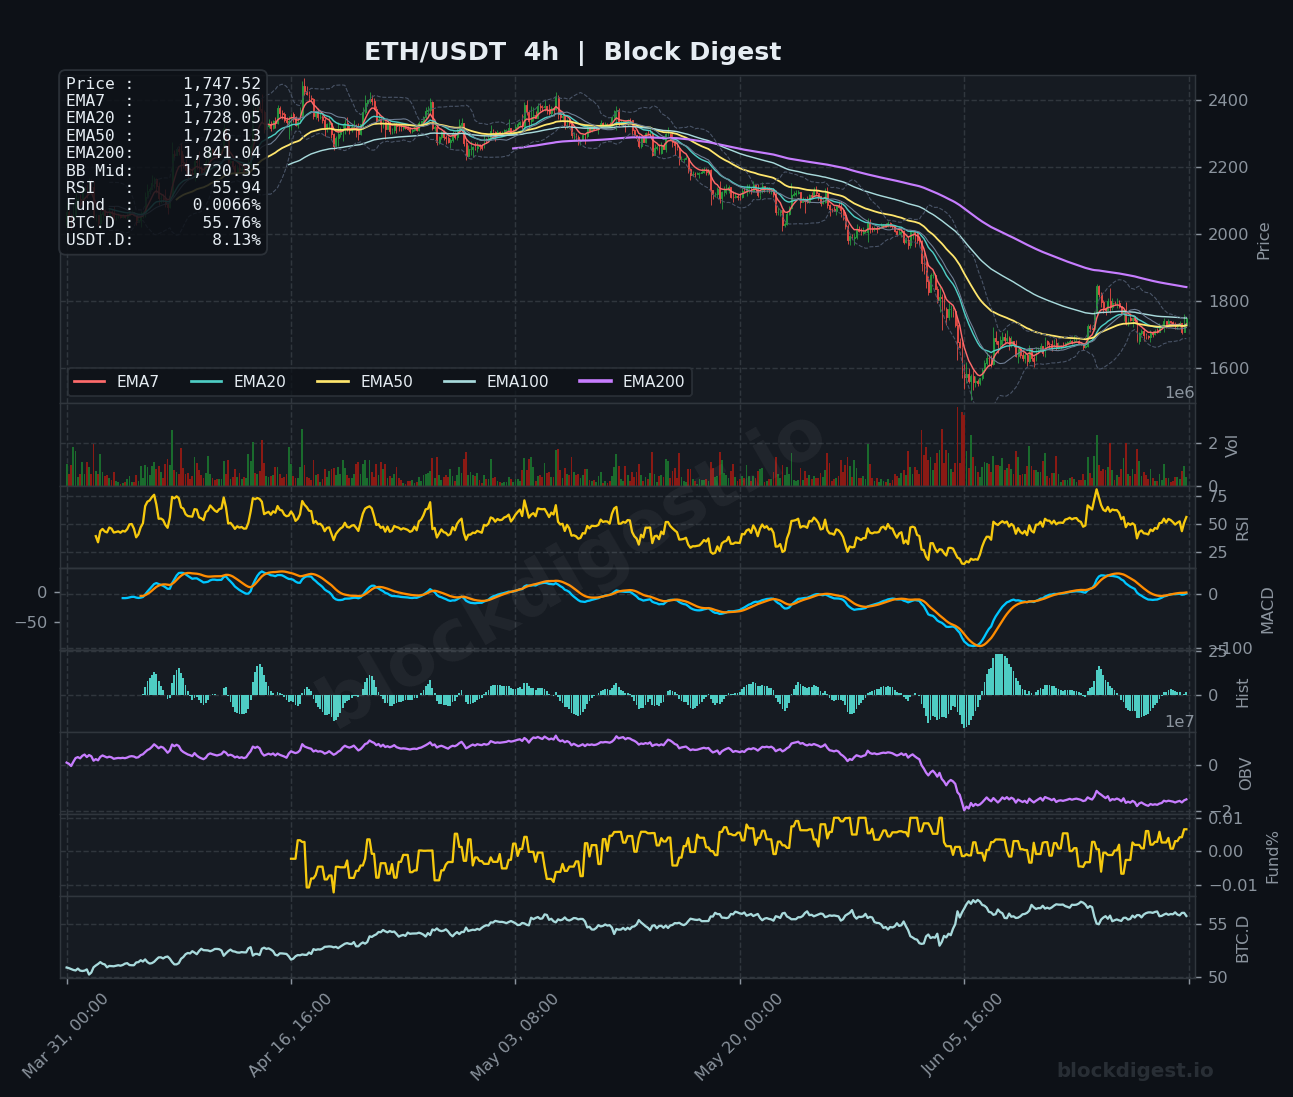
On the 1-hour chart, the tight EMA cluster between $1,725 and $1,736 represents immediate dynamic support, and price trading above all major short-term moving averages signals bullish short-term structure. The daily chart, however, shows price unable to reclaim the EMA20 ($1,764.70), which now acts as the nearest meaningful overhead resistance — a level that has repeatedly capped rallies in recent weeks. The macro picture remains bearish, as the daily EMA stack is negatively aligned with EMA7 below EMA20, which is far below the EMA50 and EMA200. Short-term momentum is attempting a recovery, but it directly contradicts the dominant higher-timeframe downtrend, making sustained upside challenging without a definitive catalyst.
Key Levels to Watch
- Resistance: $1,764.70 — Daily EMA20, the first major overhead barrier and a level that must be reclaimed to shift short-term daily structure bullish; $1,800 — psychological round number and approximate recent swing high from the mid-June spike, representing significant supply; $1,911.19 — Daily EMA50, reclaiming this level would mark a substantial structural shift and is the threshold for any meaningful medium-term recovery thesis.
- Support: $1,725–$1,728 — Confluence of the 1h EMA50 and EMA200, forming a short-term demand cluster; $1,703.30 — Daily Bollinger Band midline, a loss of this level would signal renewed selling pressure; $1,680–$1,700 — Recent structural lows and a key psychological zone; a breach here would expose ETH to another leg lower.
Momentum & On-Chain Signals
The 1-hour RSI at 60.92 reflects recovering momentum with room to extend toward overbought territory before hitting resistance, a mildly constructive near-term signal. On the daily timeframe, RSI sits at a more subdued 44.25 — below the neutral 50 line — confirming that macro momentum remains in bearish territory and the current bounce has not yet translated into a structural reversal. The daily MACD lines are converging near the zero line with a marginally positive histogram, suggesting early-stage momentum improvement, but no confirmed bullish crossover has materialized. OBV on the daily chart continues its multi-month declining trend, indicating persistent distribution pressure and that buy-side volume has not meaningfully stepped in to absorb selling.
BTC Dominance & Market Sentiment
BTC dominance currently reads 55.76%, a notably elevated level that reflects ongoing capital rotation favoring Bitcoin over altcoins, which structurally pressures ETH’s relative performance. USDT dominance at 8.13% indicates a meaningful portion of market capital remains sidelined in stablecoins, suggesting risk appetite across the broader crypto market has not fully returned. For ETH specifically, this environment implies headwinds for a sustained recovery — until BTC.D shows a confirmed rollover or USDT.D declines materially, altcoin upside remains capped.
Risk Scenarios
- Bullish case: A clean daily close above $1,764.70 (daily EMA20) accompanied by expanding volume and a 1h RSI holding above 55 would confirm bullish momentum continuation, with the next target being the $1,800 psychological level and ultimately a test of $1,911 (daily EMA50).
- Bearish case: Failure to hold the $1,725–$1,728 EMA cluster on the 1-hour chart, particularly on a daily close below $1,703 (BB midline), would signal the bounce has exhausted itself, reopening a path toward the $1,680–$1,650 support zone.
Outlook
ETH’s near-term setup is modestly constructive on the intraday timeframe, with price trading above a tightly clustered EMA stack and an RSI approaching 61 — but the macro context remains unambiguously bearish. The critical trigger to watch over the next 24–48 hours is whether price can convert a clean break above $1,764.70 into a sustained hold, which would be the minimum requirement to shift daily structure. Any rejection at the daily EMA20 paired with declining 1h RSI momentum would confirm this as a lower-high formation within the prevailing downtrend. Until daily OBV reverses and BTC.D shows meaningful rotation, the path of least resistance on higher timeframes remains to the downside, and bulls carry the burden of proof.
Disclaimer: This analysis is for informational purposes only and does not constitute financial advice. Cryptocurrency markets are highly volatile and unpredictable. All trading decisions should be made based on your own research and risk tolerance. Block Digest is not responsible for any financial losses incurred as a result of acting on this content.
Stay Ahead of the Market
Follow BlockDigest for crypto market intelligence, research and real-time updates.


