
Market Overview
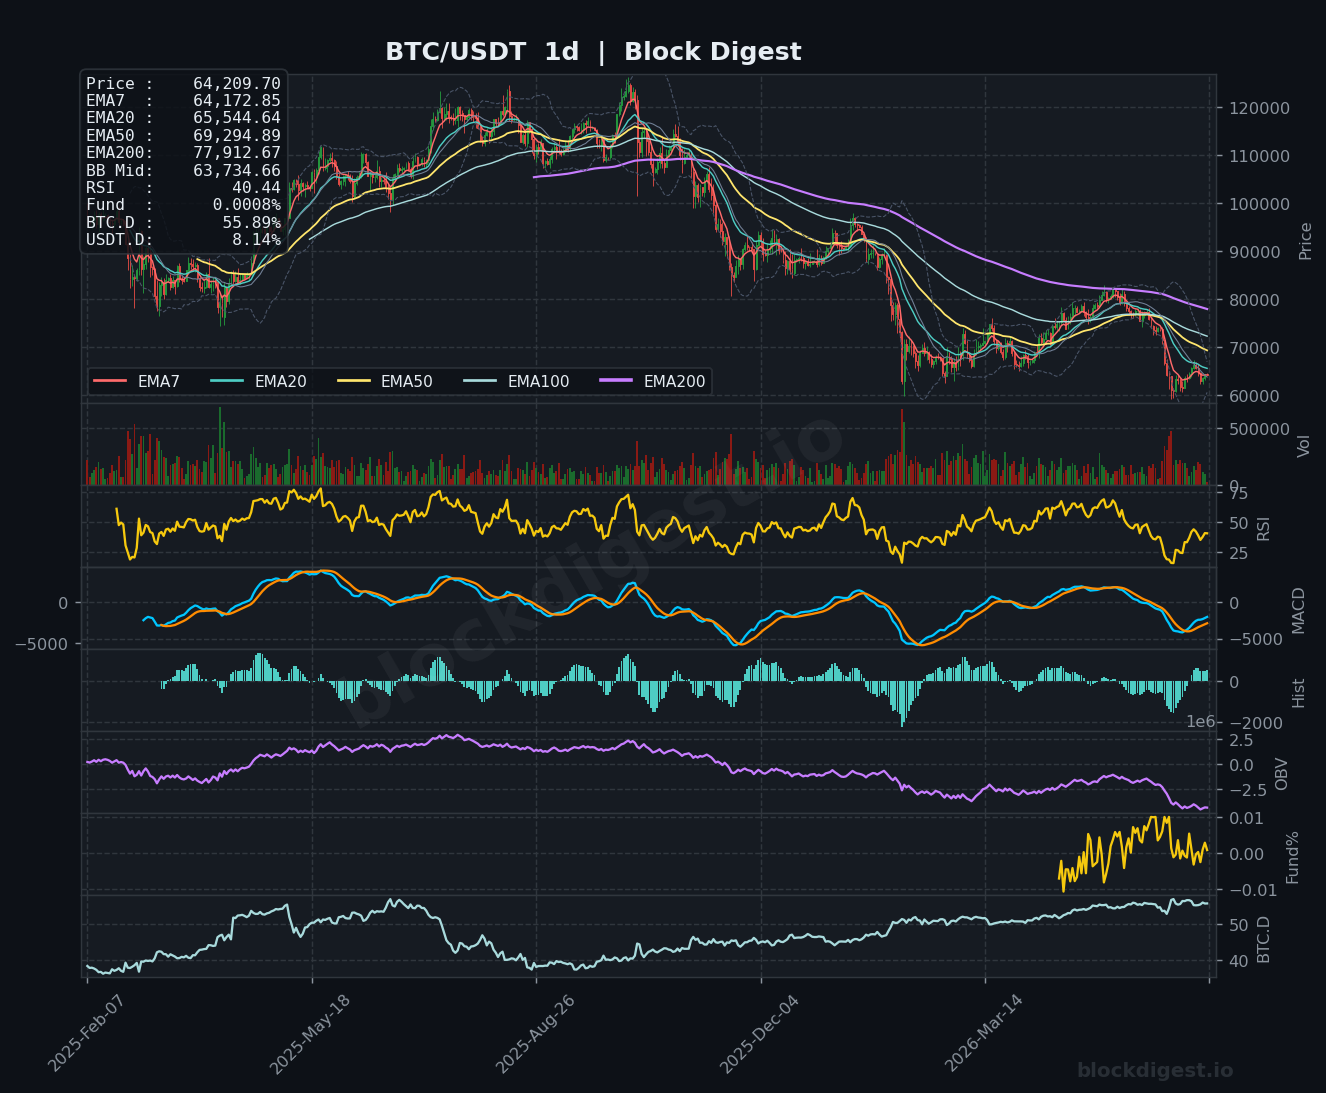
Bitcoin is currently trading at $64,209.80, navigating a technically precarious zone following a significant multi-month correction from highs near $109,000. On the daily timeframe, price sits below all major EMAs — the EMA20 at $65,544, EMA50 at $69,294, EMA200 at $77,912 — confirming a dominant bearish structure. Price is trading slightly above the daily Bollinger Band midline of $63,734, suggesting a tentative stabilization attempt, but the broader trend remains firmly downward with no confirmed structural reversal yet in place.
Multi-Timeframe Confluence
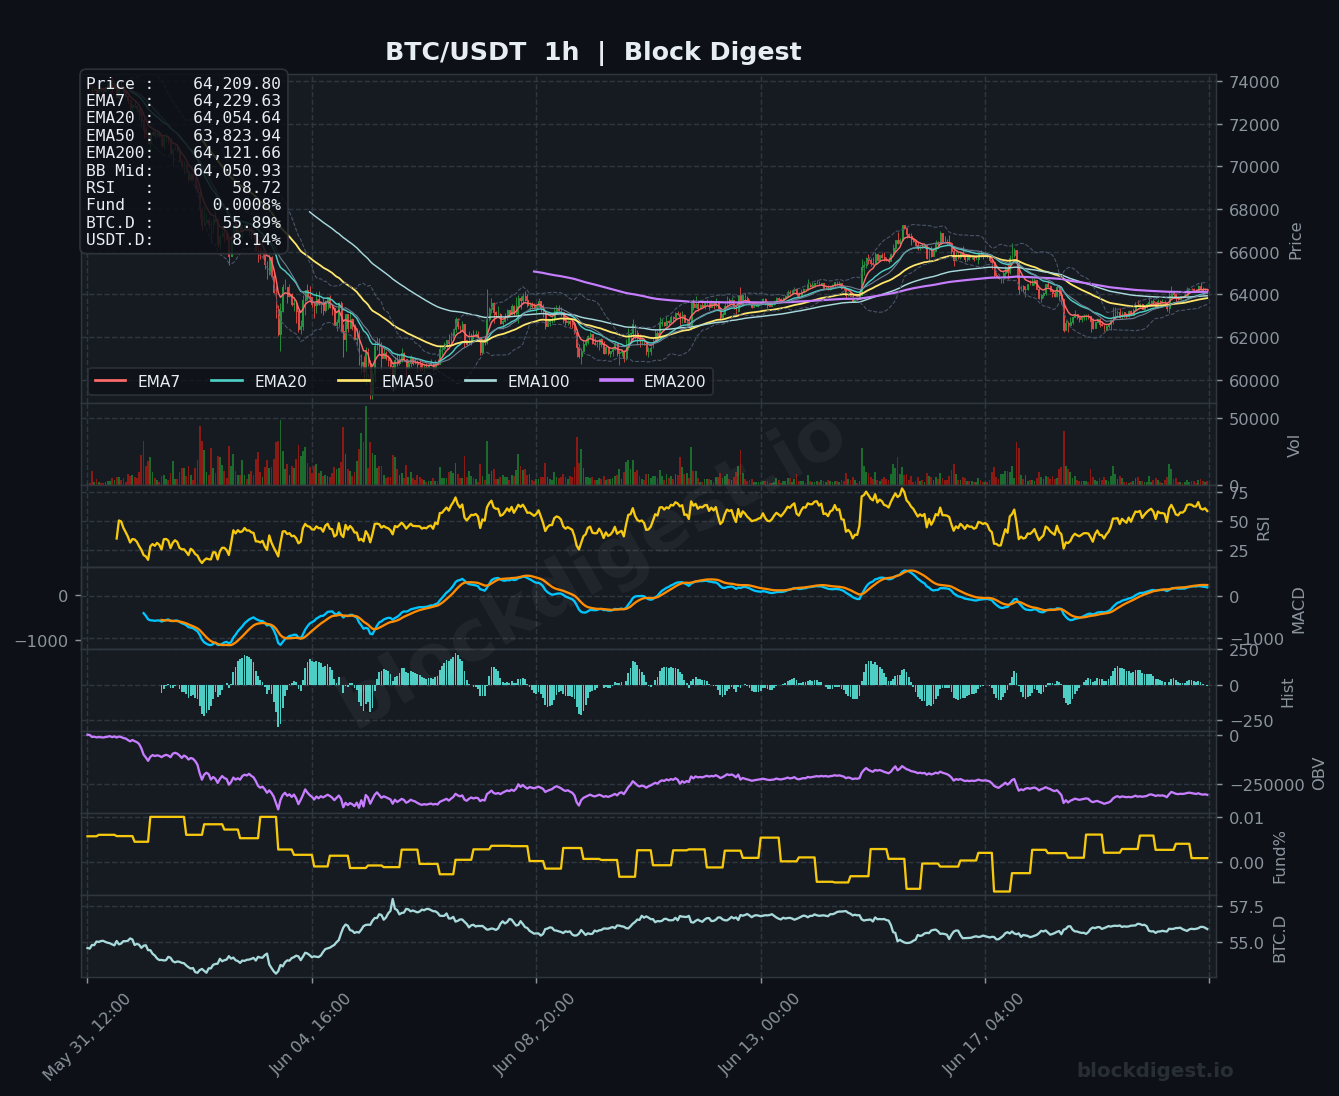
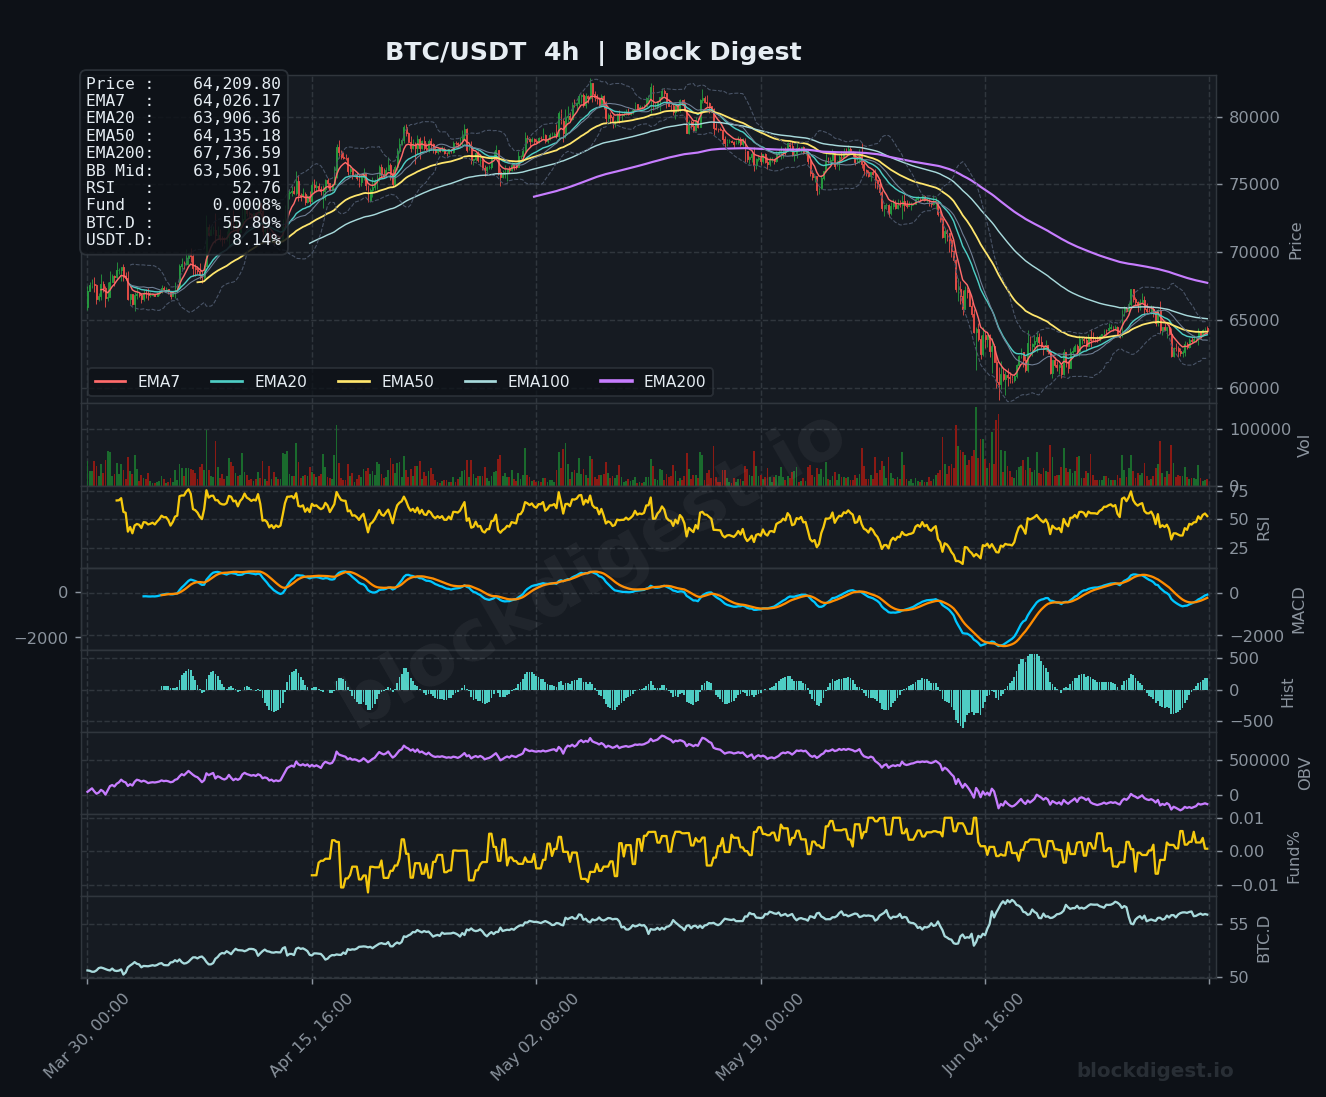
The 1-hour chart offers a marginally more constructive short-term picture, with price sitting just above EMA200 ($64,121) and EMA20 ($64,054), indicating short-term consolidation within a tight range near the $64,200 area. The 4-hour chart shows price above its EMA7 ($64,026) and EMA20 ($63,906) but critically remains below the EMA200 at $67,736, reinforcing the medium-term bearish bias. All three timeframes converge around the $63,500–$64,200 zone as the decisive battleground — a close below this cluster on the daily would be a significant bearish development, while holding it offers the basis for a potential relief bounce toward higher EMAs.
Key Levels to Watch
- Resistance: $65,544 — Daily EMA20, the first meaningful overhead obstacle and a level that capped recent recovery attempts
- Resistance: $67,736 — 4H EMA200, a major structural barrier; reclaiming this would meaningfully shift intermediate-term sentiment
- Resistance: $69,294 — Daily EMA50, a level that has not been reclaimed since the macro downtrend accelerated; key for any genuine trend reversal thesis
- Support: $63,734 — Daily Bollinger Band midline, currently acting as near-term dynamic support; a daily close below this level would open downside
- Support: $63,507 — 4H Bollinger Band midline, a secondary intraday support cluster aligning with recent consolidation lows
- Support: $61,000–$62,000 — Lower Bollinger Band region on the daily; a breakdown below $63,500 would target this zone as the next meaningful demand area
Momentum & On-Chain Signals
The RSI divergence across timeframes is notable: the 1-hour RSI sits at 58.72 (mildly bullish short-term), the 4-hour RSI is at 52.76 (neutral), while the daily RSI has dropped to 40.44 — approaching oversold territory but not yet at levels historically associated with major bottoms in BTC cycles. The 4-hour MACD lines are converging near zero with a slightly positive histogram, suggesting nascent bullish momentum on that timeframe, but the daily MACD remains in negative territory with lines still diverged bearishly. OBV on both the 4-hour and daily charts is trending downward, reflecting persistent distribution and a lack of meaningful accumulation — this is a key bearish signal that undermines short-term recovery narratives. Funding rates remain mildly positive at 0.0008%, indicating slight long bias without excessive leverage buildup, which limits immediate liquidation cascade risk.
BTC Dominance & Market Sentiment
BTC dominance stands at 55.89%, a relatively elevated level reflecting continued capital concentration in Bitcoin versus altcoins, which typically signals a risk-off posture within crypto markets. USDT dominance at 8.14% remains elevated, indicating that a significant portion of market participants remains in stablecoins — a cautious stance that has not yet converted into aggressive BTC buying. Together, these readings suggest the market is in a defensive equilibrium rather than a risk-on rotation, with altcoins bearing the brunt of broader de-risking.
Risk Scenarios
- Bullish case: A decisive daily close above $65,544 (daily EMA20) with increasing volume and a positive OBV turn would suggest short-term trend recovery is underway, with an initial target toward $67,736 and potentially $69,294 on extended momentum.
- Bearish case: A breakdown and daily close below $63,500 — losing the Bollinger Band midline and key short-term EMA cluster — would expose BTC to a swift move toward the $61,000–$62,000 lower band support, with deeper macro risk if that zone fails.
Outlook
The directional bias over the next 24–48 hours leans cautiously bearish on a higher-timeframe basis, given the confirmed downtrend on the daily, declining OBV, and price trading below all major daily EMAs. However, the short-term compression between $63,500 and $65,500 warrants close monitoring for a resolution — a breakout in either direction from this range will likely set the tone for the week ahead. The critical level that would materially change the bearish thesis is a confirmed reclaim of the daily EMA20 at $65,544, while a loss of $63,500 support would accelerate near-term downside risk. Until price demonstrates a sustained move above $65,544 with improved OBV momentum, any bounces should be treated as relief rallies within a larger corrective structure.
Disclaimer: This analysis is for informational purposes only and does not constitute financial advice. Cryptocurrency markets are highly volatile and unpredictable. All trading decisions should be made based on your own research and risk tolerance. Block Digest is not responsible for any financial losses incurred as a result of acting on this content.
Stay Ahead of the Market
Follow BlockDigest for crypto market intelligence, research and real-time updates.


