
Market Overview
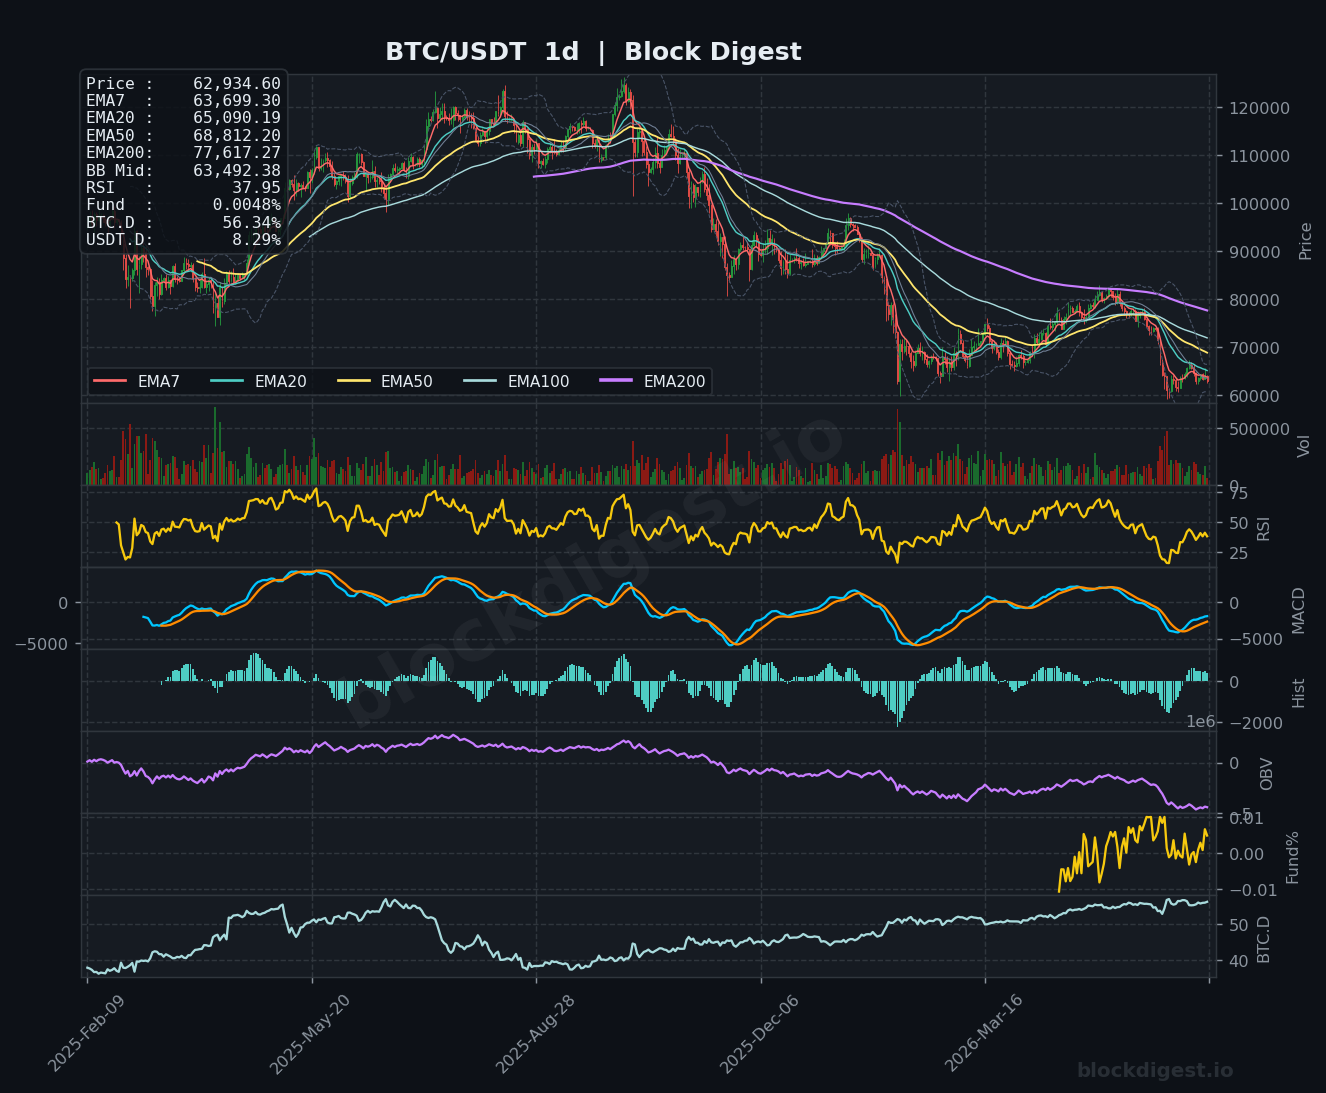
Bitcoin is currently trading at $62,934.70, sitting below all major EMAs across the daily timeframe — EMA7 ($63,699), EMA20 ($65,090), EMA50 ($68,812), and EMA200 ($77,617) — confirming a structurally bearish macro backdrop. Price has broken down significantly from the cycle highs and is now trading near the lower Bollinger Band on the daily chart, with the BB midline at $63,492 acting as immediate overhead resistance. The dominant daily trend remains bearish, marked by a sustained sequence of lower highs and lower lows since the cycle peak, with the current price level representing a critical test of whether buyers can establish a credible demand zone or whether distribution continues.
Multi-Timeframe Confluence
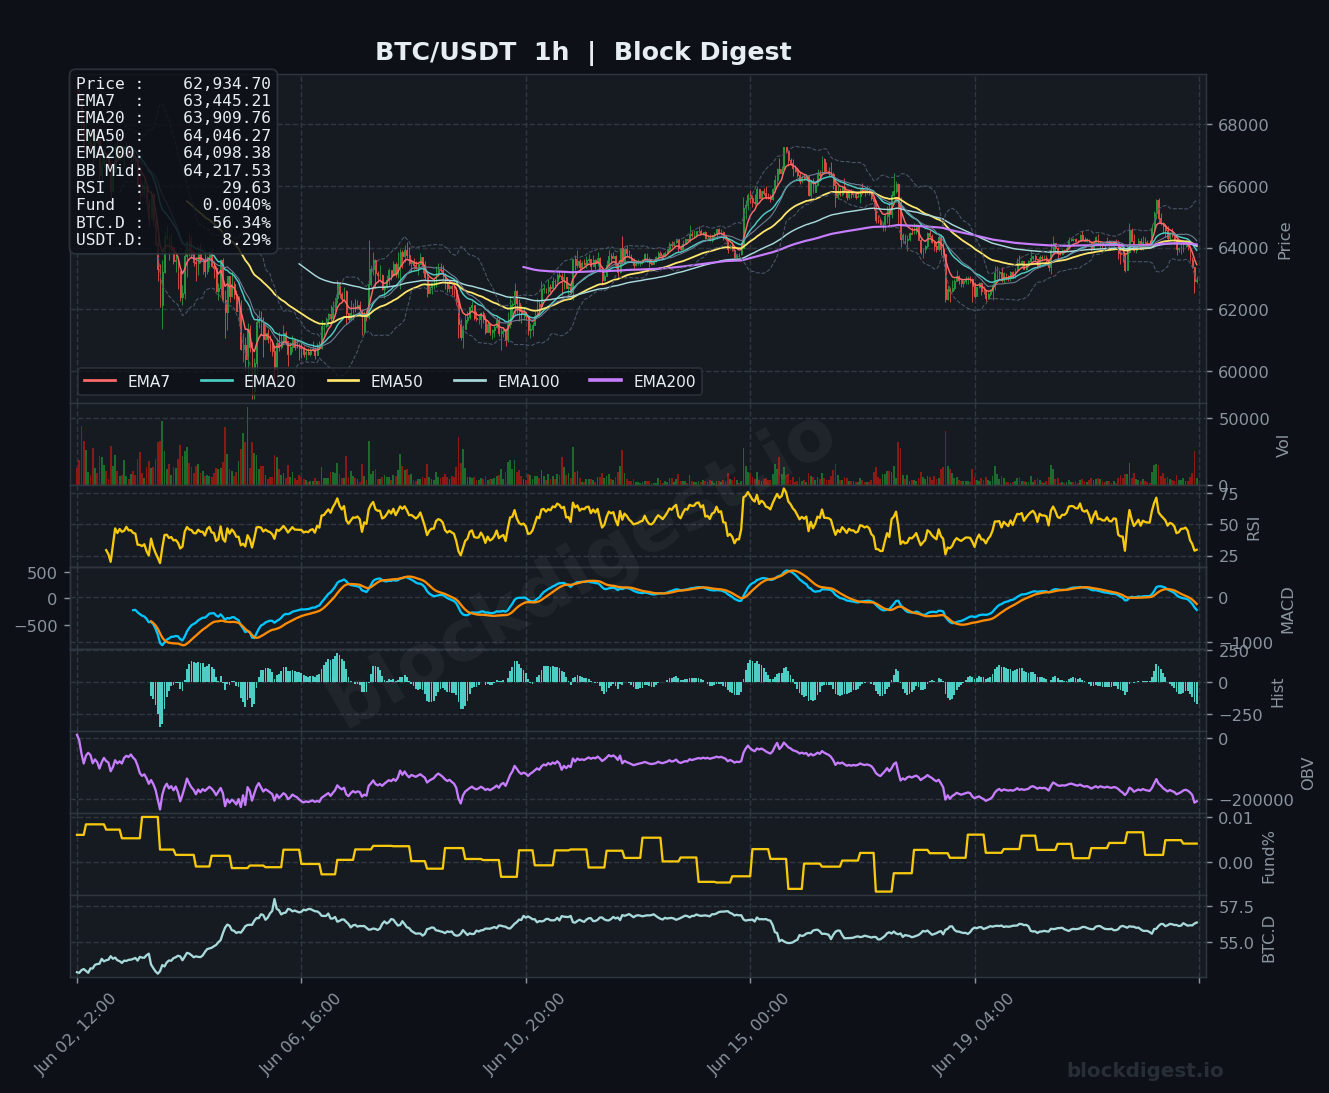
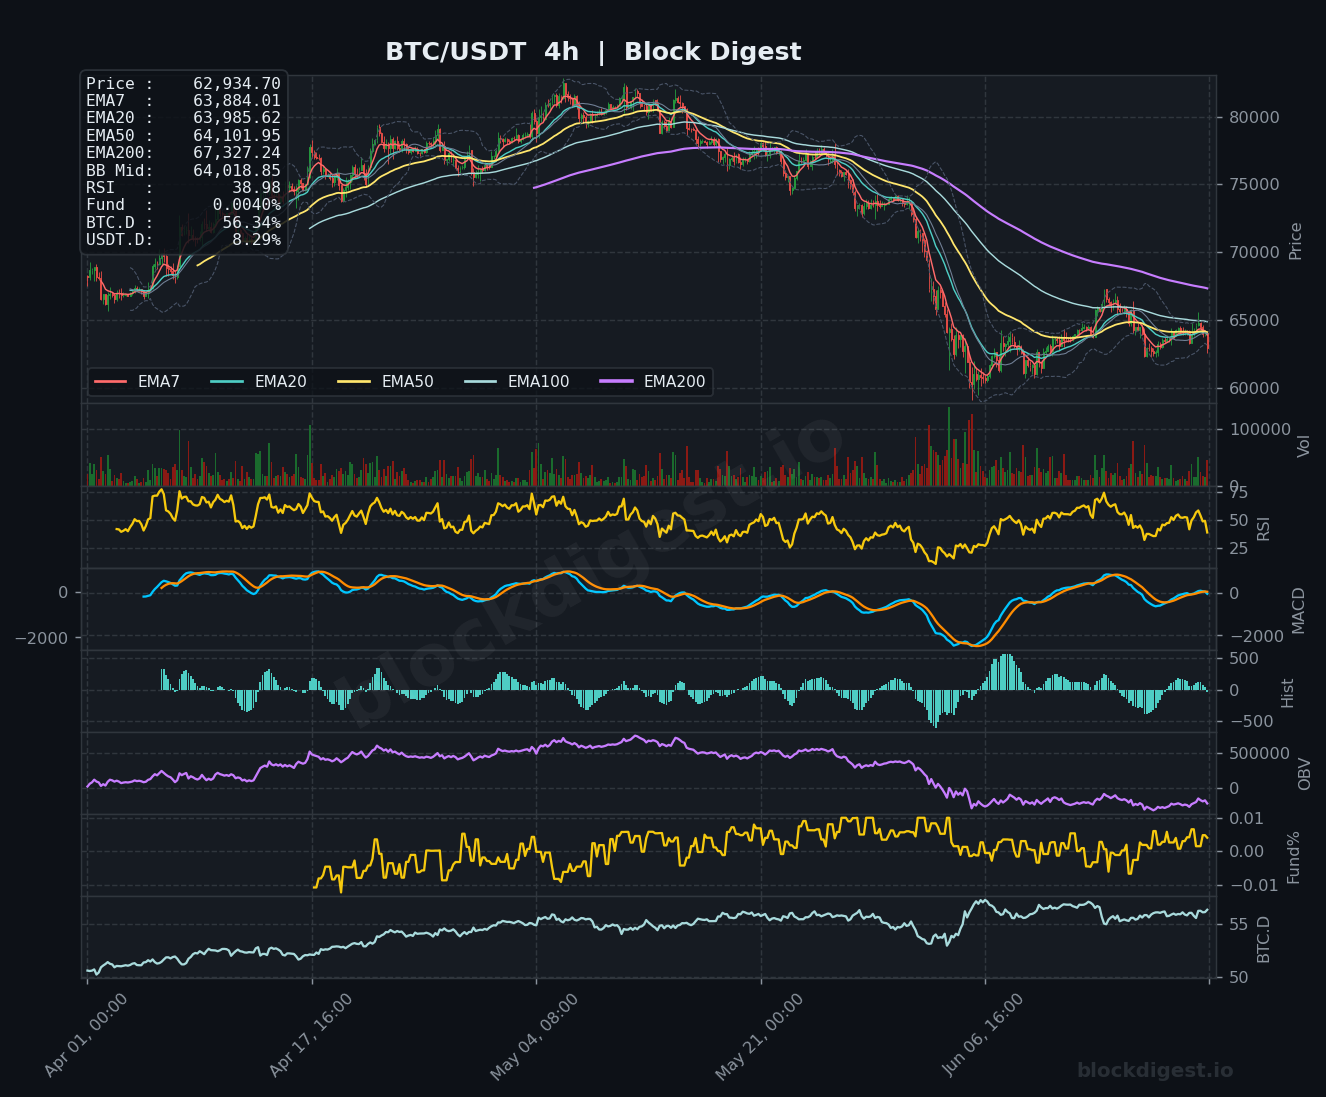
Across all three timeframes, the EMA stack is in a bearish configuration, with short-term EMAs trading below the longer-term ones on both the 4h and 1d charts — a classic sign of sustained selling pressure rather than a corrective pullback. On the 1h chart, price is trading below EMA7 ($63,445), EMA20 ($63,909), EMA50 ($64,046), and EMA200 ($64,098), with all four EMAs clustered tightly between $63,445 and $64,098, creating a dense overhead resistance zone. The 4h chart reinforces this picture, with the EMA200 sitting far above at $67,327, and short-term EMAs beginning to compress in the $63,884–$64,101 range — aligning closely with the 1h overhead cluster and suggesting strong confluent resistance around the $63,900–$64,100 zone. Short-term momentum on the 1h has shown modest stabilization attempts, but these lack the follow-through needed to meaningfully challenge the bearish higher-timeframe structure.
Key Levels to Watch
- Resistance: $63,900–$64,100 — dense EMA cluster (EMA7/20/50/200) on the 1h and 4h timeframes; a clean rejection zone and the first major hurdle for any recovery attempt
- Resistance: $65,090 — daily EMA20, which has capped several bounce attempts in recent weeks and represents a more meaningful structural recovery level
- Resistance: $67,327 — 4h EMA200, a significant macro resistance that would need to be reclaimed to shift the intermediate-term bias back to neutral
- Support: $62,000–$62,500 — recent swing low zone visible on the 1h chart; short-term demand area that bulls need to defend to prevent accelerated selling
- Support: $60,000 — psychological round number and a historically significant level that would likely attract attention on any deeper flush
- Support: $58,500–$59,000 — structural support derived from prior consolidation on the daily chart; a break here would signal a more serious trend deterioration
Momentum & On-Chain Signals
The RSI readings are deeply subdued across all timeframes: 29.63 on the 1h, 38.98 on the 4h, and 37.95 on the daily — placing the 1h in oversold territory and both higher timeframes in bearish momentum territory without yet reaching extreme oversold levels. The MACD on the 4h is showing early signs of a potential bullish histogram contraction, suggesting the rate of decline may be slowing, though no confirmed crossover has occurred. The OBV on both the 4h and daily charts is trending decisively lower, confirming that volume is flowing out of BTC — a distribution signal consistent with the bearish price structure. Funding rates remain near-neutral at +0.0040%–0.0048%, indicating the derivatives market has not built up a meaningful long or short bias, which leaves room for a short-squeeze but also removes a contrarian catalyst from the immediate picture.
BTC Dominance & Market Sentiment
BTC Dominance sits at 56.34%, a historically elevated reading that reflects continued capital rotation away from altcoins and into BTC relative safety — though this has not translated into price support for BTC itself, suggesting broad risk-off conditions across the entire crypto market. USDT Dominance at 8.29% confirms significant sidelined capital, which could become a meaningful tailwind if sentiment shifts, but currently represents a market in “wait and see” mode rather than active accumulation. The combination of high BTC.D and elevated USDT.D historically precedes either a sharp capitulation or a rapid recovery — the market is at an inflection point.
Risk Scenarios
- Bullish case: A sustained reclaim of the $63,900–$64,100 EMA cluster on the 1h and 4h, confirmed by rising OBV and RSI moving back above 50 on the 4h, would open a path toward the daily EMA20 at $65,090 and potentially $67,000 in the near term.
- Bearish case: Failure to hold the $62,000–$62,500 support zone with renewed selling volume would likely accelerate downside toward $60,000, and a close below that level on the daily would bring $58,500 into scope as the next meaningful structural target.
Outlook
The current setup is cautiously bearish with oversold short-term conditions creating the potential for a relief bounce, but the macro structure remains firmly bearish with price below all major EMAs on the daily. The $63,900–$64,100 zone is the critical near-term test — how price reacts to this overhead cluster in the next 24–48 hours will determine whether a more meaningful recovery attempt develops or whether the market rolls over for another leg lower. A decisive 4h close above $64,100 with volume expansion would shift the short-term bias to cautiously neutral; conversely, a loss of $62,000 would invalidate any near-term bullish thesis. Traders should prioritize risk management in this environment given the lack of trend confirmation in either direction.
Disclaimer: This analysis is for informational purposes only and does not constitute financial advice. Cryptocurrency markets are highly volatile and unpredictable. All trading decisions should be made based on your own research and risk tolerance. Block Digest is not responsible for any financial losses incurred as a result of acting on this content.
Stay Ahead of the Market
Follow BlockDigest for crypto market intelligence, research and real-time updates.


