
Market Overview
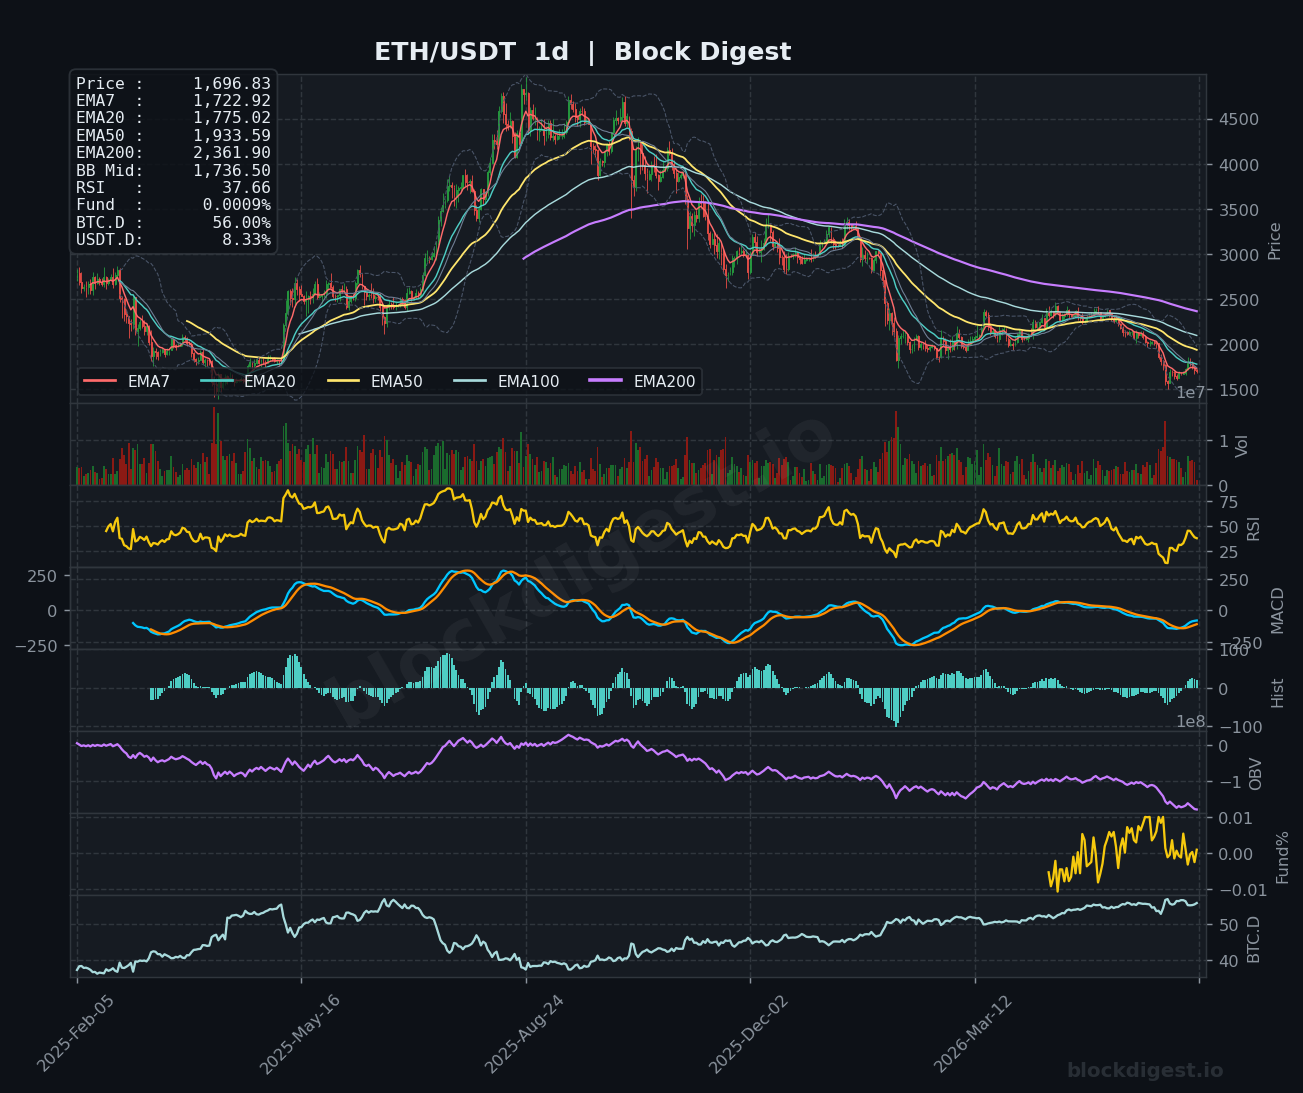
ETH/USDT is currently trading at $1,696.83, positioned well beneath every key moving average across all timeframes — a structurally bearish configuration. On the daily chart, price sits below the EMA7 ($1,722.92), EMA20 ($1,775.02), EMA50 ($1,933.59), and the distant EMA200 ($2,361.90), confirming that the dominant trend remains firmly to the downside. The Bollinger Band midline on the daily sits at $1,736.50, and price is pressing into the lower half of the band, suggesting sustained selling pressure with no meaningful mean-reversion attempt underway. The broader structure on the daily timeframe reflects a prolonged distribution phase that has erased the majority of gains accumulated throughout 2025.
Multi-Timeframe Confluence
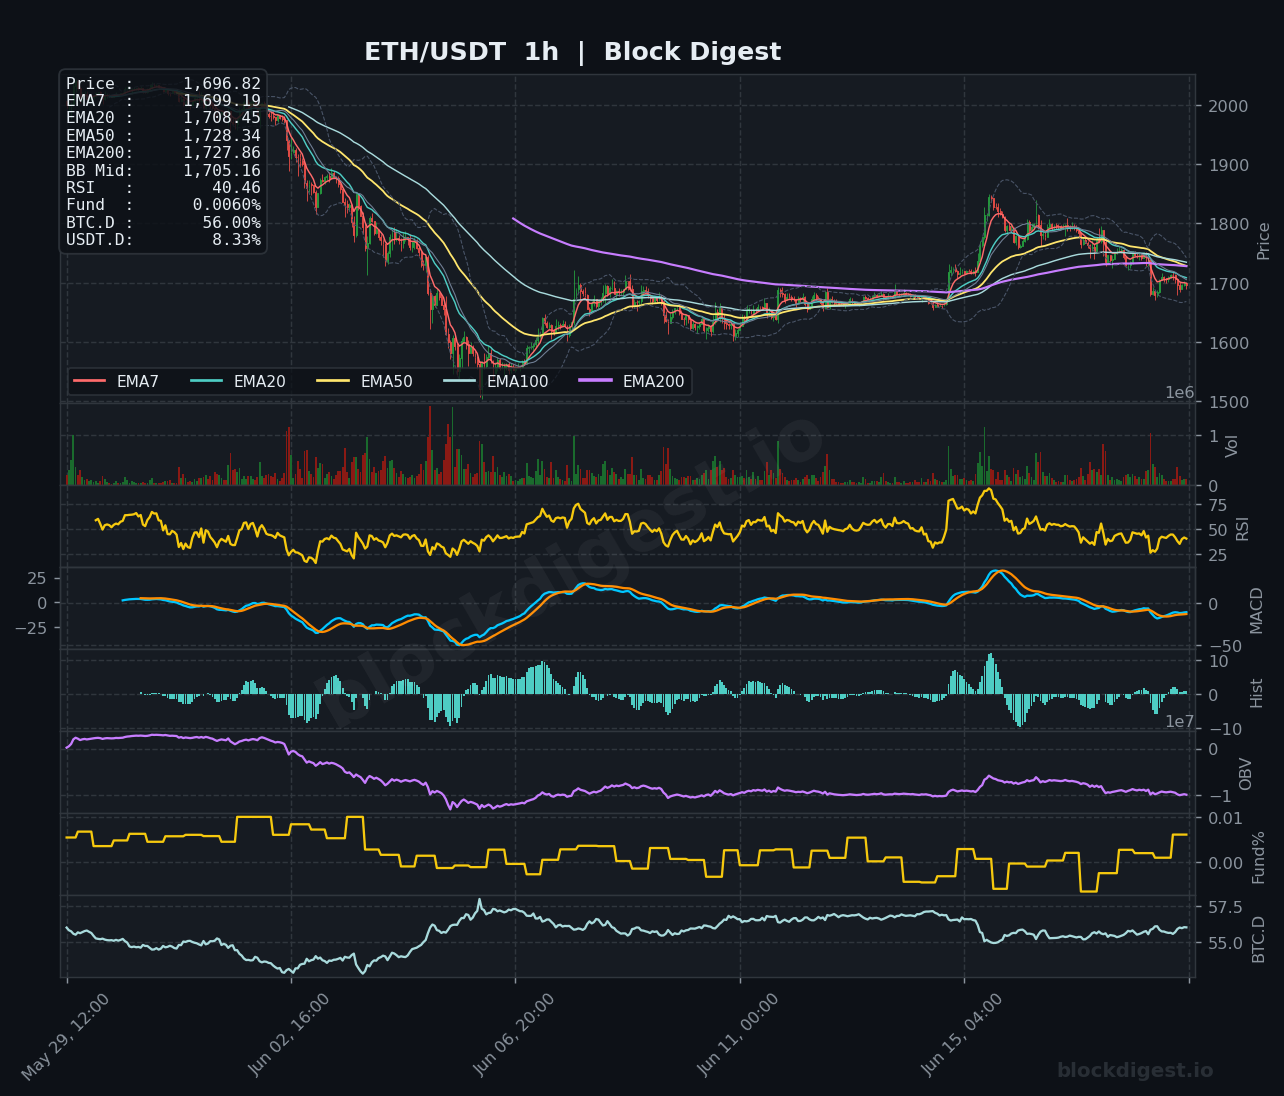
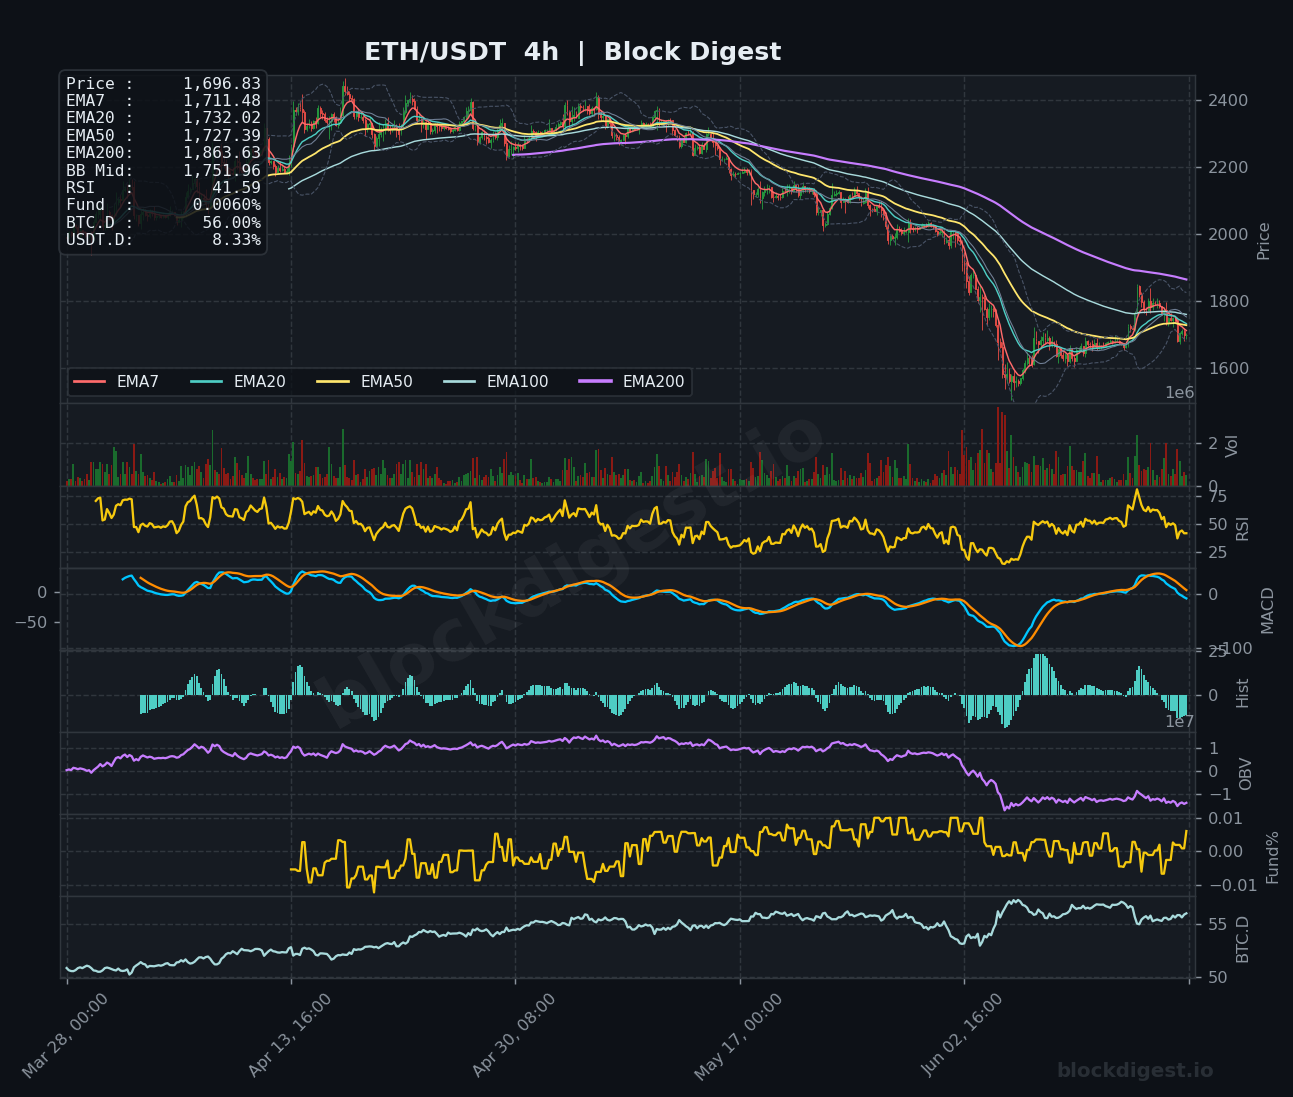
Across all three timeframes, the EMA stack is in a uniform bearish alignment — shorter EMAs sitting below longer ones — with no timeframe offering a counter-trend signal of substance. On the 1-hour chart, price is marginally below the EMA7 ($1,699.19) and EMA20 ($1,708.45), while the EMA50 ($1,728.34) and EMA200 ($1,727.86) have converged tightly overhead, forming a dense resistance cluster in the $1,727–$1,732 zone that aligns with the 4-hour EMA20 ($1,732.02) and EMA50 ($1,727.39). The 4-hour chart reinforces the bearish narrative, with price trading well beneath the BB midline ($1,751.96) and the EMA200 at $1,863.63 acting as a macro ceiling of considerable magnitude. Short-term momentum on the 1-hour and 4-hour is subdued but not yet in extreme oversold territory, offering no clear capitulation signal to support a reversal thesis.
Key Levels to Watch
- Resistance: $1,727–$1,732 — Confluence of the 1h EMA50/EMA200 and 4h EMA20/EMA50; a cluster that has capped multiple recent recovery attempts and represents the first meaningful hurdle for bulls.
- Resistance: $1,751–$1,752 — The 4-hour Bollinger Band midline; reclaiming this level would be the minimum requirement to shift short-term structure from bearish to neutral.
- Resistance: $1,800–$1,810 — A broader structural zone where price consolidated prior to the recent leg lower; also aligns with the 4h EMA7’s recent rejection area and would represent a significant sentiment shift if reclaimed.
- Support: $1,680–$1,690 — Immediate demand zone where price has been finding tentative bids; a clean break below risks accelerating downside momentum.
- Support: $1,620–$1,640 — The next identifiable area of prior price structure and the lower Bollinger Band range on the 4-hour chart; a high-risk zone for leveraged long positions.
- Support: $1,500 — A major psychological and structural level that represents the broader macro floor; a test of this level would signal a significant deterioration in market conditions.
Momentum & On-Chain Signals
The RSI readings across all three timeframes are uniformly bearish but differentiated in severity: 40.46 on the 1-hour, 41.59 on the 4-hour, and a notably weak 37.66 on the daily — the latter approaching oversold territory but without the kind of extreme reading that typically precedes sharp relief rallies. The MACD on the 4-hour has recently attempted a bullish crossover from deeply negative territory, with the histogram printing small positive bars, but the signal remains fragile and unconvincing given the broader context. OBV on both the 4-hour and daily charts continues to trend lower, consistent with persistent distribution and an absence of meaningful accumulation; there is no positive divergence between OBV and price to suggest smart money positioning for a reversal. The funding rate across timeframes sits at a near-neutral 0.0060%, indicating the market is not aggressively short — a slight positive in that a short squeeze scenario remains plausible if a catalyst emerges, though this alone is insufficient to drive sustained upside.
BTC Dominance & Market Sentiment
BTC dominance is elevated at 56.00%, reflecting continued capital concentration in Bitcoin at the expense of altcoins — a headwind for ETH and the broader altcoin market that shows little sign of abating. USDT dominance at 8.33% suggests a meaningful portion of market participants remain in stablecoins, indicating risk-off positioning and a lack of conviction in deploying capital into the market at current levels. For ETH specifically, the combination of high BTC.D and elevated USDT.D implies that any broad market recovery would likely benefit Bitcoin first, with ETH lagging unless dominance begins to rotate meaningfully lower.
Risk Scenarios
- Bullish case: A decisive hourly close above $1,732, accompanied by volume expansion and a MACD bullish crossover on the 4-hour, would open the path toward the $1,751–$1,800 resistance range and signal a potential short-term trend reversal. Sustained BTC.D compression below 55% would further validate ETH outperformance and add conviction to a recovery trade.
- Bearish case: A confirmed breakdown below $1,680 on elevated volume, with the daily RSI moving into oversold territory below 30, would expose the $1,620–$1,640 support zone and potentially accelerate toward the $1,500 macro level. Continued OBV deterioration alongside a funding rate flip negative would reinforce the distribution thesis.
Outlook
The overall directional bias for ETH remains bearish as of June 19, 2026, with price action, EMA structure, OBV, and macro sentiment indicators all aligned to the downside. The critical trigger to watch in the next 24–48 hours is whether the $1,680 support holds as a base for any relief bounce, or succumbs to renewed selling pressure. A reclaim of the $1,727–$1,732 resistance cluster would be the minimum condition to shift the short-term thesis to neutral. Until price demonstrates a sustained ability to close above its key short-term EMAs with supporting volume and momentum confirmation, any bounce should be treated as a counter-trend opportunity rather than evidence of a trend reversal.
Disclaimer: This analysis is for informational purposes only and does not constitute financial advice. Cryptocurrency markets are highly volatile and unpredictable. All trading decisions should be made based on your own research and risk tolerance. Block Digest is not responsible for any financial losses incurred as a result of acting on this content.
Stay Ahead of the Market
Follow BlockDigest for crypto market intelligence, research and real-time updates.


