
Market Overview
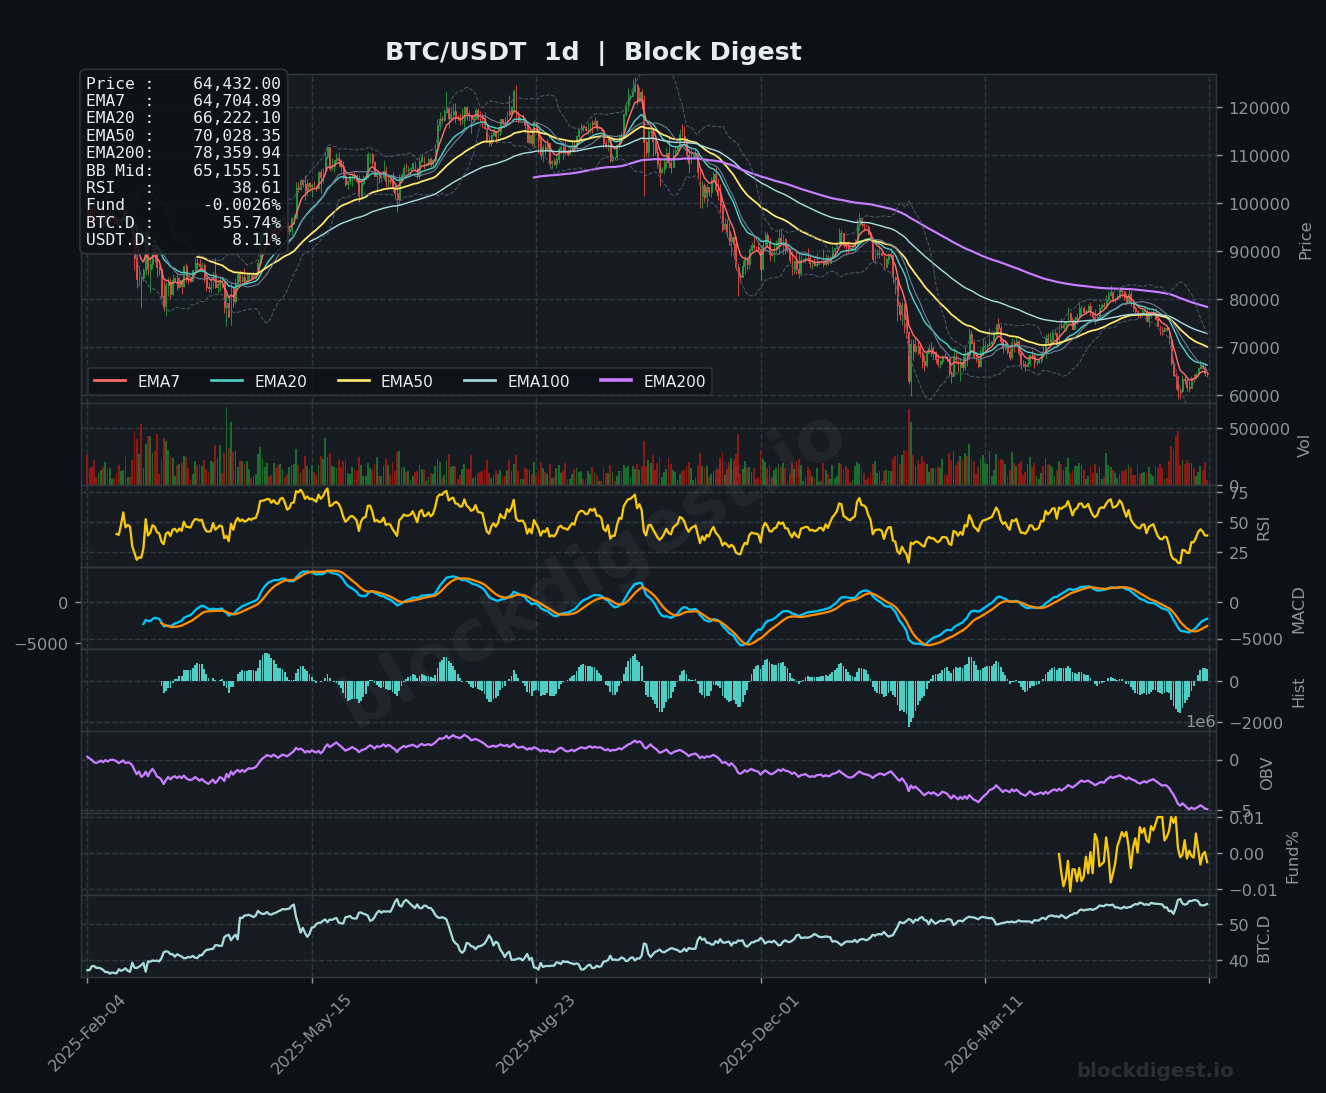
Bitcoin is currently trading at $64,433.60, sitting in a technically precarious position relative to its key moving averages. On the daily timeframe, price remains well below the EMA50 ($70,028) and EMA200 ($78,359), confirming that the dominant trend remains bearish from the macro perspective. Price is trading just beneath the daily Bollinger Band midline at $65,155, indicating that sellers still retain control of the intermediate structure. The recent recovery from lows has stalled, and the inability to reclaim the BB midline is a notable warning sign for bulls attempting to build a case for reversal.
Multi-Timeframe Confluence
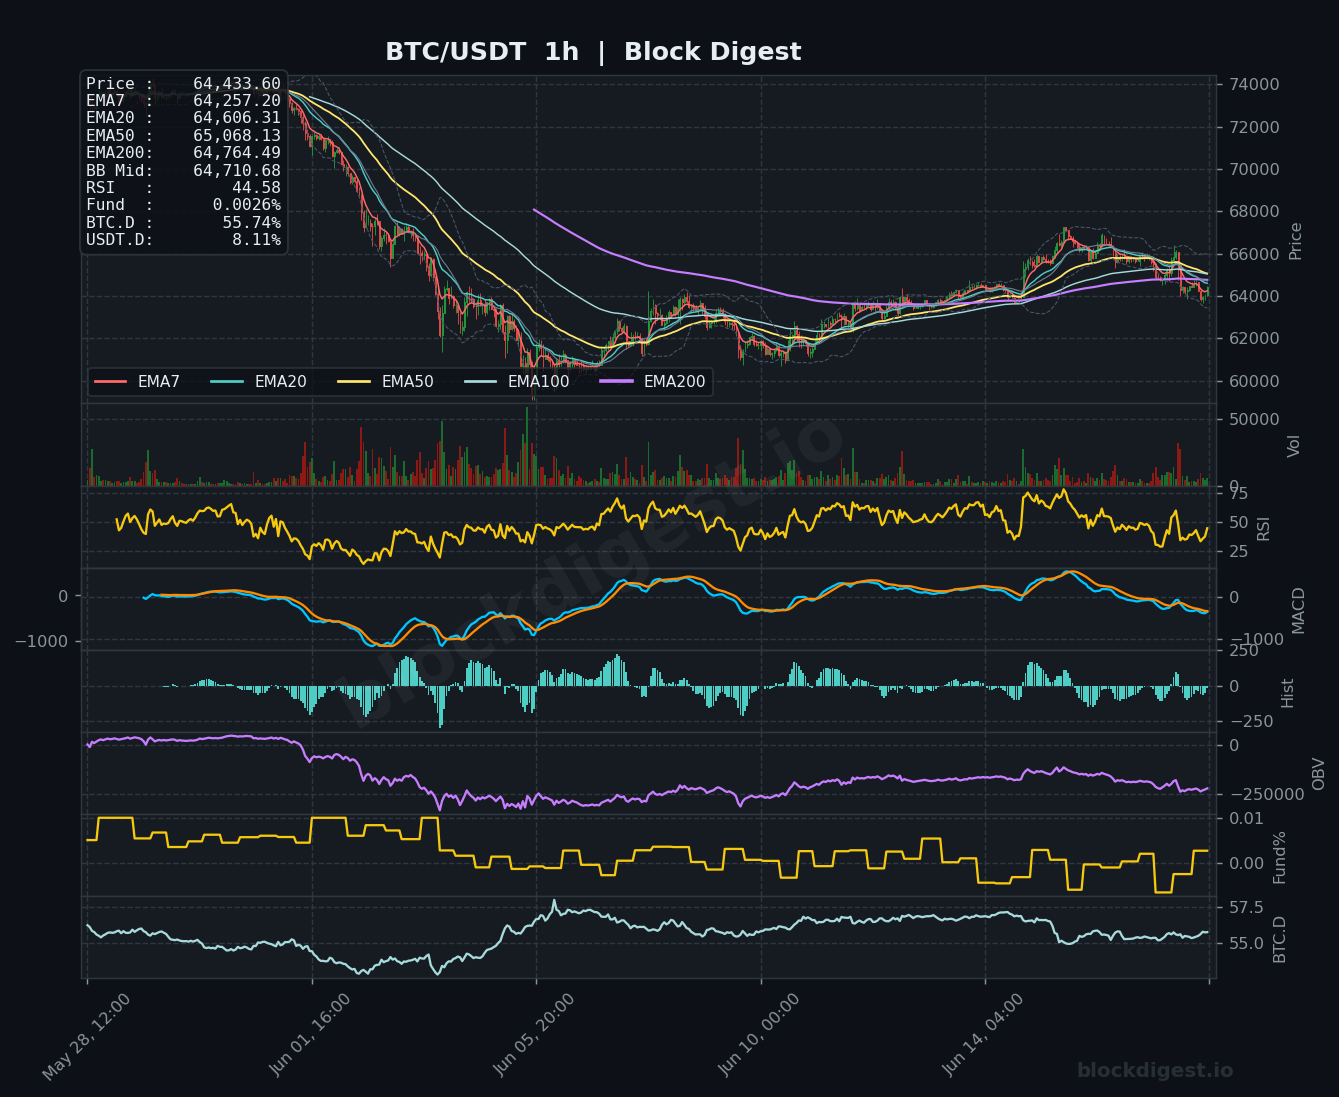
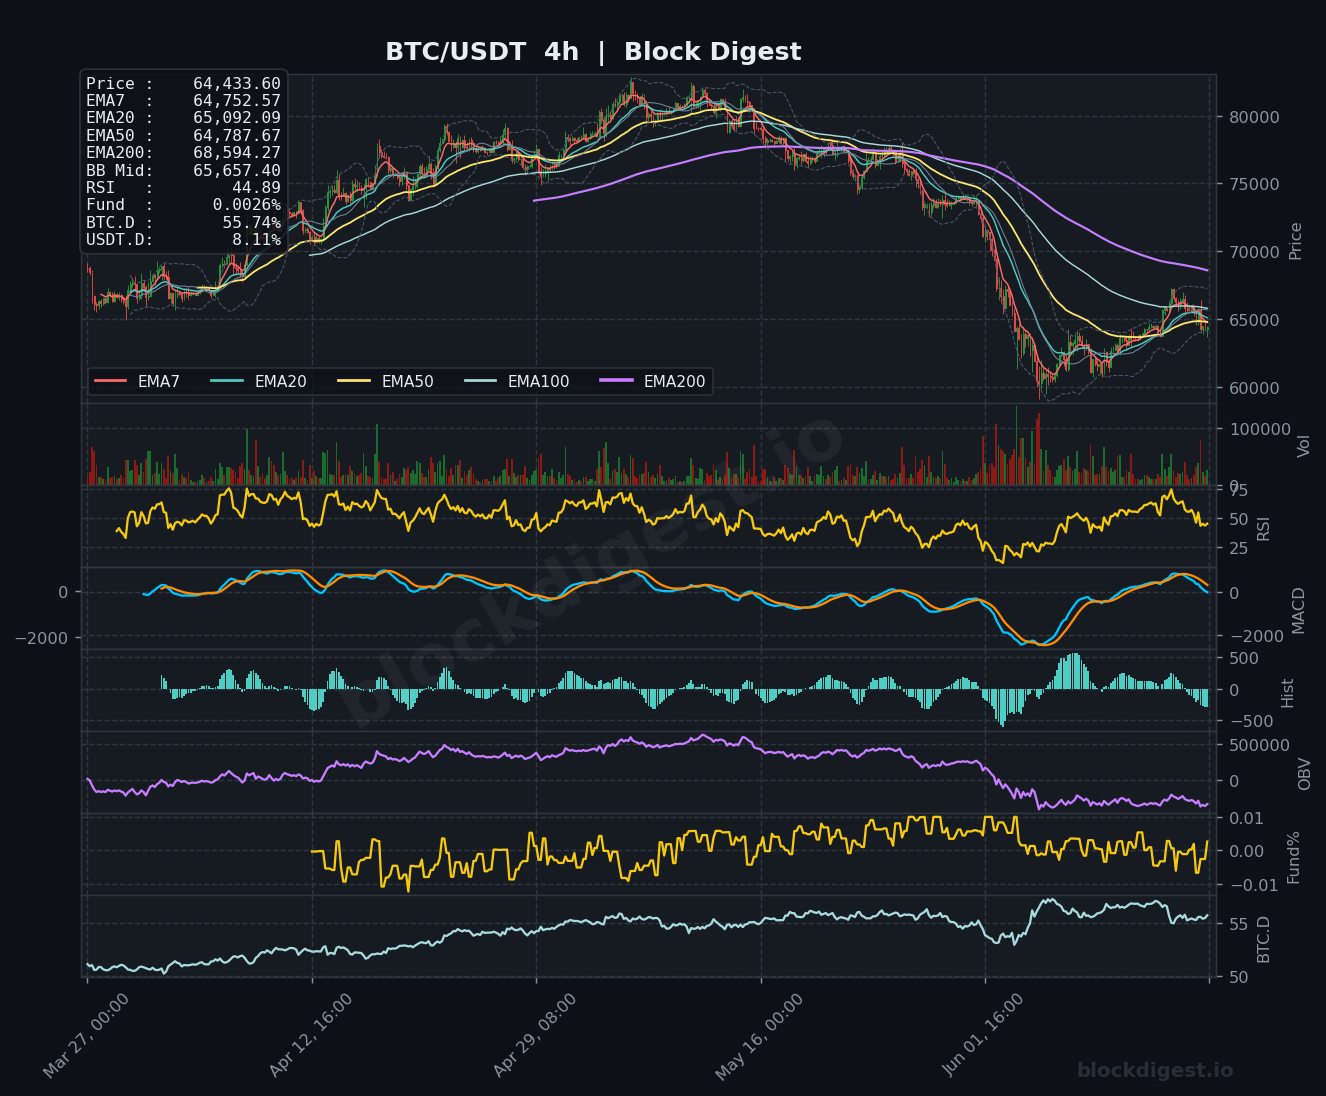
Across all three timeframes, the EMA stack remains bearishly aligned — shorter-term EMAs are trading below longer-term ones, and price is sandwiched between converging resistance levels. On the 4h chart, price is trading below both EMA7 ($64,752) and EMA20 ($65,092), with the EMA50 at $64,787 acting as immediate overhead resistance in a compressed cluster. The 1h chart shows price attempting to stabilize near the EMA20 ($64,606) but consistently failing to break above EMA50 ($65,068), reinforcing the 4h bear case. Short-term momentum is therefore not supportive of higher timeframe trend reversal — rather, the 1h structure reflects a weak consolidation within an ongoing corrective phase.
Key Levels to Watch
- Resistance: $65,068–$65,092 — Confluent 1h/4h EMA50 and EMA20 cluster; consistent rejection zone capping recovery attempts
- Resistance: $65,155–$65,657 — Daily BB midline at $65,155 and 4h BB midline at $65,657; reclaiming this zone is necessary for any meaningful bullish re-engagement
- Resistance: $66,222 — Daily EMA20; first major structural resistance level that would need to be cleared to shift the intermediate trend bias
- Support: $64,257 — 1h EMA7; immediate short-term support currently holding price above recent lows
- Support: $63,000–$63,500 — Visible price structure support zone from prior consolidation; a break here would accelerate downside
- Support: $61,500–$62,000 — Lower Bollinger Band region on the daily chart; represents a critical floor for the current corrective phase
Momentum & On-Chain Signals
The RSI readings across all timeframes are uniformly weak: 44.58 on the 1h, 44.89 on the 4h, and 38.61 on the daily — all in bearish territory below the 50 midline with the daily approaching oversold conditions. The 4h MACD shows a tentative early bullish crossover attempt with the histogram turning marginally positive, but this signal is fragile and unconfirmed. On the daily, the MACD remains in negative territory with the signal line still crossing below zero, offering no structural support for bulls. OBV on both the 4h and daily charts continues to trend lower, indicating sustained distribution pressure and the absence of meaningful accumulation at current price levels. Funding rates at a neutral 0.0026% suggest the market is not heavily leveraged in either direction, limiting the probability of a violent short squeeze catalyst.
BTC Dominance & Market Sentiment
BTC dominance sits at 55.74%, a relatively elevated reading that signals capital rotation away from altcoins and into BTC as a relative safe haven — but this has not translated into price strength for BTC itself. USDT dominance at 8.11% reflects a still-elevated level of cash-holding and risk-off positioning in the broader crypto market, suggesting participants remain cautious and have not yet committed to a re-entry. These readings together paint a picture of a market in defensive mode, where even BTC’s relative outperformance is occurring in the context of broad-based weakness.
Risk Scenarios
- Bullish case: A decisive hourly close above the $65,068–$65,157 resistance confluence, followed by reclaiming the daily BB midline, would open a path toward $66,222 (daily EMA20) and potentially $67,500. Sustained volume expansion accompanying any breakout would be necessary to validate the move.
- Bearish case: Failure to hold the $64,257 EMA7 support on the 1h, combined with a decisive breakdown below $63,500, would confirm the resumption of the broader downtrend and expose the $61,500–$62,000 support zone. A daily close below the current structure would intensify selling pressure given the already-weak OBV and RSI profile.
Outlook
The overall directional bias remains cautiously bearish with a neutral short-term lean, as BTC consolidates in a tight range without sufficient momentum or volume to confirm either a reversal or a continuation move. The next 24–48 hours are critical — the $65,068–$65,157 resistance cluster must be reclaimed with conviction for any bullish thesis to gain traction. A failure to do so, particularly if accompanied by a deterioration in the 1h EMA structure, would suggest the path of least resistance remains to the downside toward $62,000. Traders should watch funding rates and OBV closely for early signals of a trend shift, as both indicators have historically provided early warning ahead of major directional moves in this market.
Disclaimer: This analysis is for informational purposes only and does not constitute financial advice. Cryptocurrency markets are highly volatile and unpredictable. All trading decisions should be made based on your own research and risk tolerance. Block Digest is not responsible for any financial losses incurred as a result of acting on this content.
Stay Ahead of the Market
Follow BlockDigest for crypto market intelligence, research and real-time updates.


