
market analysis
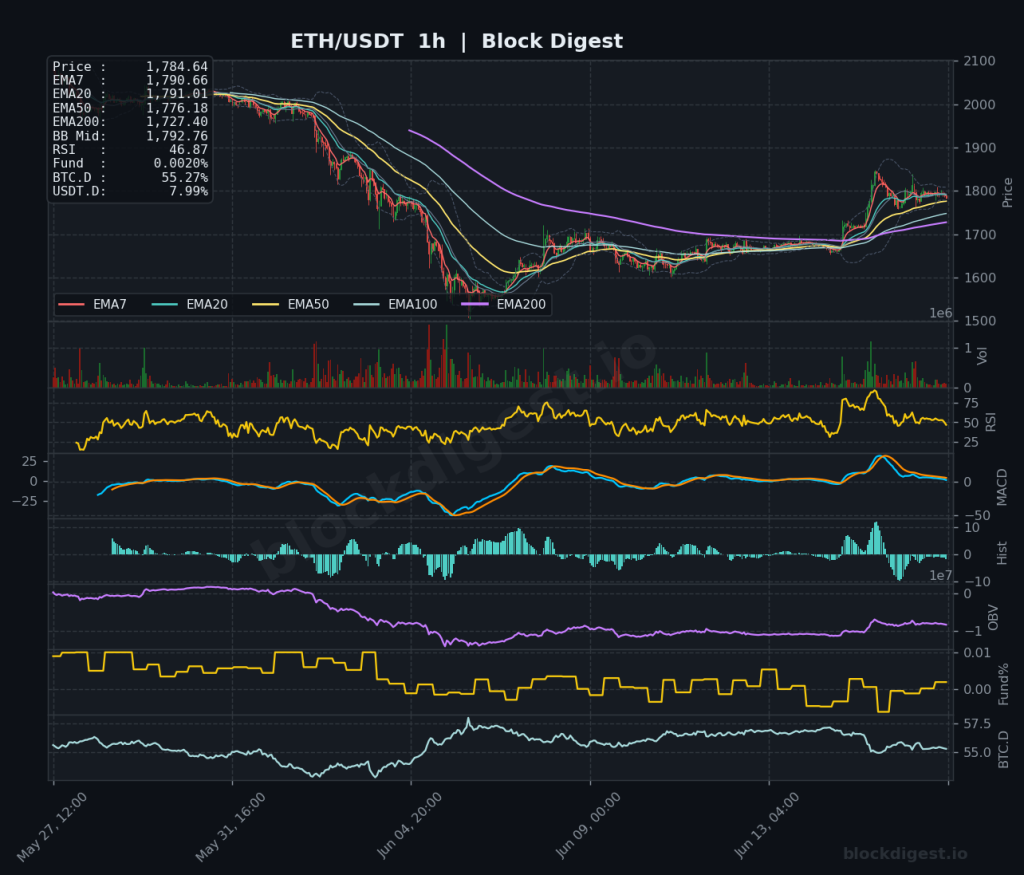
Ethereum Daily Analysis: ETH tests $1,784 below EMA20 in bearish decline
Market Overview ETH/USDT is currently trading at $1,784.75, navigating a technically precarious zone following a sharp multi-week decline from levels above $2,400. On the daily timeframe, price sits just below the EMA20 ($1,794.29) and well beneath both the EMA50 ($1,954.14) and the EMA200 ($2,376.17), confirming the dominant macro trend remains firmly bearish. The Bollinger Band...
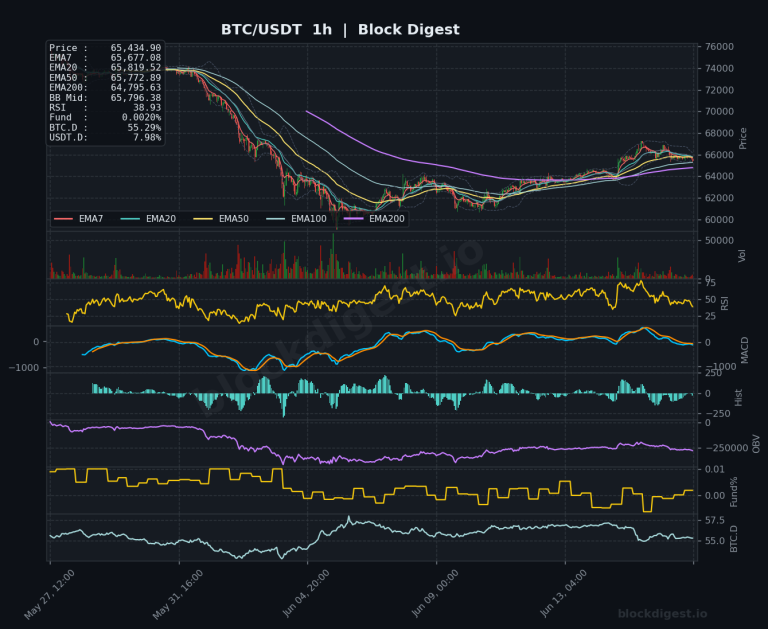
Bitcoin Daily Analysis: BTC Below EMAs at $65,435, Bearish Structure
Market Overview BTC/USDT is currently trading at $65,435, sitting below all major short-term EMAs on both the 1-hour and 4-hour timeframes, reflecting a structurally weak near-term posture. On the daily chart, price remains well below the EMA50 ($70,294) and EMA200 ($78,533), confirming that the dominant macro trend is bearish following an extended correction from the...

Ethereum Daily Analysis: ETH at $1,772 Tests EMA200 in Bearish Setup
Market Overview ETH/USDT is currently trading at $1,772.89, caught in a structurally bearish macro environment while attempting a short-term recovery from recent lows near $1,600. Price remains well below the daily EMA200 at $2,381.85 and the EMA50 at $1,960.29, confirming the dominant downtrend on the higher timeframe. The daily Bollinger Band midline sits at $1,779.89...
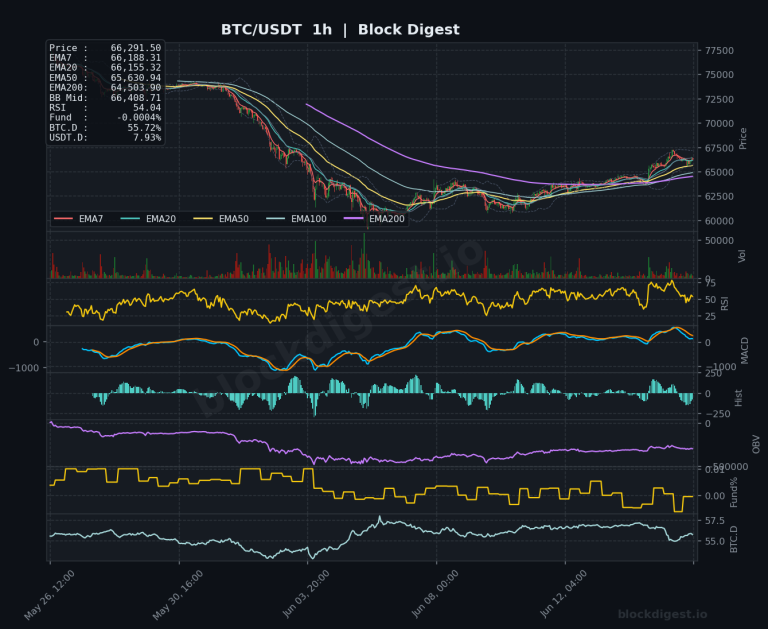
Bitcoin Daily Analysis: BTC Tests EMA20 and Bollinger Band Midline
Market Overview BTC/USDT is currently trading at approximately $66,300, navigating a technically precarious zone following a significant multi-month correction from all-time highs above $100,000. On the daily timeframe, price sits just below the EMA20 ($66,677) and is testing the Bollinger Band midline ($66,094), suggesting the market is at a pivotal inflection point rather than in...
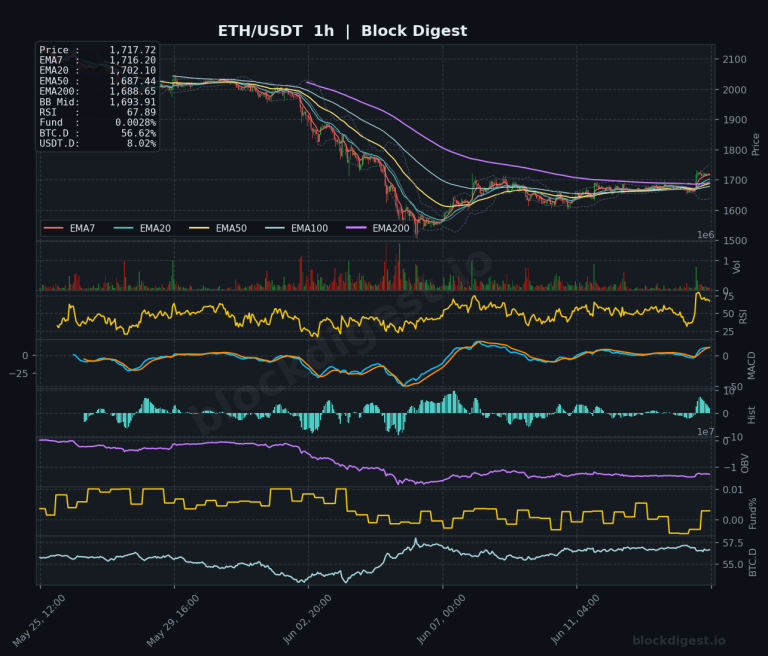
Ethereum Daily Analysis: ETH Attempts Recovery Below $1,788 EMA Resistance
Market Overview ETH/USDT is currently trading at $1,717.72, attempting a tentative recovery after an extended multi-month downtrend that drove prices from highs above $4,000 to lows near $1,500. On the daily timeframe, price remains deeply below all major EMAs — the EMA20 at $1,788.23, EMA50 at $1,964.91, and EMA200 at $2,388.89 — confirming that the...
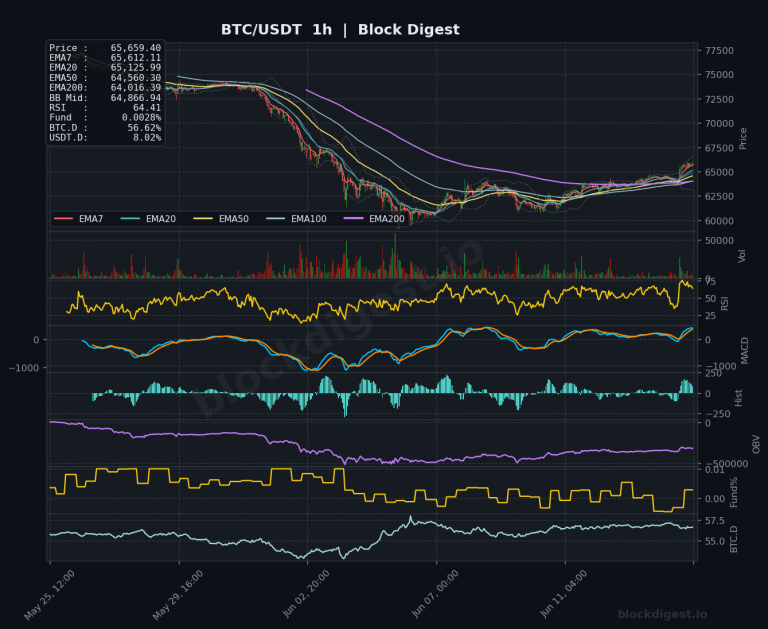
Bitcoin Daily Analysis: Bitcoin below EMA20 as recovery phase continues
Market Overview Bitcoin is currently trading at $65,659.40, navigating a critical recovery phase following a significant multi-week drawdown from highs above $109,000. On the daily timeframe, price remains firmly below the EMA20 ($66,656.70), EMA50 ($70,666.08), and EMA200 ($78,785.19), confirming that the macro trend remains bearish. The daily Bollinger Band midline sits at $66,468.48, and price...
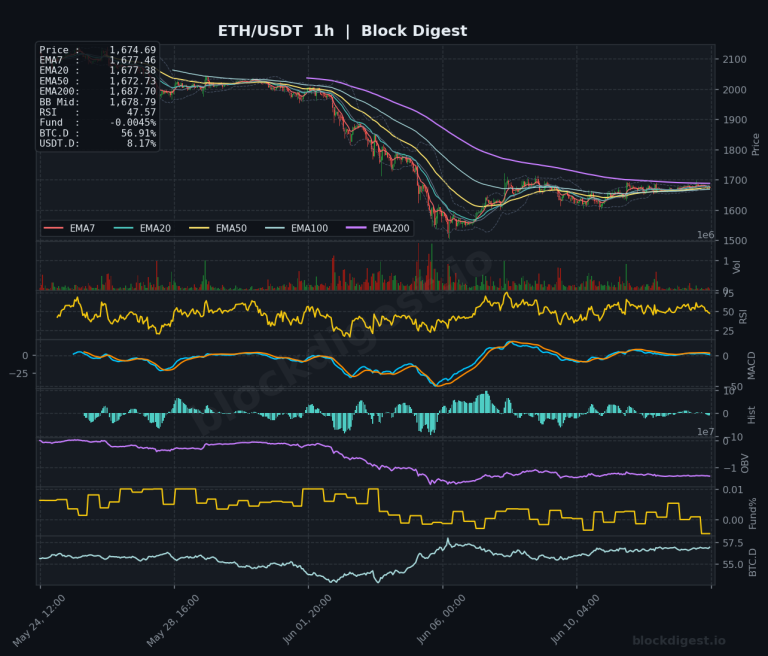
Ethereum Daily Analysis: Ethereum Below All EMAs, Bollinger Band Resistance at $1,804
Market Overview Ethereum is trading at $1,674.69 as of June 14, 2026, caught in a deeply entrenched bearish structure across all timeframes. Price sits well below every major EMA on the daily chart — with the EMA7 at $1,677.26, EMA20 at $1,790.89, EMA50 at $1,973.03, and the EMA200 towering at $2,396.38 — painting a picture...
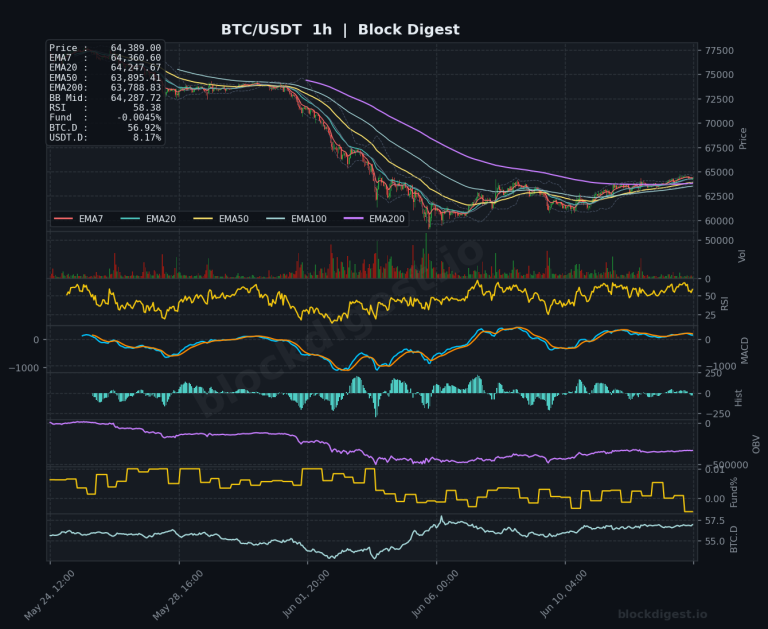
Bitcoin Daily Analysis: Bitcoin at $64,389 Below Key EMAs
Market Overview Bitcoin is currently trading at $64,389, attempting a modest recovery after a prolonged multi-week correction that dragged price from highs near $80,000 down to lows around $60,000. On the daily timeframe, BTC remains firmly below all major EMAs — the EMA7 at $63,784, EMA20 at $66,636, EMA50 at $70,819, and the EMA200 at...

Ethereum Daily Analysis: ETH at $1,676 Faces Major EMA Resistance Levels
Market Overview ETH/USDT is currently trading at $1,676.21, attempting a modest recovery after an extended downtrend that pushed prices from above $2,000 to multi-month lows near the $1,550–$1,580 range. On the daily timeframe, price remains deeply below all major EMAs — the EMA20 sits at $1,802.69, EMA50 at $1,985.03, and the EMA200 at a distant...

Bitcoin Daily Analysis: BTC Below Key EMAs at $63,782
Market Overview BTC/USDT is currently trading at approximately $63,782, sitting in a technically precarious position following an extended multi-week corrective decline from highs above $109,000. On the daily timeframe, price remains well below all major EMAs — the EMA20 at $66,812, EMA50 at $71,056, and EMA200 at $79,071 — confirming that the dominant trend on...
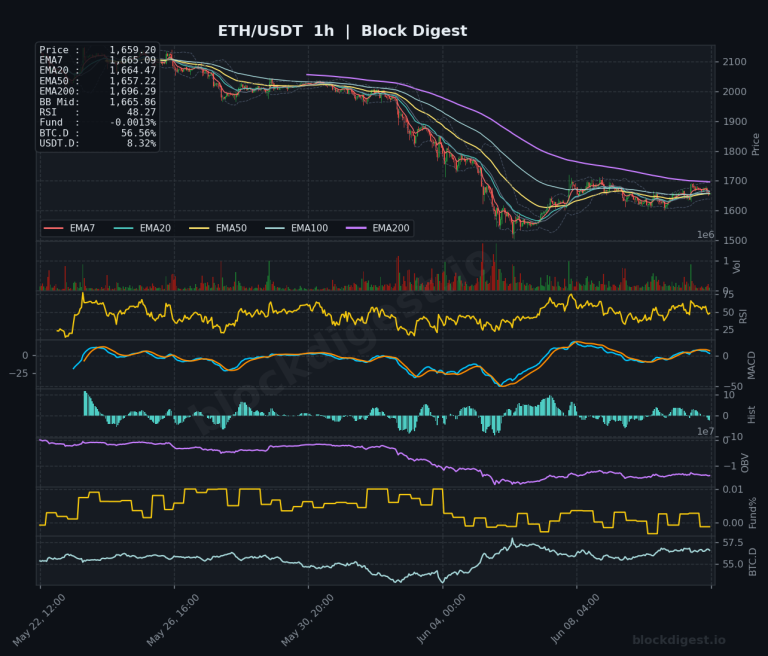
Ethereum Daily Analysis: ETH Below All Daily EMAs, Lower Bollinger Band
Market Overview ETH/USDT is currently trading at $1,659.20, deep in bearish territory across all major timeframes. Price sits well below every significant daily EMA — the EMA7 at $1,675.77, EMA20 at $1,815.44, EMA50 at $1,997.41, and the EMA200 at $2,409.56 — painting a fully stacked bearish EMA structure on the daily chart. The Bollinger Band...
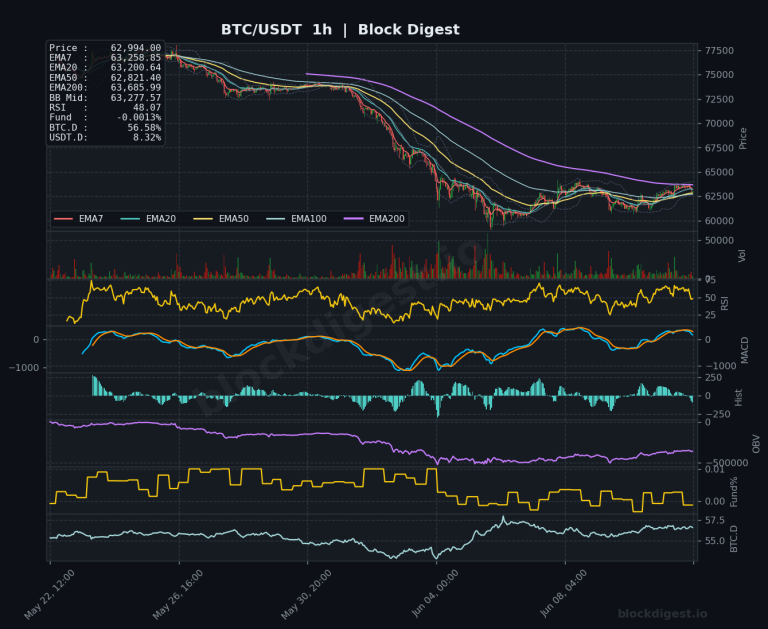
Bitcoin Daily Analysis: Bitcoin Below EMA20 in Bearish Structure
Market Overview Bitcoin is currently trading at $62,994, situated in a technically precarious position as it attempts to stabilize following a prolonged multi-week decline from highs above $80,000. On the daily timeframe, price remains in a firmly bearish structure, trading well below the EMA20 ($67,079), EMA50 ($71,331), and the EMA200 ($79,212) — a complete bearish...