
Market Overview
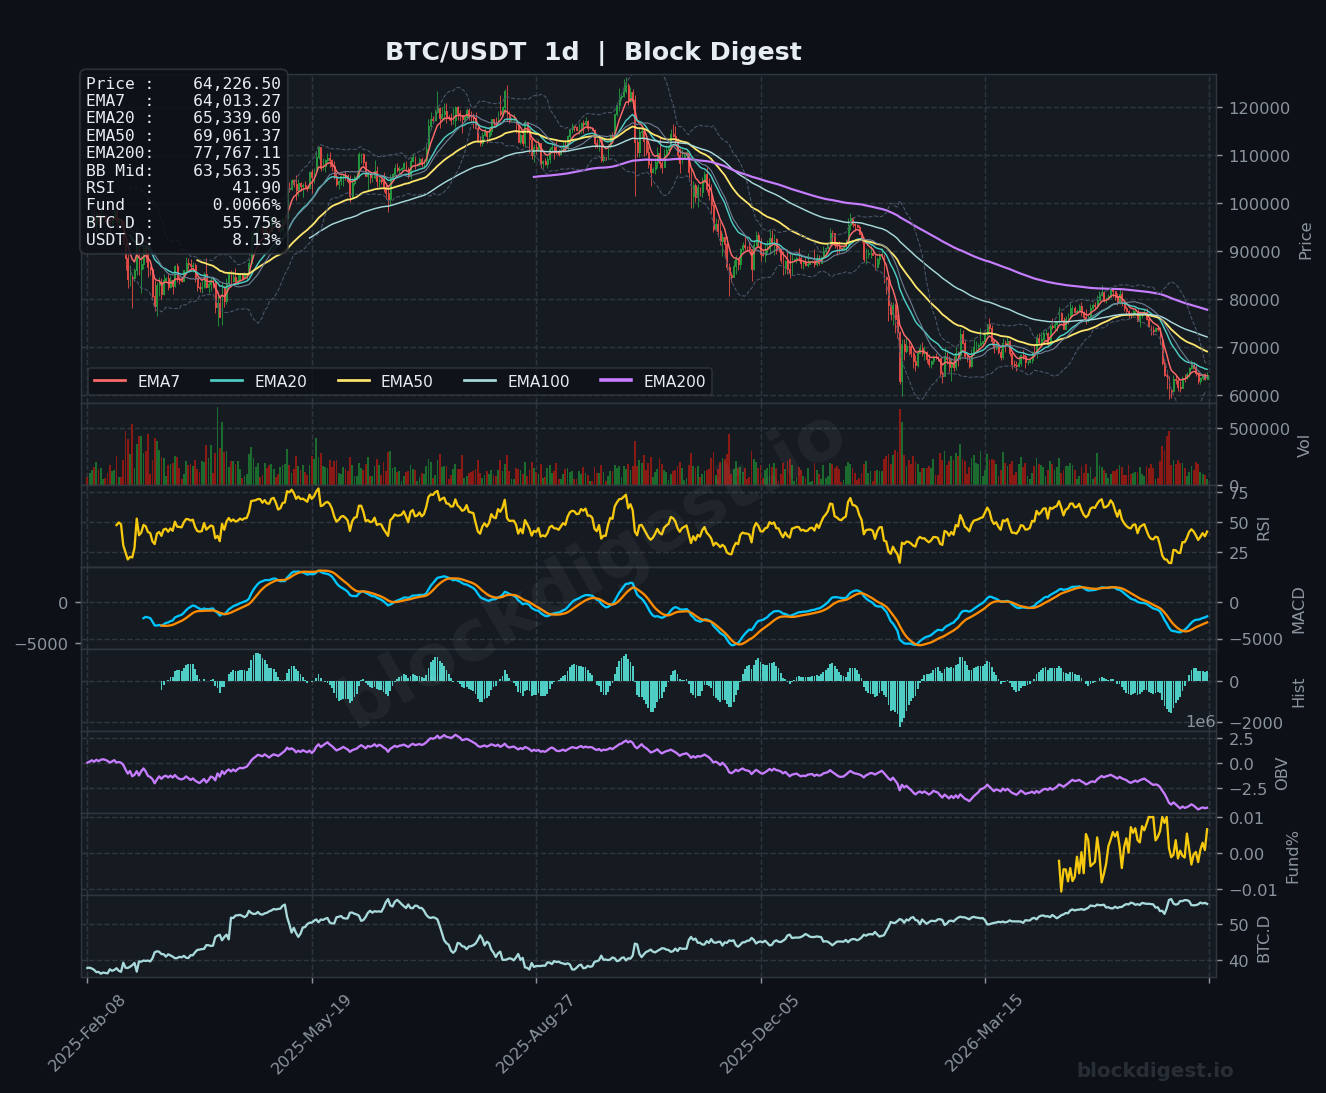
Bitcoin is currently trading at $64,247, navigating a structurally challenging environment following a prolonged decline from cycle highs well above $100,000. On the daily timeframe, price remains firmly below the EMA50 ($69,061), EMA200 ($77,767), and EMA20 ($65,339), confirming that the dominant trend is bearish. The daily Bollinger Band midline sits at $63,563, and price is hovering just marginally above it, suggesting the market is at a delicate inflection point. The EMA7 ($64,013) on the daily has begun to flatten, hinting at a potential near-term stabilization, but no meaningful structural reversal has been confirmed.
Multi-Timeframe Confluence
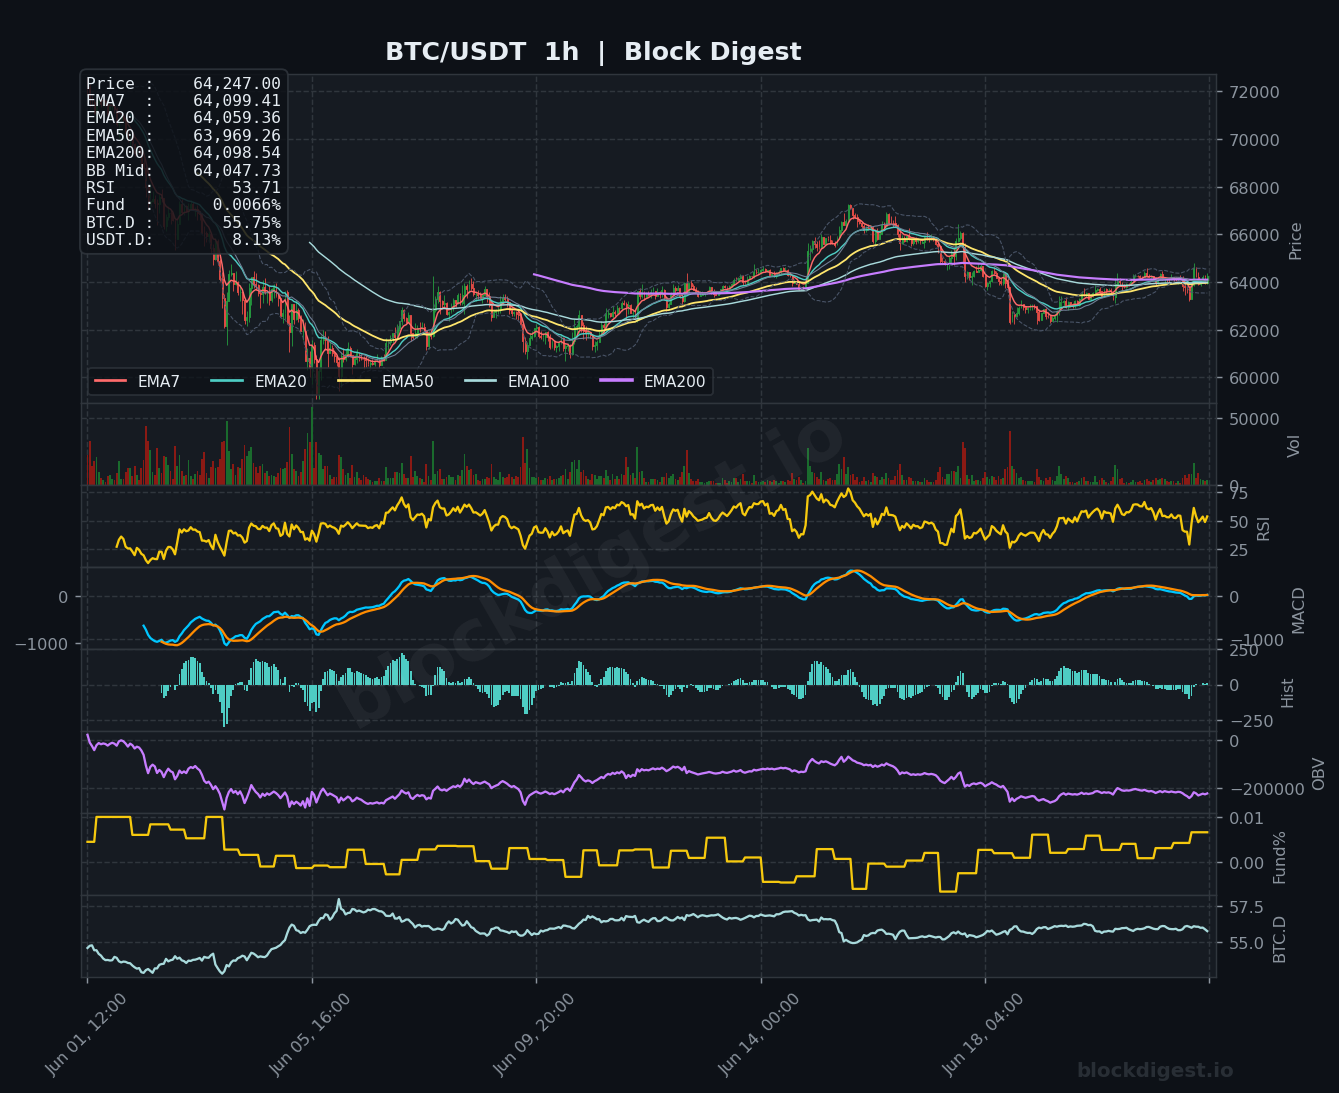
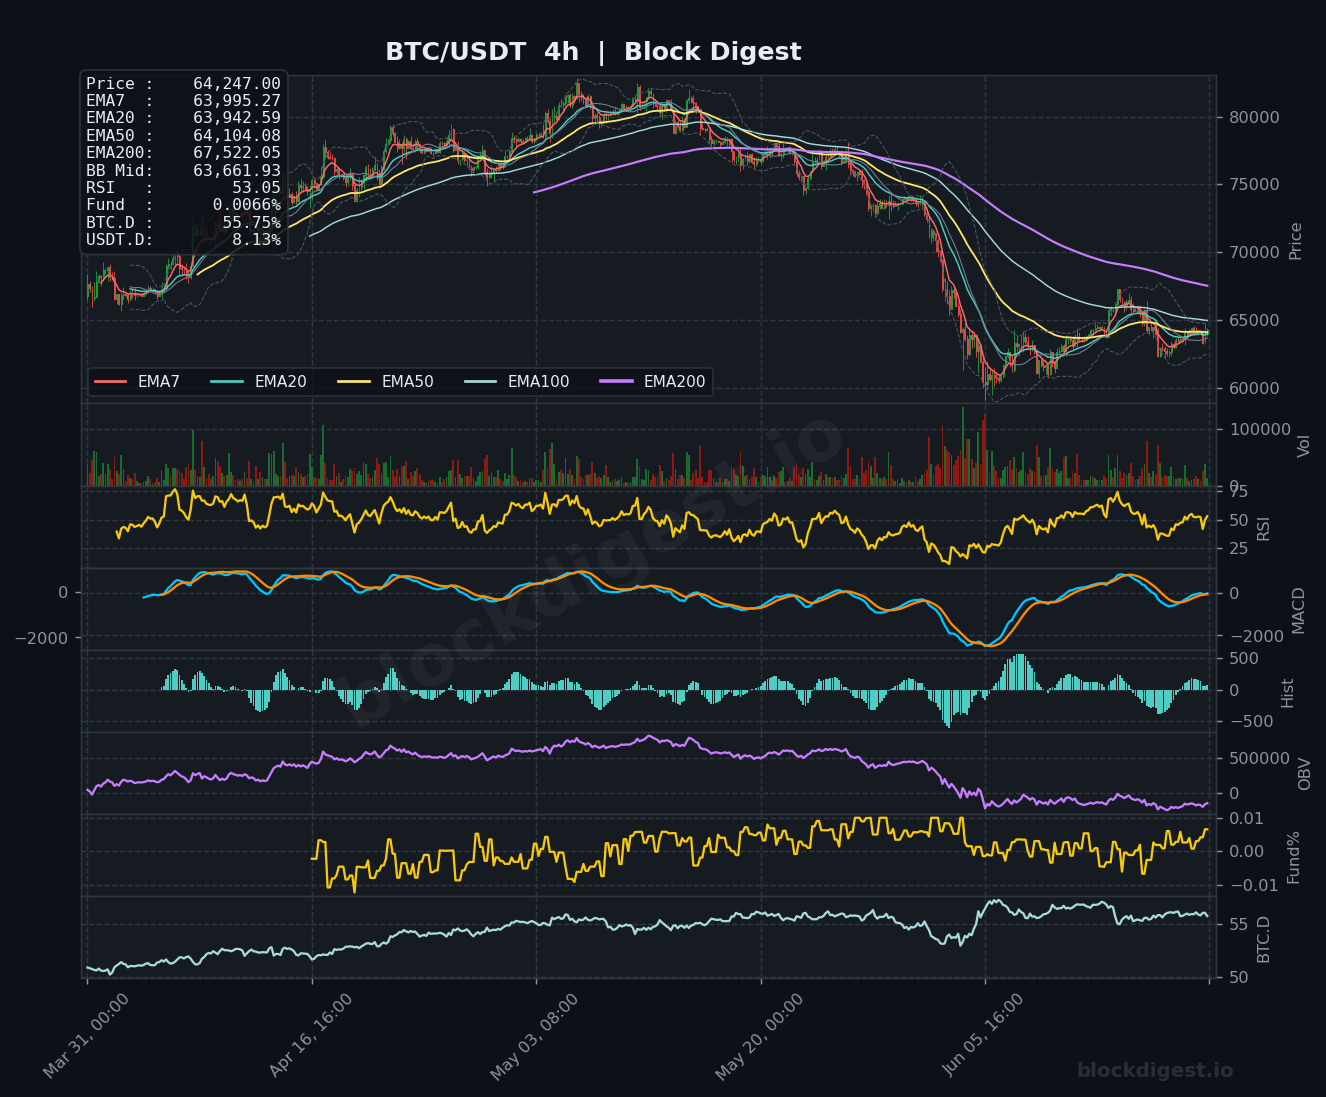
On the 1-hour chart, all short-term EMAs (EMA7: $64,099, EMA20: $64,059, EMA50: $63,969, EMA200: $64,098) are tightly clustered within a ~$130 range around current price, indicating extreme compression and indecision. The 4-hour chart shows price attempting to reclaim short-term EMAs after a sharp decline, with the EMA200 on that timeframe sitting significantly higher at $67,522, acting as a substantial overhead barrier. The compression on the 1-hour aligns with the 4-hour consolidation zone, and both timeframes suggest the market is coiling after a significant sell-off, though neither offers a clear directional resolution yet. The daily trend remains the dominant bearish structure that any short-term recovery must navigate.
Key Levels to Watch
- Resistance: $65,339 — Daily EMA20, the first meaningful dynamic resistance that capped price during the recent bounce attempt
- Resistance: $67,522 — 4-hour EMA200, a significant structural barrier representing the midpoint of the broader bearish EMA stack
- Resistance: $69,061 — Daily EMA50, a level that has acted as a consistent ceiling throughout the current downtrend
- Support: $63,563 — Daily Bollinger Band midline, currently providing near-term floor; a sustained break below this level would be structurally negative
- Support: $62,000–$62,500 — Lower Bollinger Band on the daily timeframe and a prior demand zone visible on the 4-hour chart
- Support: $60,000 — Psychological round number and a significant structural level; failure here would open the door to deeper retracement
Momentum & On-Chain Signals
The RSI readings present a mixed but cautious picture: the 1-hour RSI sits at 53.71 in neutral territory, the 4-hour RSI is also near 53, recovering from oversold conditions seen during the recent flush, while the daily RSI at 41.90 remains in bearish territory and has not yet reclaimed the neutral 50 level. The 4-hour MACD is showing early signs of a bullish crossover attempt with the histogram turning slightly positive, though the signal is nascent and unconfirmed. On-chain OBV tells a more concerning story — the daily OBV has been in a clear downtrend throughout the recent decline, indicating sustained distribution, while the 4-hour OBV shows only marginal stabilization. Funding rates are a modest positive at 0.0066%, suggesting the market is not aggressively short-biased, which removes immediate squeeze risk but also provides limited upside catalyst.
BTC Dominance & Market Sentiment
BTC dominance sits at 55.75%, a relatively elevated level that reflects ongoing capital rotation away from altcoins and into Bitcoin as a relative safe haven within the crypto space. USDT dominance at 8.13% remains elevated, signaling that a meaningful portion of market participants continue to hold cash on the sidelines rather than deploying into risk assets. Together, these readings suggest a defensive market posture — not extreme fear, but certainly not a risk-on environment conducive to sustained BTC upside.
Risk Scenarios
- Bullish case: A decisive reclaim of the daily EMA20 at $65,339 on meaningful volume, followed by a hold above this level, would suggest momentum is shifting and open a measured target toward the $67,500–$68,000 resistance cluster. Confirmation of the 4-hour MACD bullish crossover and a daily RSI push back above 50 would strengthen this thesis considerably.
- Bearish case: A breakdown below the daily Bollinger Band midline at $63,563, particularly on elevated volume, would signal renewed selling pressure and likely accelerate a move toward the lower Bollinger Band near $62,000. Failure at $62,000 would expose the critical $60,000 psychological support, with limited structural demand visible below that level on the charts.
Outlook
The current setup is best characterized as a low-conviction consolidation within a broader bearish trend, with price wedged between a cluster of short-term EMAs and a wall of declining higher-timeframe moving averages. The near-term directional bias leans cautiously bearish as long as price remains below the daily EMA20 at $65,339 and daily RSI stays under 50. The key trigger to watch over the next 24–48 hours is whether buyers can sustain price above the $63,563 BB midline and build toward a challenge of $65,339 — failure to do so will likely result in a retest of lower support. The thesis shifts meaningfully bullish only on a confirmed daily close above $65,339 with improving OBV and RSI momentum.
Disclaimer: This analysis is for informational purposes only and does not constitute financial advice. Cryptocurrency markets are highly volatile and unpredictable. All trading decisions should be made based on your own research and risk tolerance. Block Digest is not responsible for any financial losses incurred as a result of acting on this content.
Stay Ahead of the Market
Follow BlockDigest for crypto market intelligence, research and real-time updates.


