
Market Overview
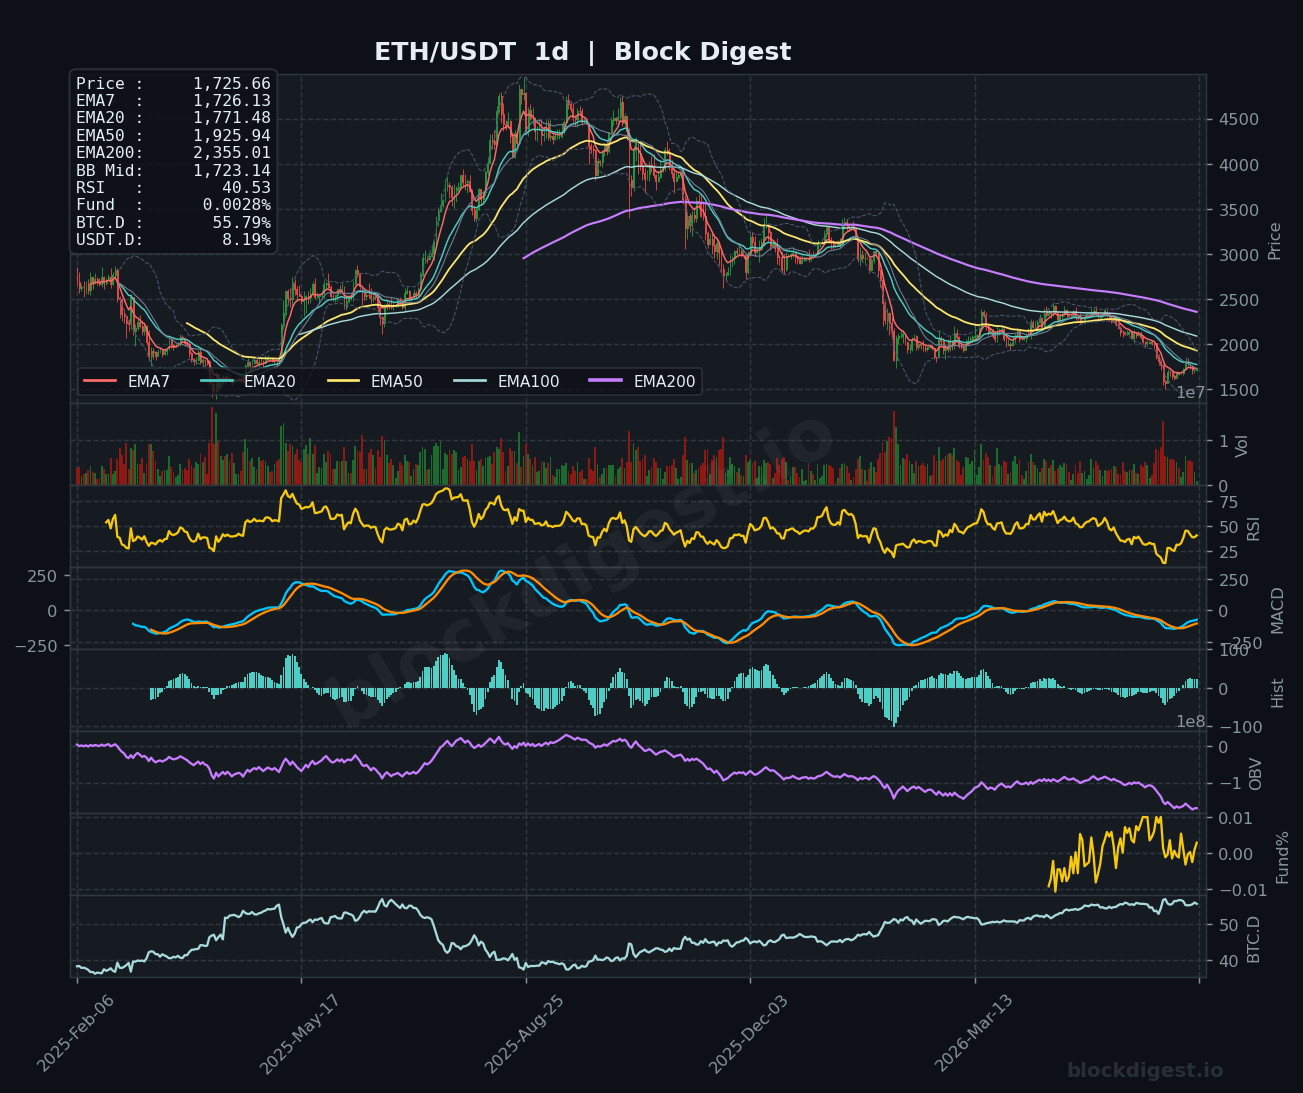
ETH/USDT is currently trading at $1,725.66, sitting in a precarious position within a prolonged macro downtrend that has erased significant value from the late-2025 highs above $4,000. On the daily timeframe, price is trading well beneath the EMA50 ($1,925.94), EMA200 ($2,355.01), and even the EMA20 ($1,771.48), confirming that the dominant structure remains bearish. The daily Bollinger Band midline at $1,723.14 is essentially acting as the current price magnet, and price is hugging the lower half of the daily bands — a bearish compression signal. The EMA7 on the daily ($1,726.13) has barely separated from price, indicating a lack of meaningful recovery momentum at the macro level.
Multi-Timeframe Confluence
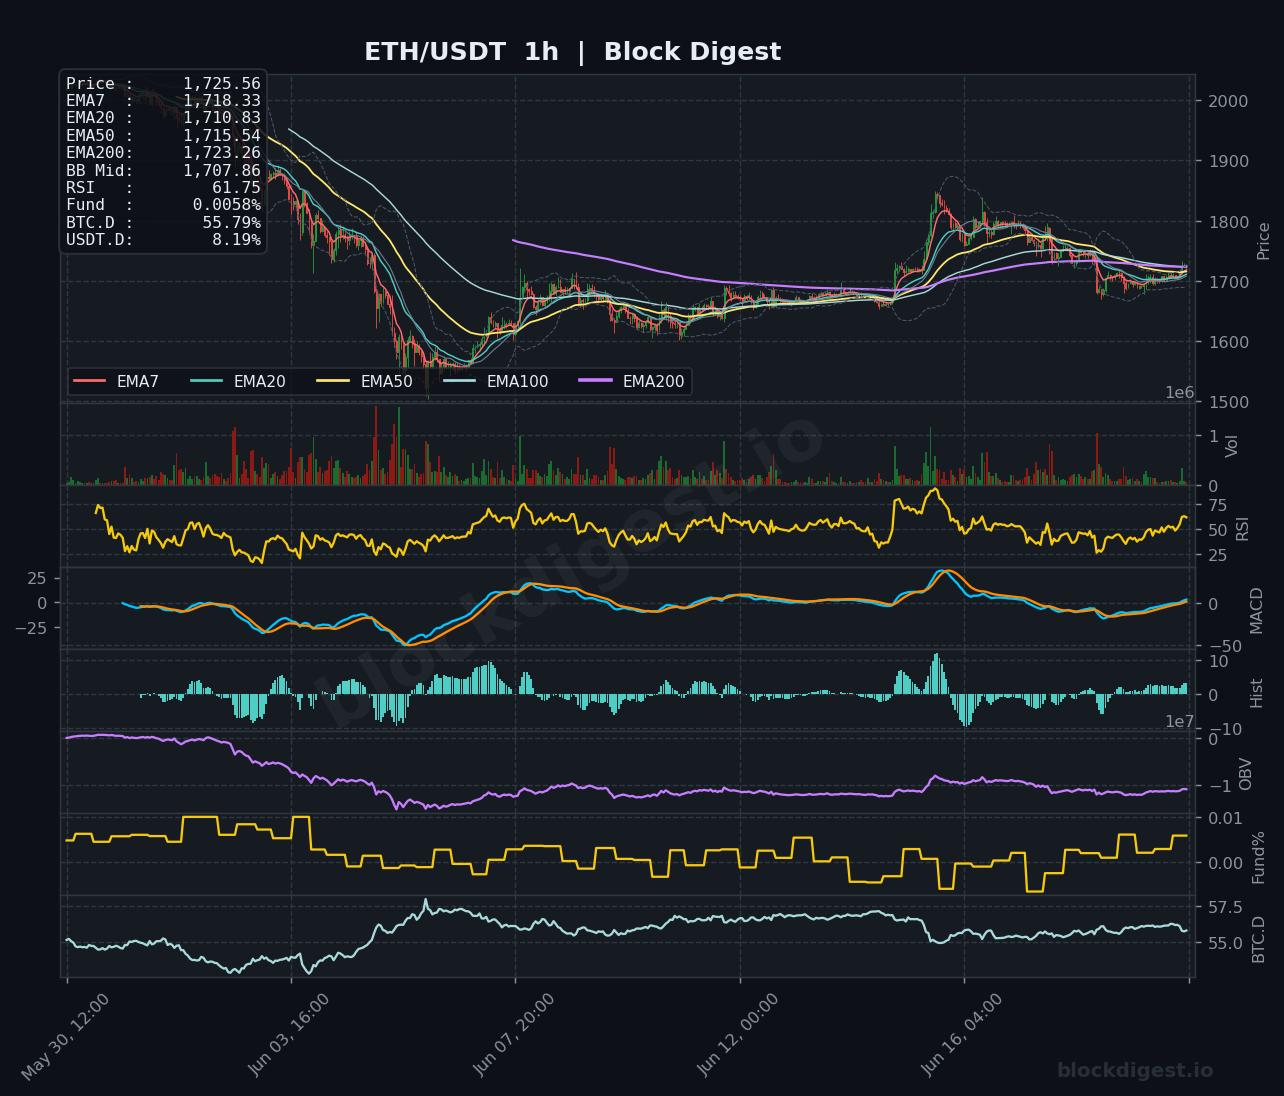
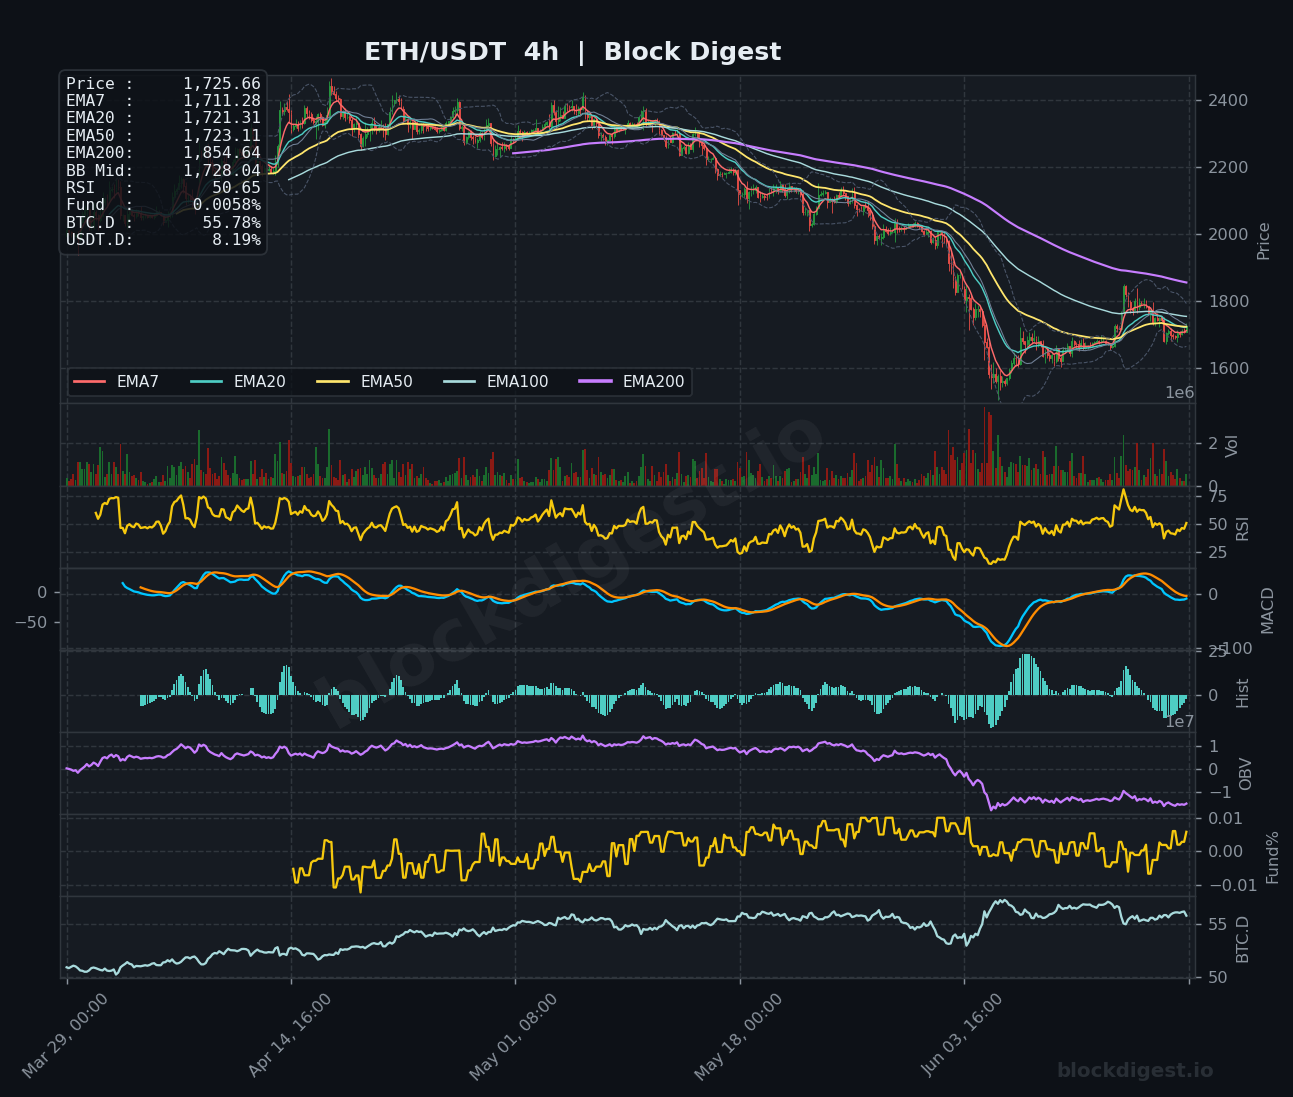
On the 1-hour chart, ETH has managed to reclaim all short-term EMAs (EMA7: $1,718.33, EMA20: $1,710.83, EMA50: $1,715.54, EMA200: $1,723.26), and price at $1,725.56 is sitting just above all of them — a modestly constructive intraday picture. However, the 4-hour chart presents a more cautious narrative: the EMA200 at $1,854.64 sits roughly 7.5% above current price, and EMAs remain in a bearish stacked formation with price only recently stabilizing near the EMA7 ($1,711.28) and EMA20 ($1,721.31). The compression of the short-term EMAs on both the 1h and 4h around the $1,710–$1,725 range creates a key confluence zone — a break in either direction from this cluster is likely to be decisive. Higher timeframe structure remains overwhelmingly bearish, meaning any short-term strength should be treated with significant skepticism.
Key Levels to Watch
- Resistance: $1,771 — Daily EMA20, the nearest dynamic resistance that capped prior recovery attempts and represents the first meaningful overhead hurdle.
- Resistance: $1,854–$1,860 — 4h EMA200 cluster; this zone aligned with the prior consolidation range and would signal a structural shift if reclaimed.
- Resistance: $1,925 — Daily EMA50, a major macro resistance level not tested since the accelerated downtrend began; reclaiming this would materially alter the bearish thesis.
- Support: $1,707–$1,710 — Hourly BB midline and EMA cluster; immediate short-term floor where bulls must defend to avoid fresh selling pressure.
- Support: $1,650–$1,660 — Recent swing low zone visible on the 4h chart during the most aggressive selling phase; a retest here would represent a critical structural test.
- Support: $1,580–$1,600 — Broader macro demand zone; a breakdown below $1,650 would likely accelerate a move toward this region given thin historical structure in between.
Momentum & On-Chain Signals
The RSI readings tell a clear story of divergence across timeframes: the 1h RSI at 61.75 shows short-term bullish momentum recovering well, the 4h RSI sits at a neutral 50.65 — exactly at the midpoint, reflecting indecision — while the daily RSI at 40.53 remains firmly in bearish territory, confirming the macro trend has not reversed. The 4h MACD has staged a tentative bullish crossover from deeply negative levels, with the histogram turning positive but with minimal conviction. OBV on the 4h chart dropped sharply during the recent sell-off and has only partially recovered, indicating distribution pressure has not fully subsided. The 1h funding rate at 0.0058% is mildly positive, suggesting slight long bias in perpetual markets, but not at levels that would indicate excessive overheating.
BTC Dominance & Market Sentiment
BTC dominance at 55.79% remains elevated and has been trending upward over the broader multi-month period visible on the daily chart, reflecting capital rotation toward Bitcoin at the expense of altcoins including ETH. USDT dominance at 8.19% is also relatively elevated, suggesting a meaningful portion of market participants remain in stablecoins and risk appetite for altcoins is constrained. For ETH specifically, continued high BTC.D acts as a headwind, and a sustained move below 55% BTC.D would be a necessary condition for any meaningful altcoin outperformance.
Risk Scenarios
- Bullish case: A confirmed hourly close above $1,771 (daily EMA20) on elevated volume, followed by a 4h close above $1,800, would signal a credible recovery attempt targeting the $1,854–$1,860 resistance zone. Sustained funding rate expansion alongside OBV uptick would add confirmation to this scenario.
- Bearish case: A breakdown below the $1,707–$1,710 EMA cluster on the 1h chart, particularly if accompanied by a 4h close beneath $1,700, would expose the $1,650 swing low and potentially open a path toward $1,580. Daily RSI already in bearish territory provides ample room for continued downside.
Outlook
ETH remains in a structurally bearish posture on the higher timeframes, with the current price action best characterized as a low-conviction consolidation within a larger downtrend rather than a confirmed reversal. The next 24–48 hours are critical: bulls need to defend the $1,710 short-term EMA cluster and push through $1,771 to generate any momentum worth tracking. A failure to hold $1,700 would negate the tentative short-term recovery and would likely bring $1,650 back into focus rapidly. The overall bias remains cautiously bearish with a neutral-to-watchful short-term stance until the 4h structure produces a clean bullish break above the converging EMA resistance zone.
Disclaimer: This analysis is for informational purposes only and does not constitute financial advice. Cryptocurrency markets are highly volatile and unpredictable. All trading decisions should be made based on your own research and risk tolerance. Block Digest is not responsible for any financial losses incurred as a result of acting on this content.
Stay Ahead of the Market
Follow BlockDigest for crypto market intelligence, research and real-time updates.


