
Market Overview
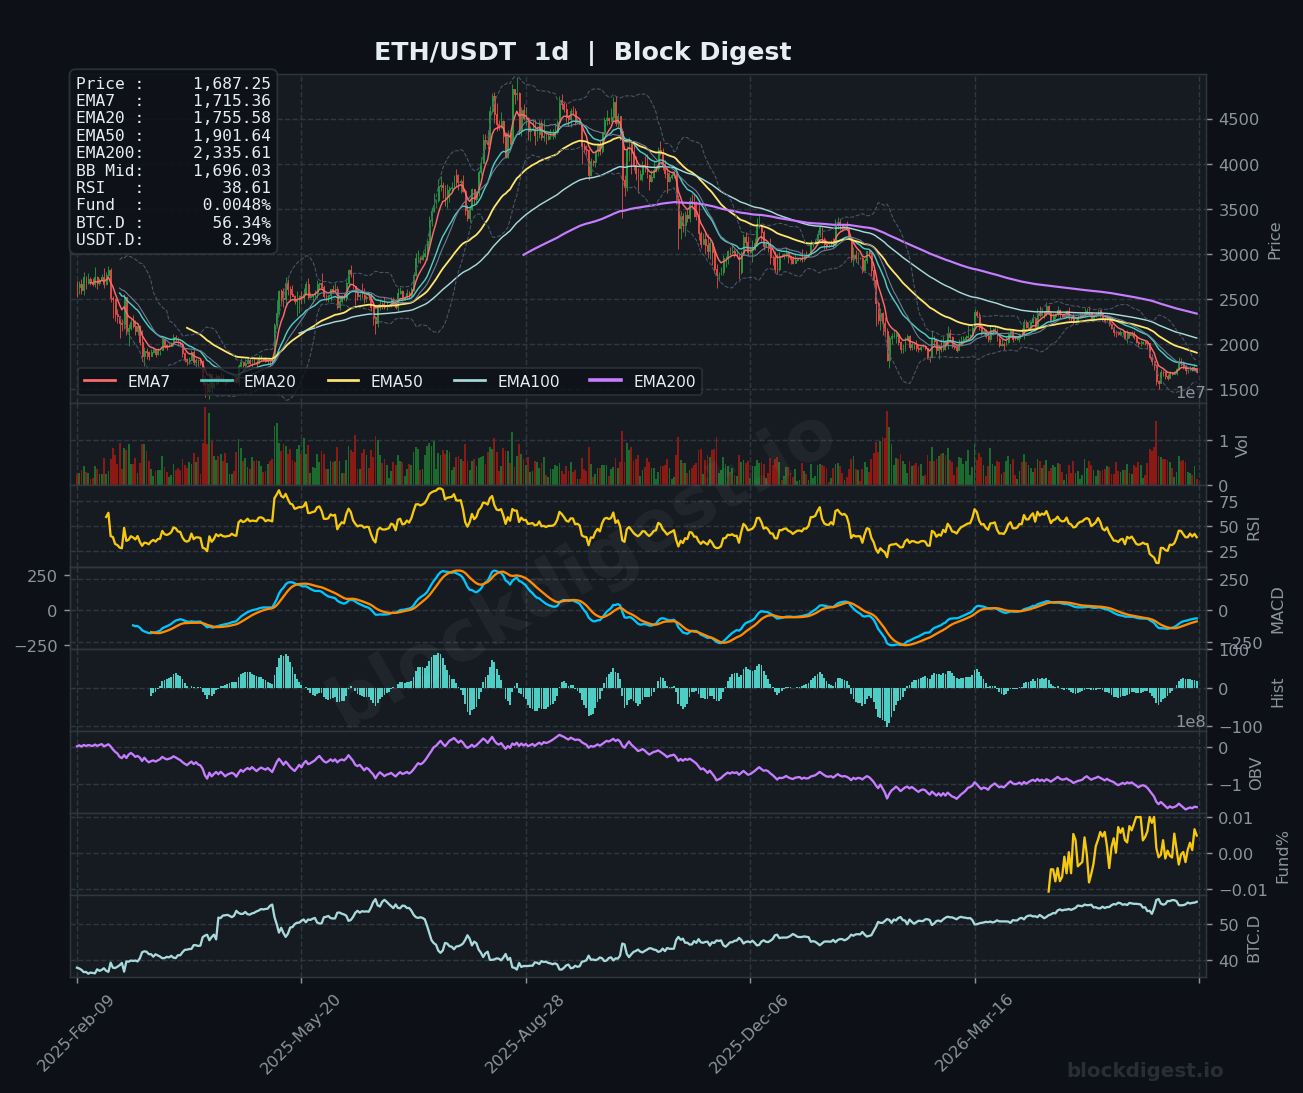
ETH/USDT is currently trading at $1,686.94, positioned beneath every key exponential moving average across all observed timeframes — a structurally bearish configuration. On the daily chart, price sits well below the EMA200 at $2,335.61, the EMA50 at $1,901.64, and the EMA20 at $1,755.58, confirming that the dominant trend remains firmly downward. The daily Bollinger Band midline at $1,696.03 is acting as immediate overhead resistance, with price hugging the lower half of the band — a sign of persistent selling pressure. The broader macro structure on the daily timeframe reflects a prolonged downtrend from the 2025 highs near $4,500, with no confirmed reversal signal yet in place.
Multi-Timeframe Confluence
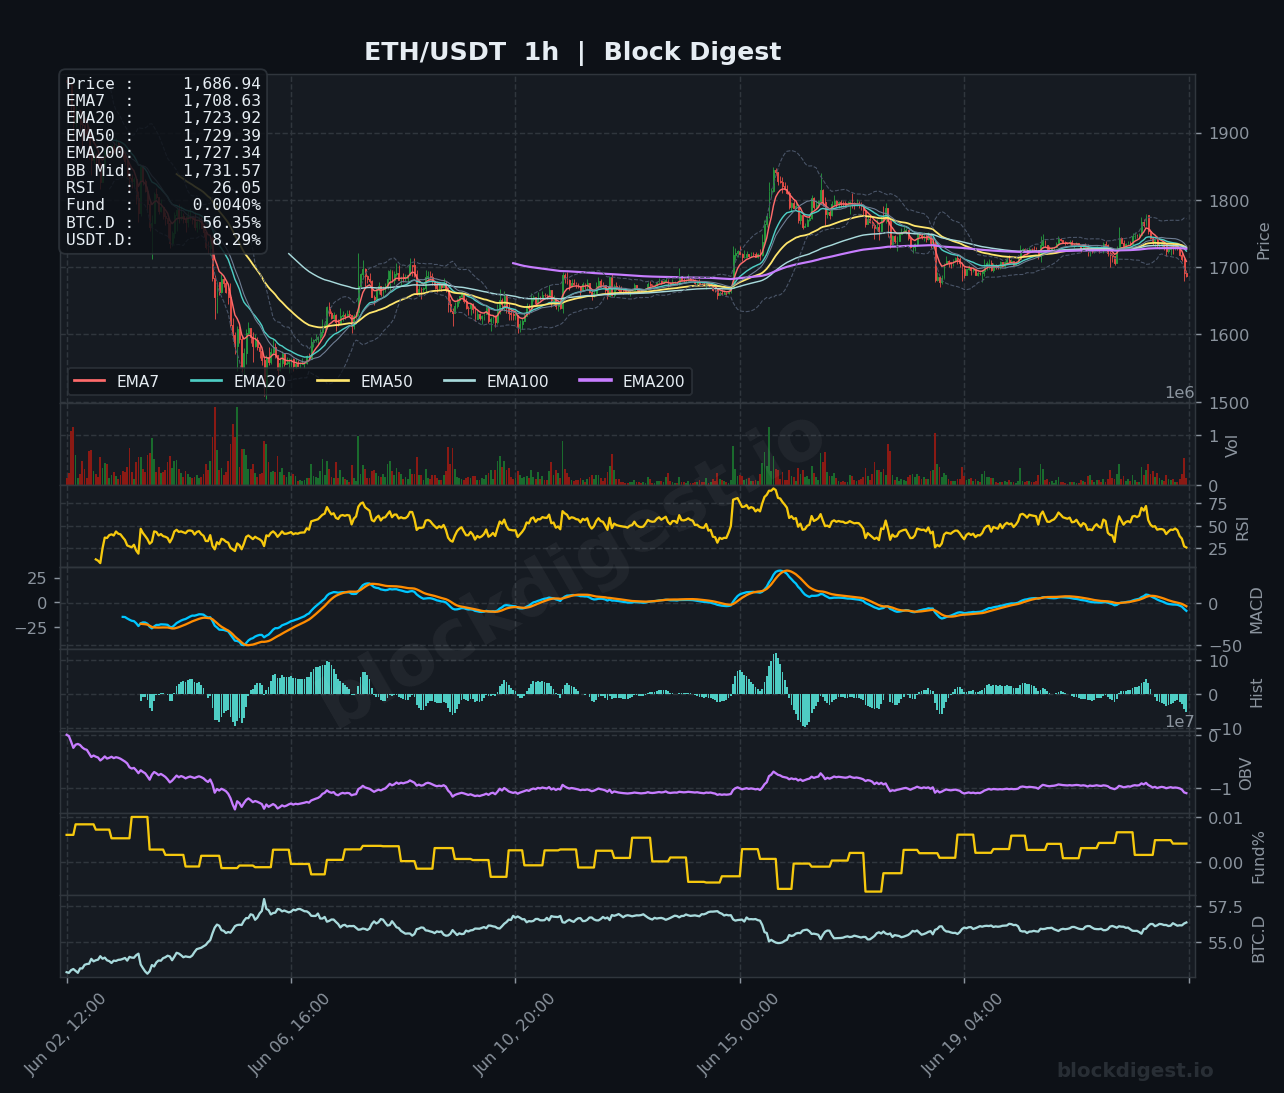
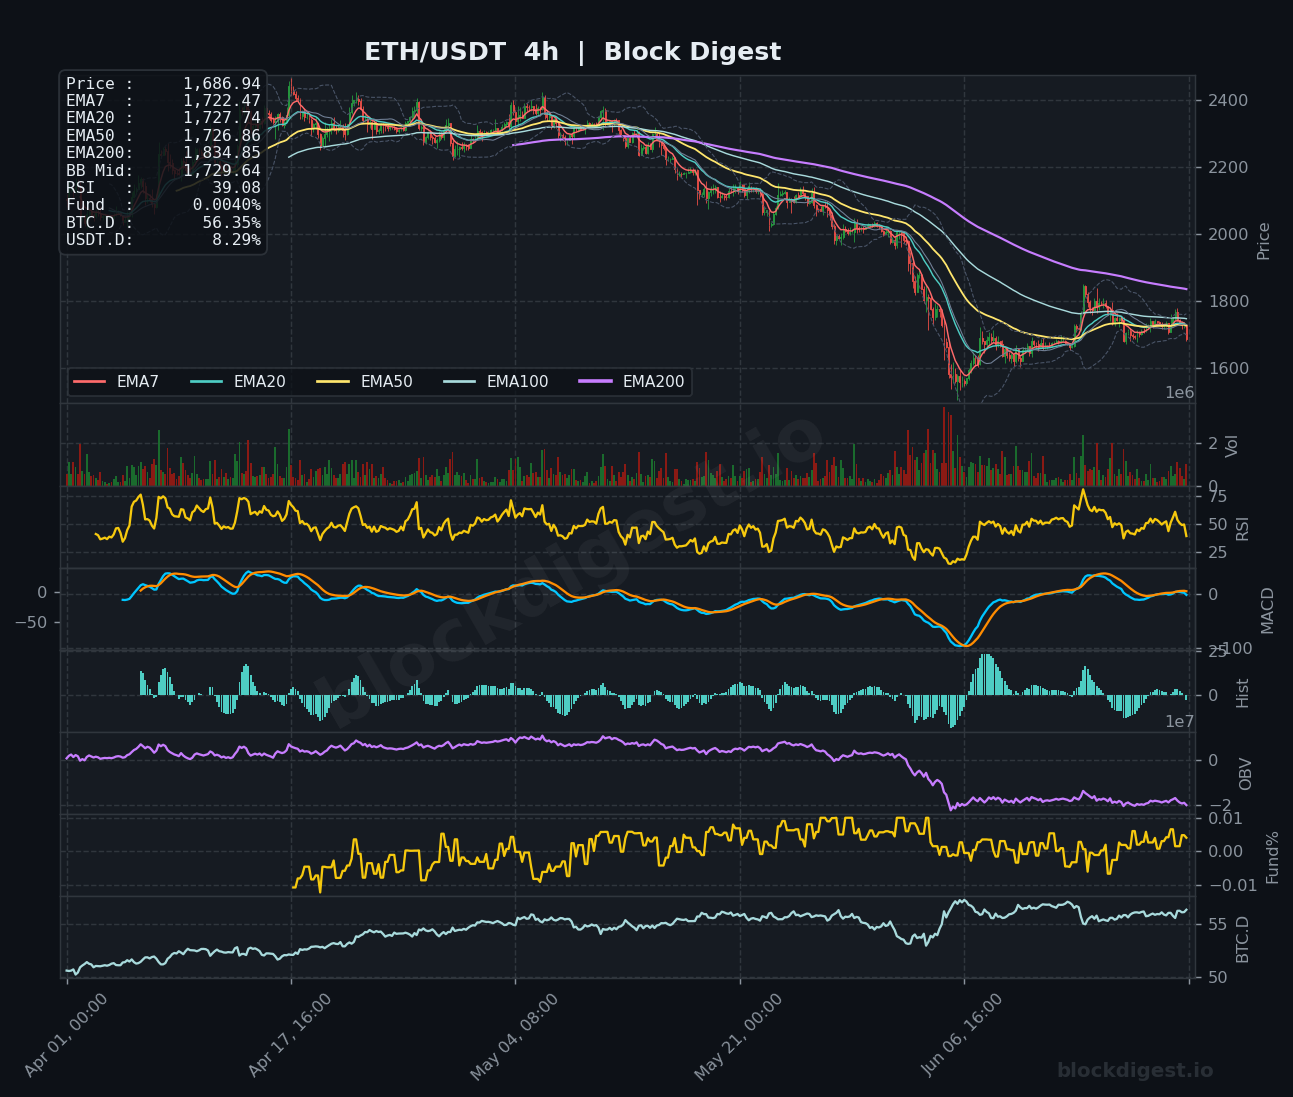
Across all three timeframes, the EMA stack is uniformly bearish: price trades below the EMA7, EMA20, EMA50, and EMA200 on the 1h, 4h, and 1d charts simultaneously, with no meaningful bullish crossover visible. On the 4h chart, the EMA200 at $1,834.85 represents a formidable overhead barrier, reinforced by the EMA7 ($1,722.47) and EMA20 ($1,727.74) sitting just above current price and acting as dynamic resistance. The 1h timeframe shows a brief consolidation around the $1,686–$1,730 zone, but the short-term structure has failed to reclaim the cluster of EMAs sitting between $1,708 and $1,729, suggesting that intraday bounces are being sold into rather than accumulated. There is no meaningful bullish divergence between short-term momentum and the higher-timeframe downtrend at this stage.
Key Levels to Watch
- Resistance: $1,727–$1,731 — confluent 1h EMA cluster (EMA20, EMA50, EMA200) aligning with the 1h Bollinger Band midline; a rejection here would re-confirm bearish control
- Resistance: $1,755–$1,760 — daily EMA20, a level that has capped multiple recovery attempts in recent weeks and carries significant weight on the macro timeframe
- Resistance: $1,834–$1,840 — 4h EMA200 and a key structural pivot zone; reclaiming this level would materially shift the intermediate-term outlook
- Support: $1,680–$1,687 — current price vicinity and recent consolidation floor; a decisive close below here opens the door to further downside
- Support: $1,620–$1,640 — prior swing lows visible on the 1h chart from earlier in the observed window; a logical next demand zone if current support fails
- Support: $1,550–$1,580 — deeper macro support derived from the daily chart’s lower Bollinger Band extension and historical price memory from early 2025
Momentum & On-Chain Signals
The 1h RSI is deeply oversold at 26.05, a reading that historically flags short-term exhaustion and the potential for a mean-reversion bounce, though oversold conditions alone do not confirm a reversal. On the 4h timeframe, RSI sits at 39.08 — not yet oversold, suggesting there is room for further downside without triggering a technical floor on this timeframe. The daily RSI at 38.61 mirrors this, hovering near but not at oversold extremes, indicating the macro downtrend retains momentum. The 4h OBV registered a sharp decline coinciding with the most recent leg down, pointing to clear distribution rather than accumulation, while the 1h OBV has stabilized but shows no meaningful uptick — funding rate at +0.0040% is near neutral, reflecting a lack of aggressive directional positioning from futures participants.
BTC Dominance & Market Sentiment
BTC dominance is currently at 56.35%, a reading that has been trending higher over the observed multi-month period on the 4h chart, suggesting capital continues to rotate toward Bitcoin at the expense of altcoins like ETH. USDT dominance at 8.29% remains elevated, indicating a meaningful portion of market participants are sitting in stablecoins — a risk-off posture that does not favor aggressive ETH buying. Together, these readings suggest the broader altcoin market remains under pressure, and ETH is unlikely to stage a sustained recovery without a meaningful shift in BTC dominance dynamics.
Risk Scenarios
- Bullish case: A sustained hourly close above $1,731, followed by a reclaim of the $1,755 daily EMA20, would signal short-term trend exhaustion giving way to a relief rally targeting the $1,834–$1,840 4h EMA200 zone; confirmation would require improving OBV and RSI holding above 45 on the 4h.
- Bearish case: A decisive break and close below $1,680 on the 4h timeframe would invalidate current support and expose the $1,620–$1,640 demand zone, with an extended move potentially targeting the $1,550–$1,580 region if selling pressure accelerates.
Outlook
The weight of evidence across all three timeframes points to a cautiously bearish bias, with ETH trading beneath a uniformly bearish EMA stack and showing no confirmed structural reversal signal as of June 23, 2026. The 1h oversold RSI at 26 may generate a short-term technical bounce into the $1,720–$1,731 resistance cluster, but any such move should be treated as a potential selling opportunity unless accompanied by meaningful volume and OBV expansion. The critical level to watch in the next 24–48 hours is the $1,731 1h EMA confluence zone on the upside and $1,680 on the downside — a clean break of either will define the next directional move. Until price can convincingly reclaim the $1,755 daily EMA20, the path of least resistance remains to the downside.
Disclaimer: This analysis is for informational purposes only and does not constitute financial advice. Cryptocurrency markets are highly volatile and unpredictable. All trading decisions should be made based on your own research and risk tolerance. Block Digest is not responsible for any financial losses incurred as a result of acting on this content.
Stay Ahead of the Market
Follow BlockDigest for crypto market intelligence, research and real-time updates.


