
Market Context
The broader altcoin market is operating under notable pressure as of June 25, 2026, with BTC dominance holding at 56.43% — a level that continues to suppress meaningful capital rotation into alts. USDT dominance at 8.43% indicates a defensive posture from market participants, with liquidity remaining on the sidelines rather than flowing aggressively into risk assets. The overall picture across the six assets reviewed is one of sustained downtrends on higher timeframes, with only isolated pockets of near-term stabilization.
Solana (SOL)
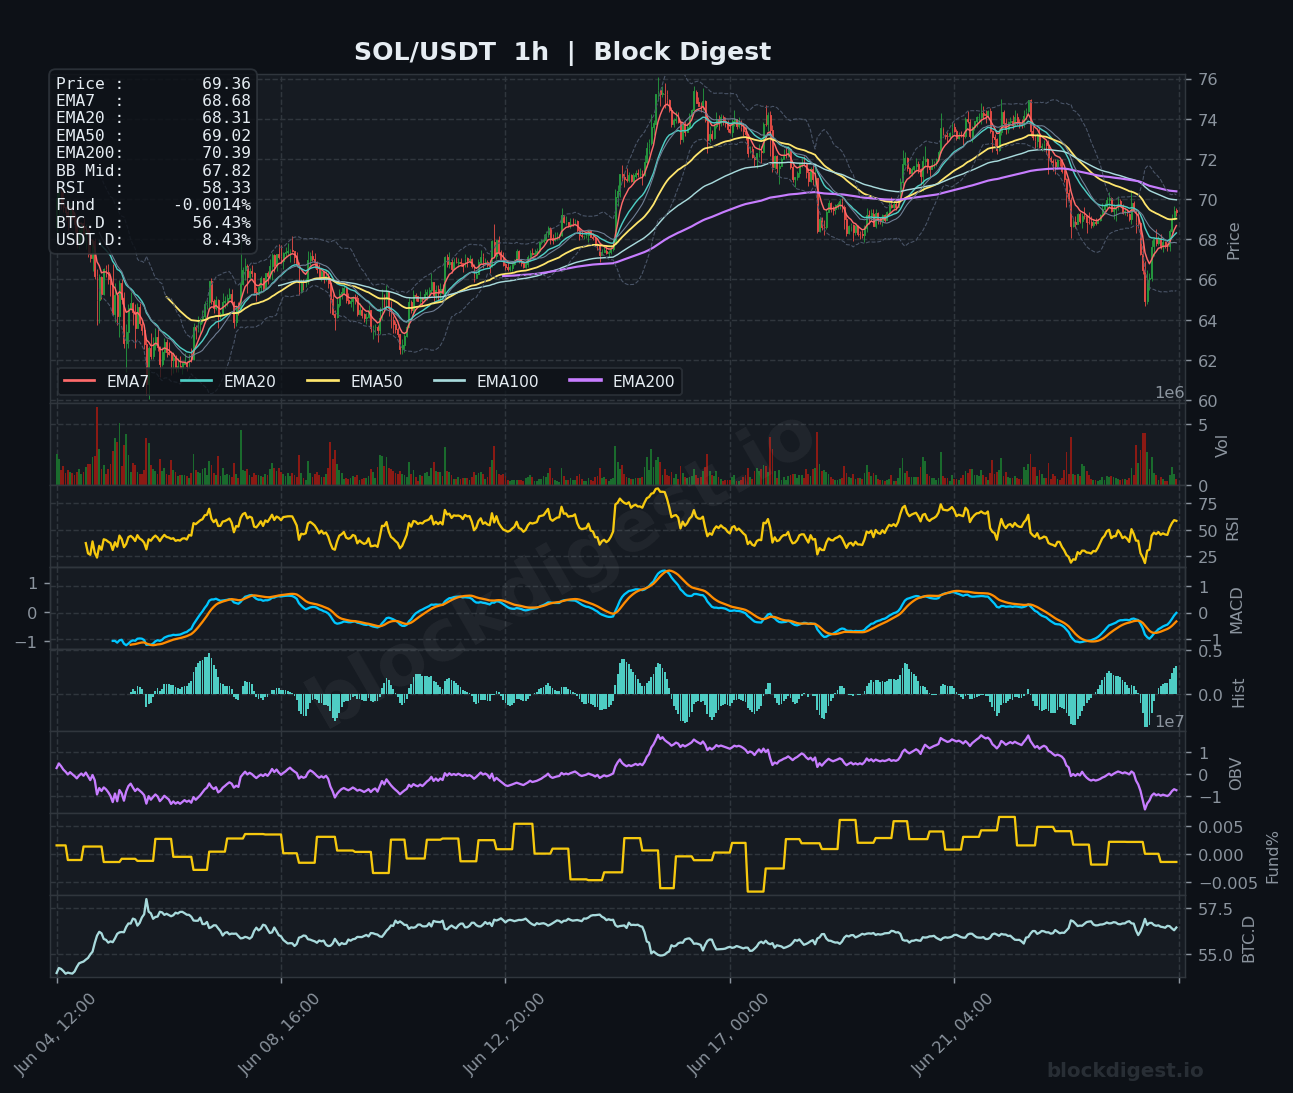
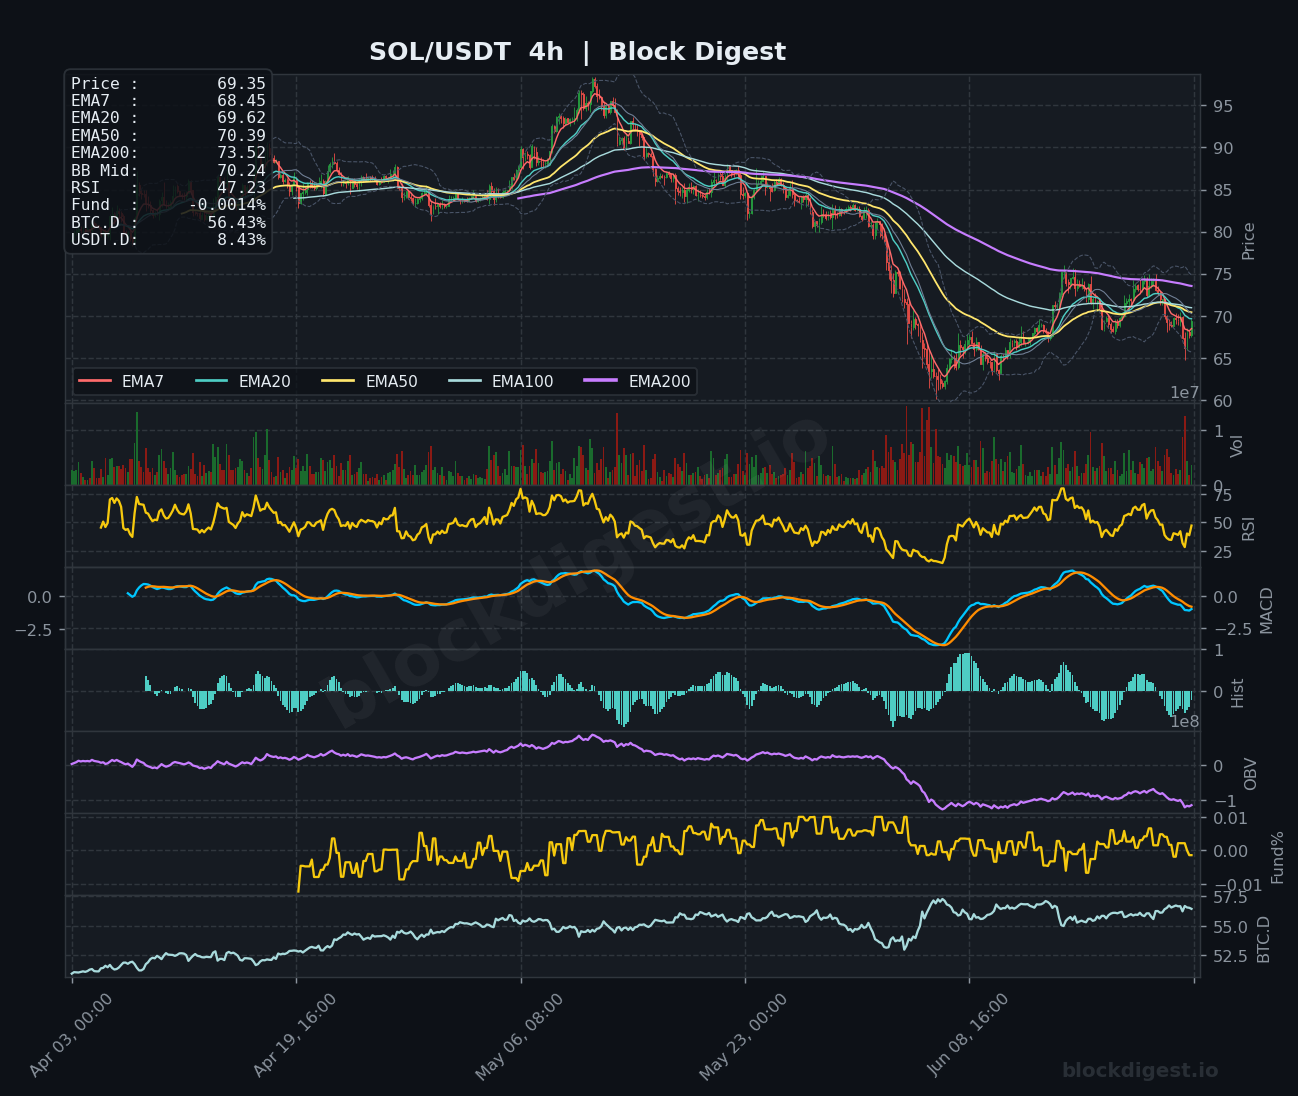
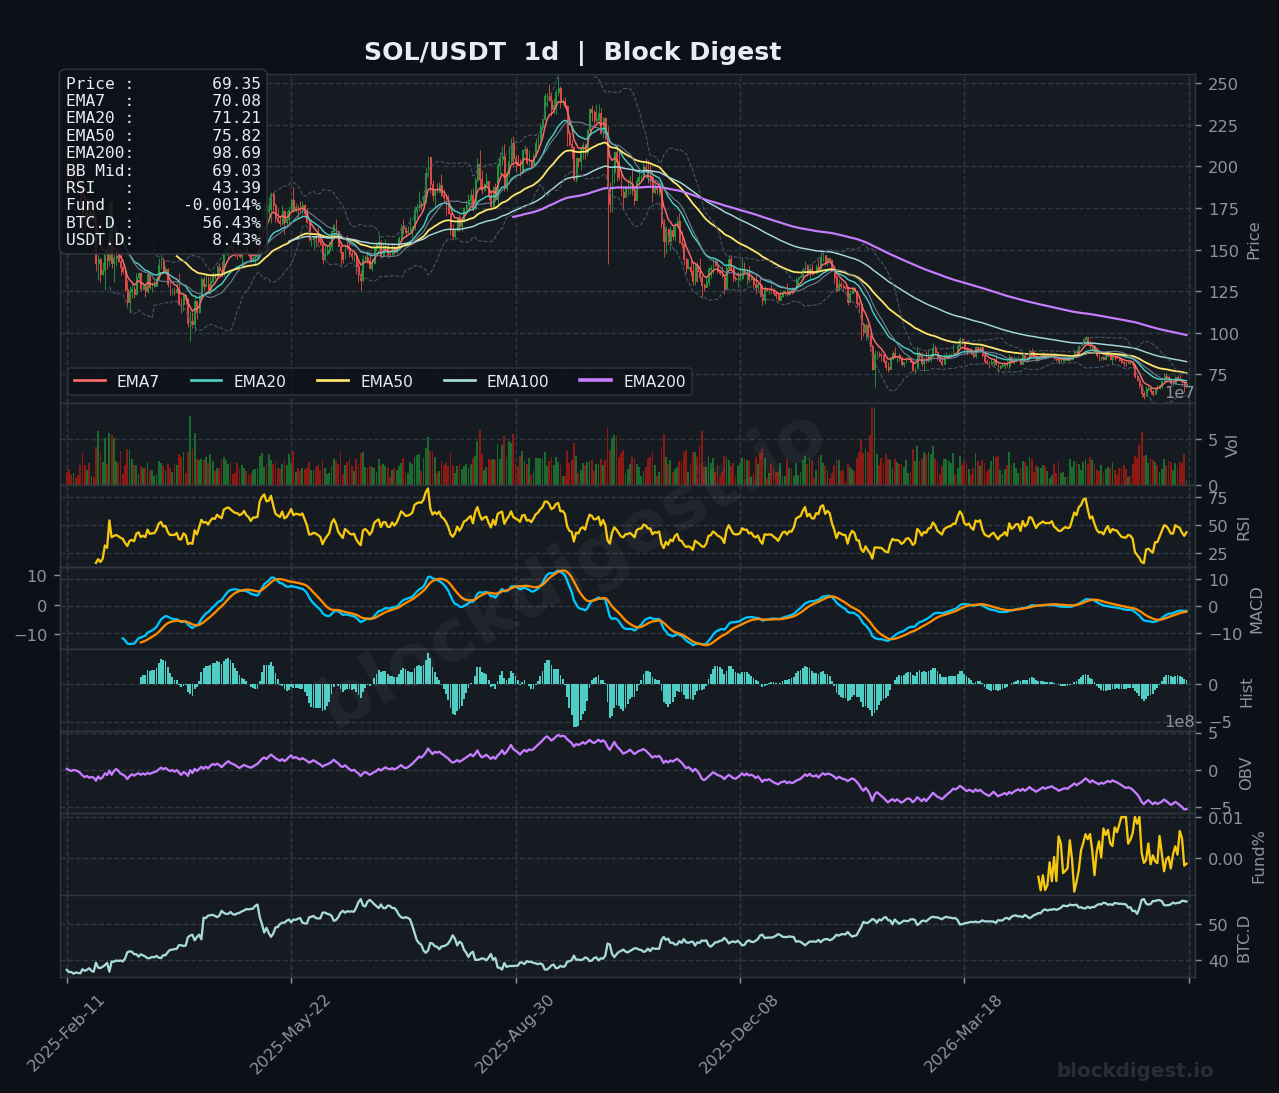
SOL is trading at $69.35, caught in a difficult position below its EMA50 ($70.39) and EMA200 ($98.69) on the daily chart, with all major moving averages in a bearish stack that has been in place for several months. The 4h RSI sits at 47.23 and MACD remains in negative territory, confirming that the intermediate trend is still decisively bearish following a sharp sell-off from highs above $95. On the 1h chart, RSI has recovered modestly to 58.33 and short-term EMAs are beginning to tighten near $69, suggesting a minor relief bounce attempt is underway, though the OBV decline on both the 1h and 4h frames signals that buying volume remains weak. Key resistance sits at the EMA50 near $70.39, with downside risk toward the $64–$65 range if that level fails to hold.
XRP (XRP)
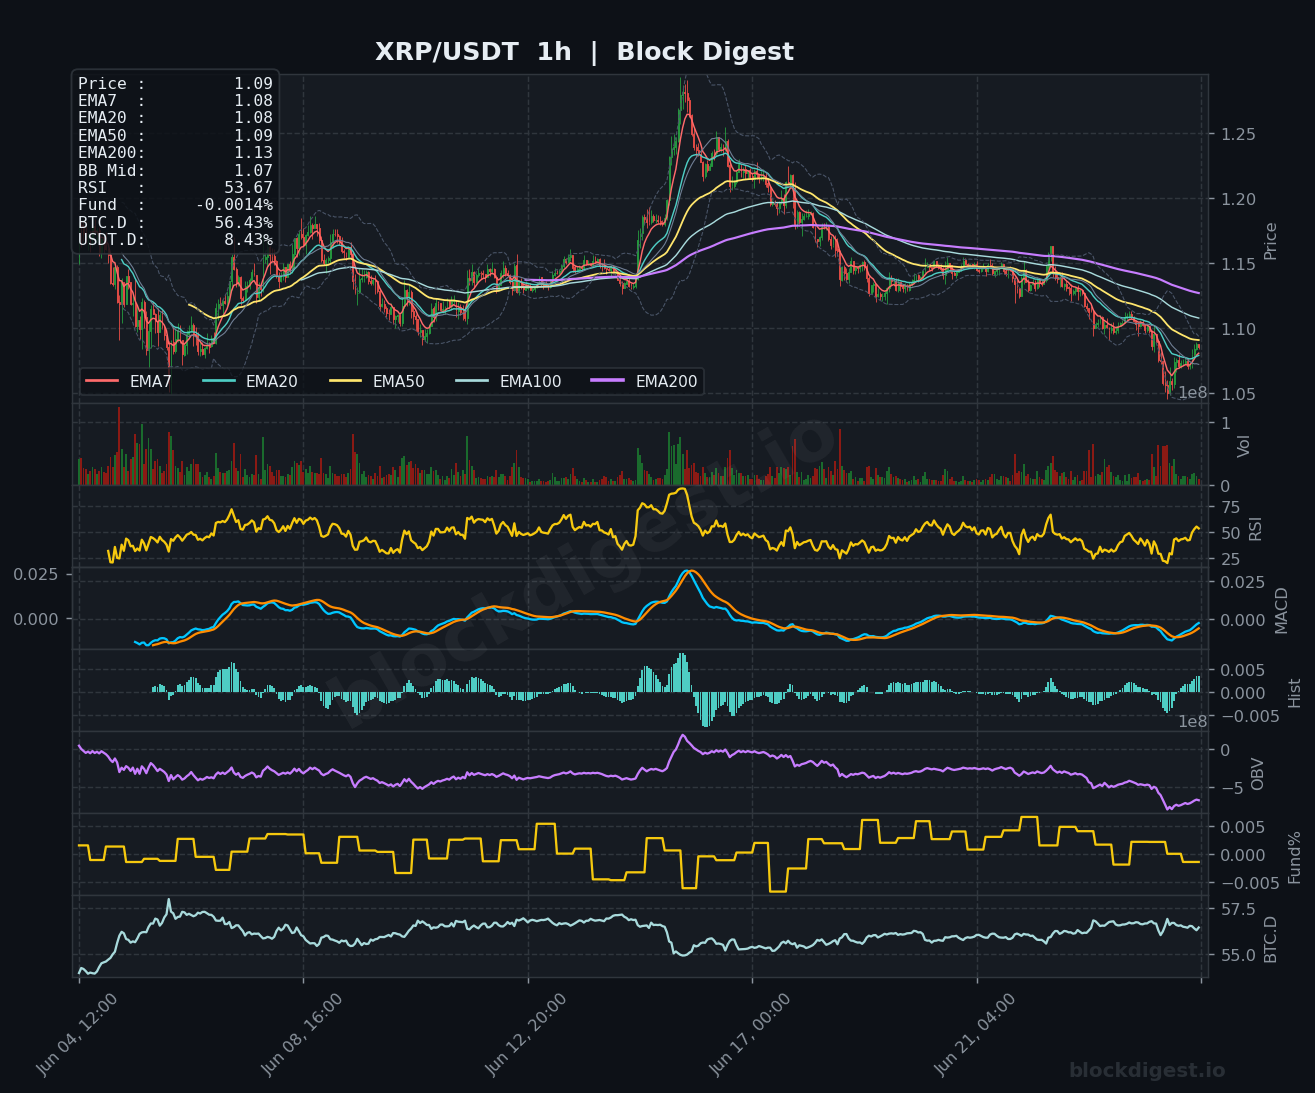
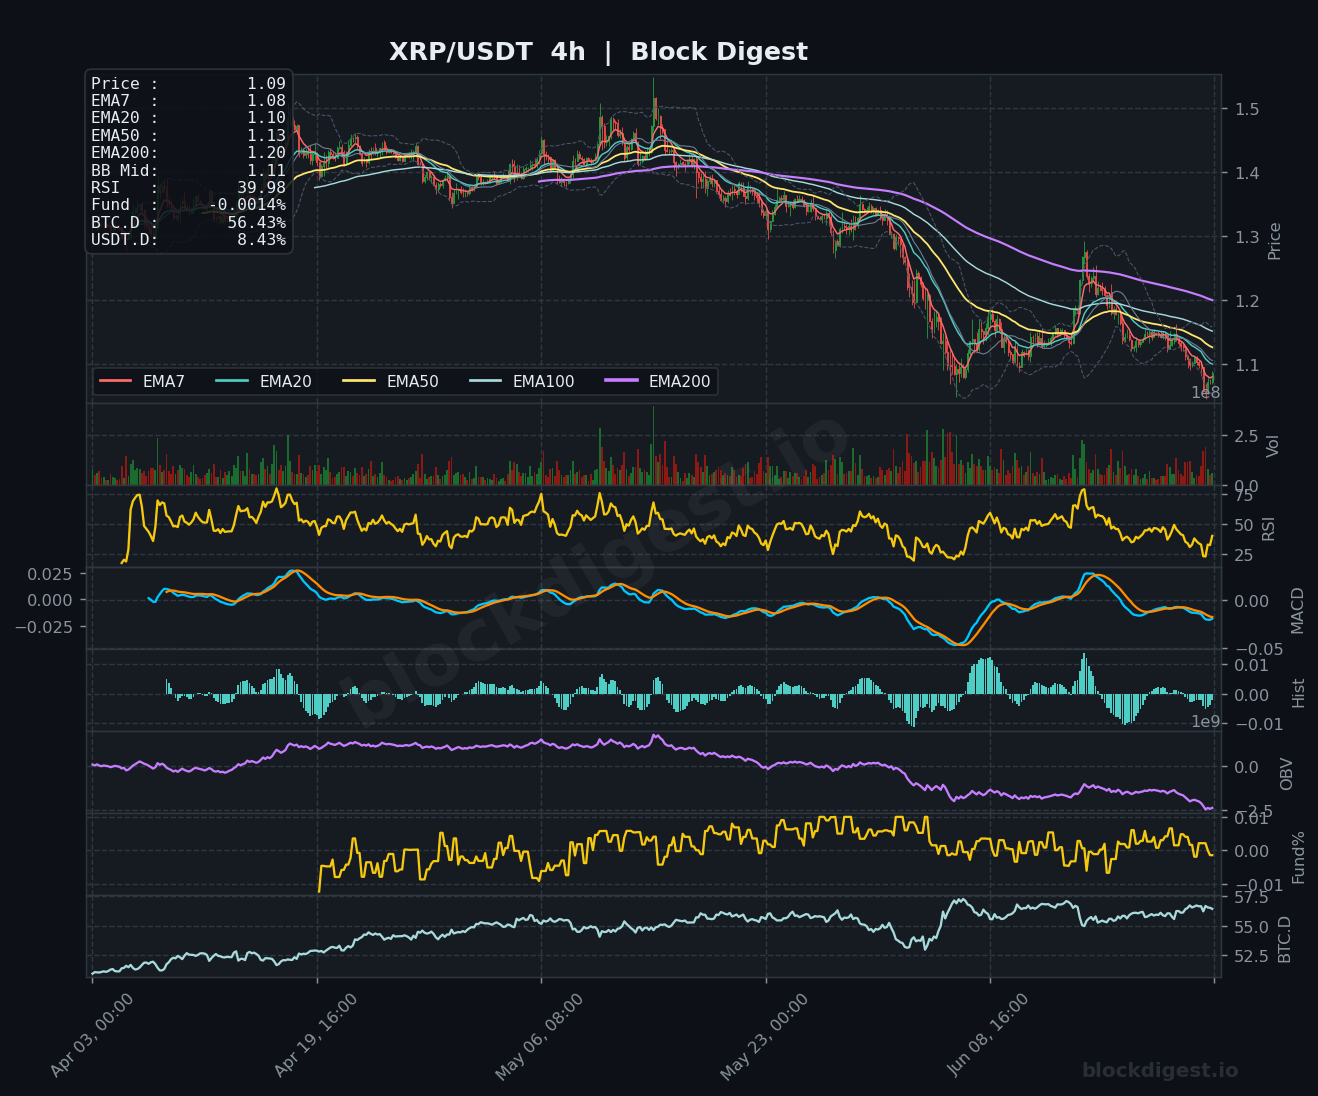
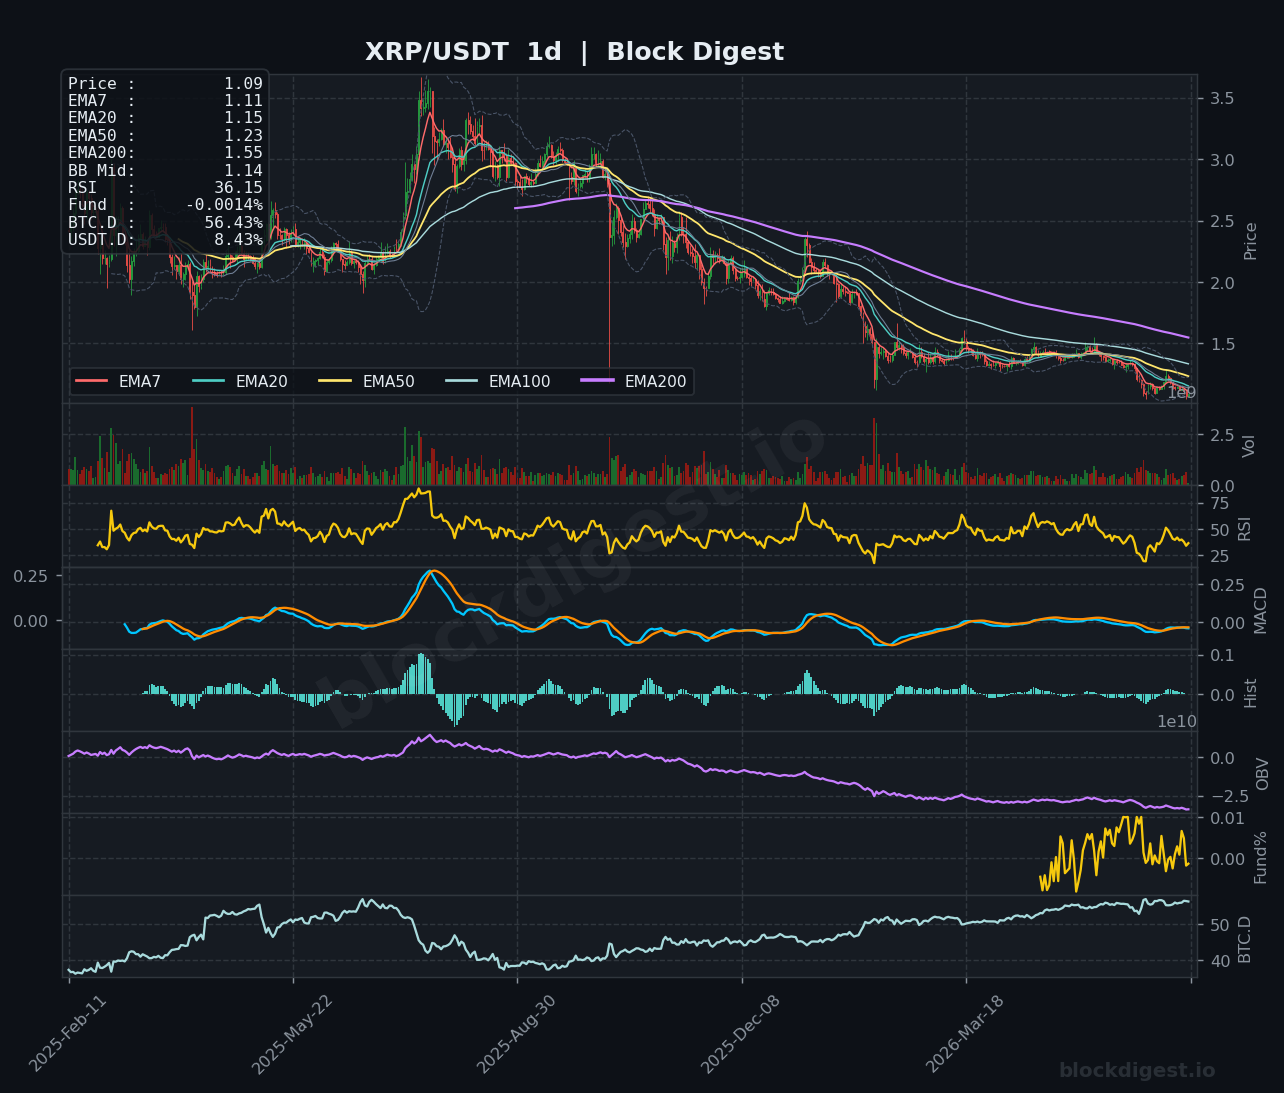
XRP is trading at $1.09, deep in a multi-month downtrend that has seen price fall from highs above $3.00 on the daily chart, with the EMA200 now a distant overhead obstacle at $1.55. The daily RSI at 36.15 is approaching oversold territory but has not yet triggered a convincing reversal signal, and the MACD remains in bearish alignment with the signal line still declining. On the 4h timeframe, RSI reads 39.98 with price trading below all key EMAs — EMA20 at $1.10, EMA50 at $1.13, and EMA200 at $1.20 — confirming broad-based selling pressure with no meaningful recovery structure in place. The 1h OBV trend is sharply declining, reinforcing a bearish short-term bias; bulls need to reclaim the $1.13 zone to shift momentum, with initial support at the $1.05–$1.07 region.
BNB (BNB)
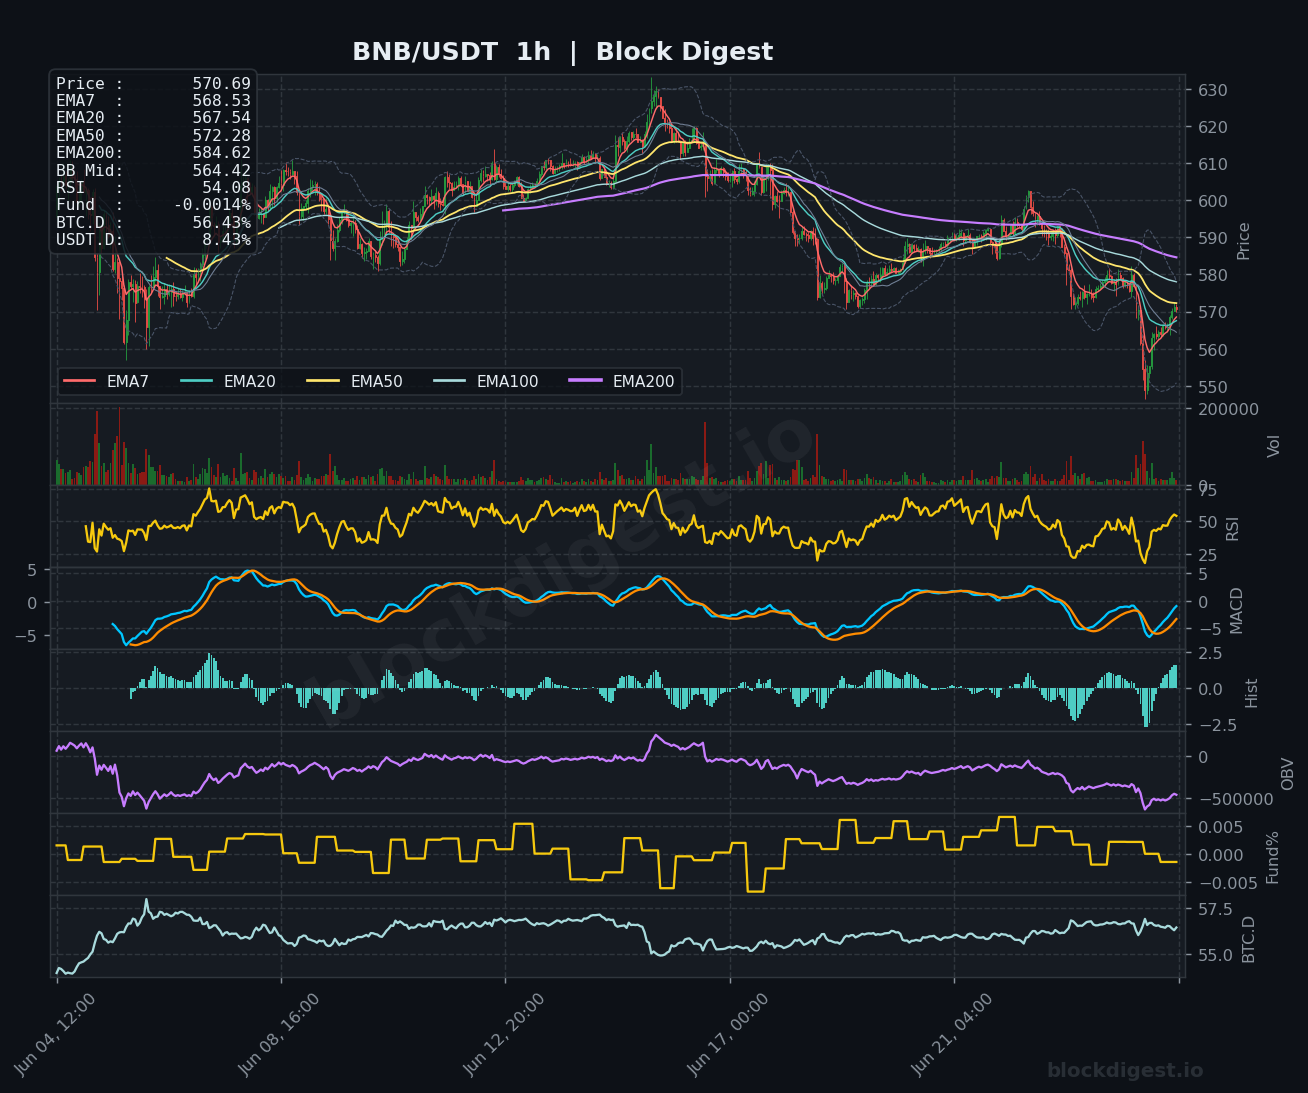
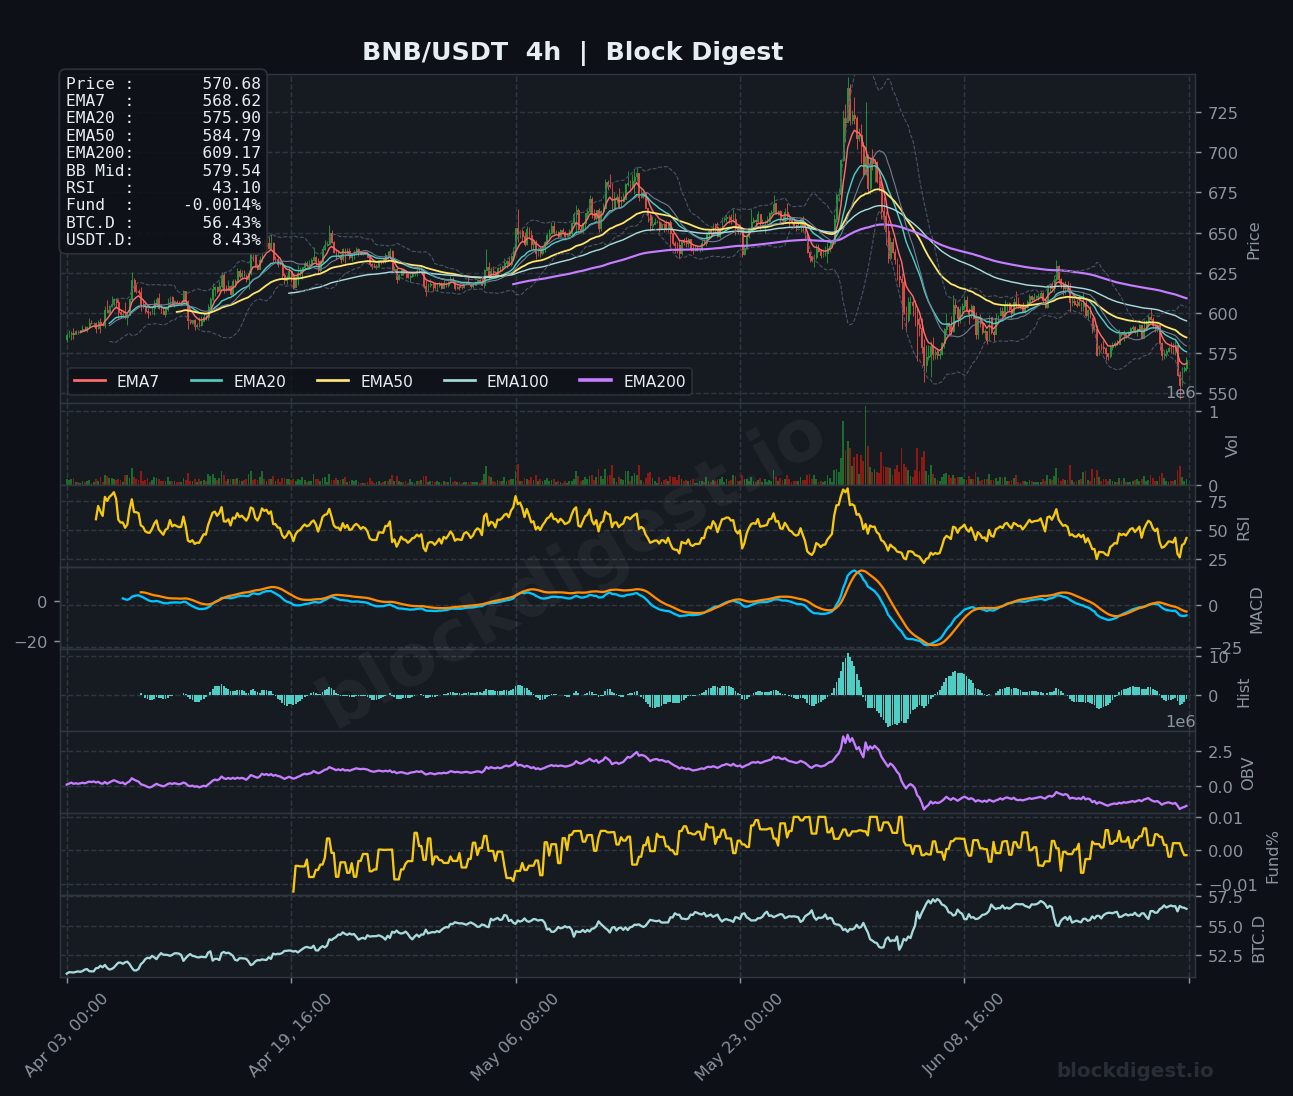
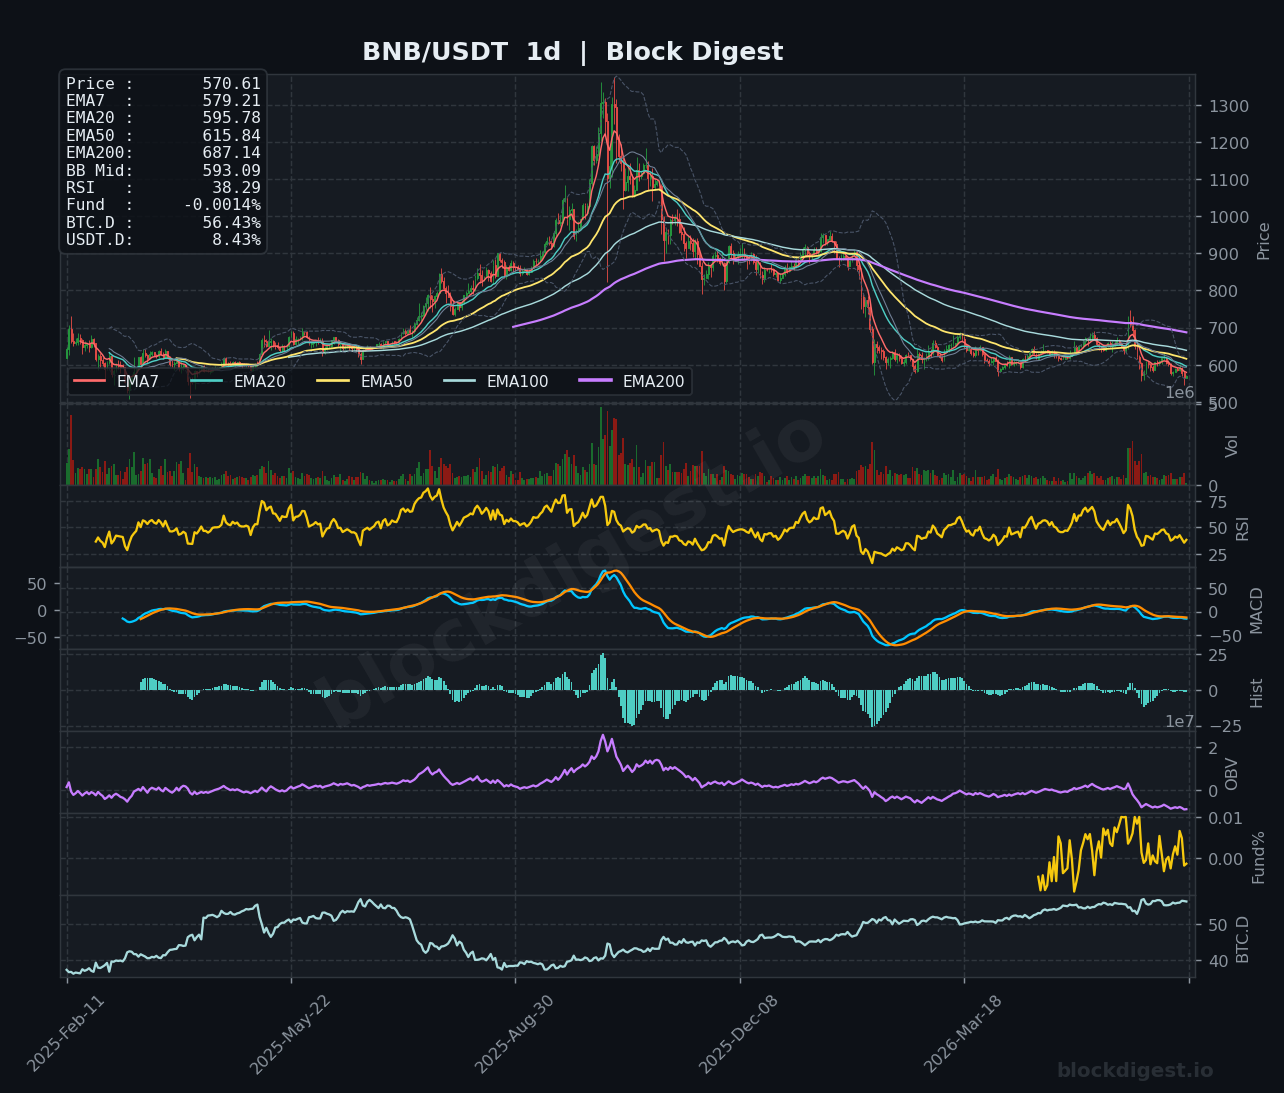
BNB is trading at $570.69, having pulled back sharply from its earlier spike high near $725 on the 4h chart, and is now trading below its EMA20 ($575.90), EMA50 ($584.79), and EMA200 ($609.17) on that timeframe. The daily RSI at 38.29 reflects weakening momentum, and the MACD on the daily frame is rolling over bearishly, with declining OBV pointing to sustained distribution. On the 1h chart, RSI has stabilized near 54.08 and the MACD histogram is showing early positive bars, hinting at a very short-term bounce attempt around the $570 level. Immediate resistance is clustered between $580 and $585 (EMA20 and EMA50 on the 4h), while a breakdown below $550 would open the door toward the $530 area.
Dogecoin (DOGE)
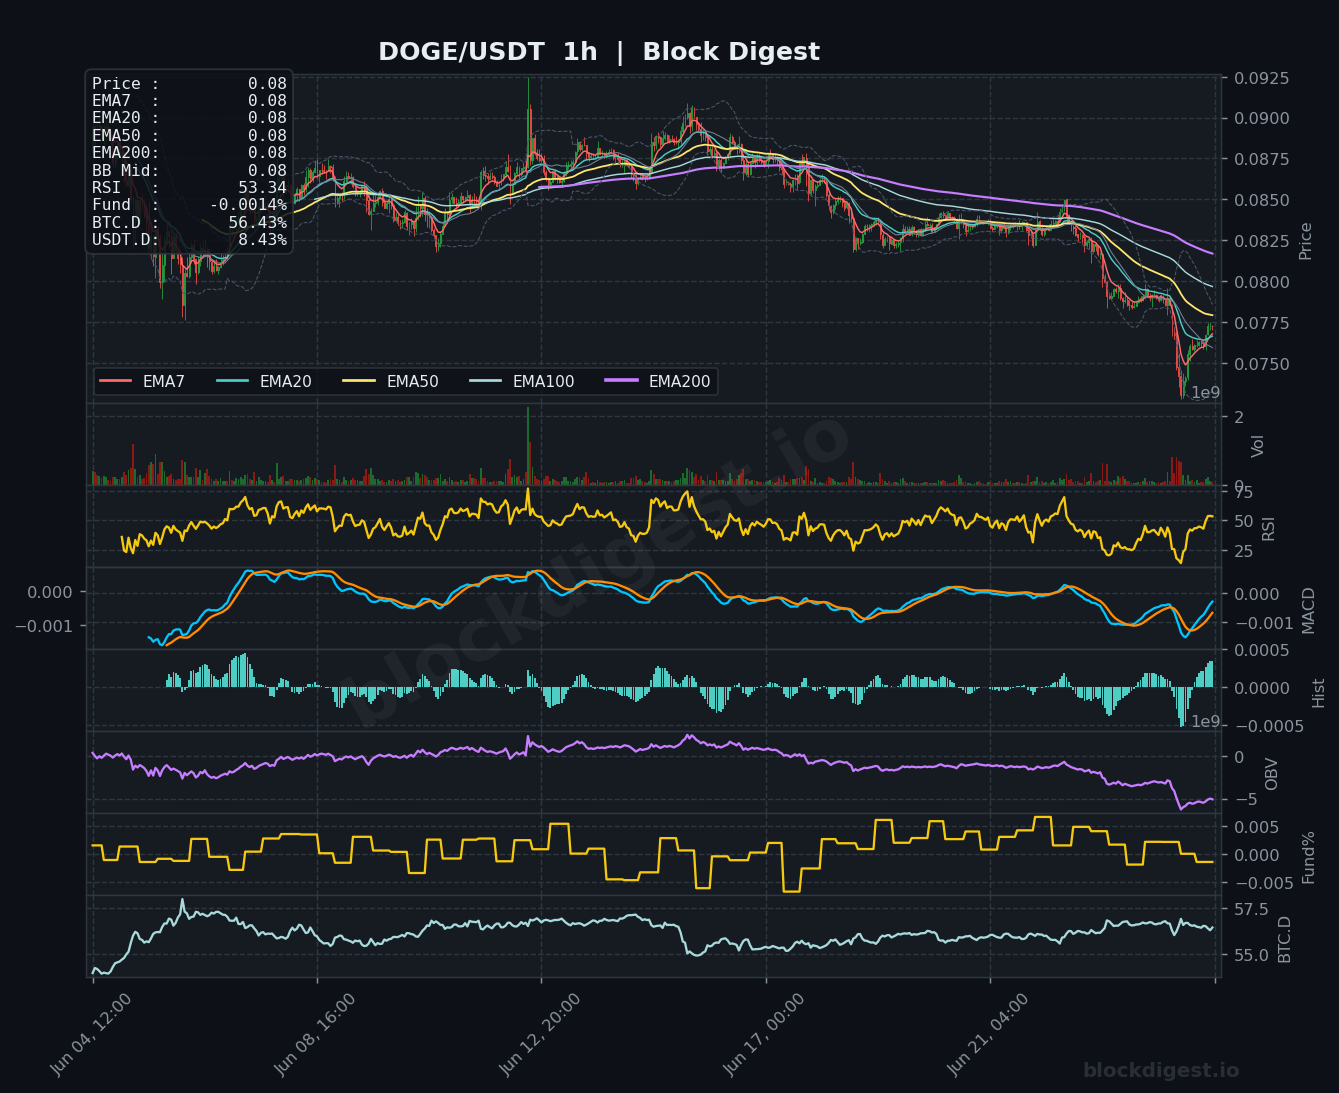
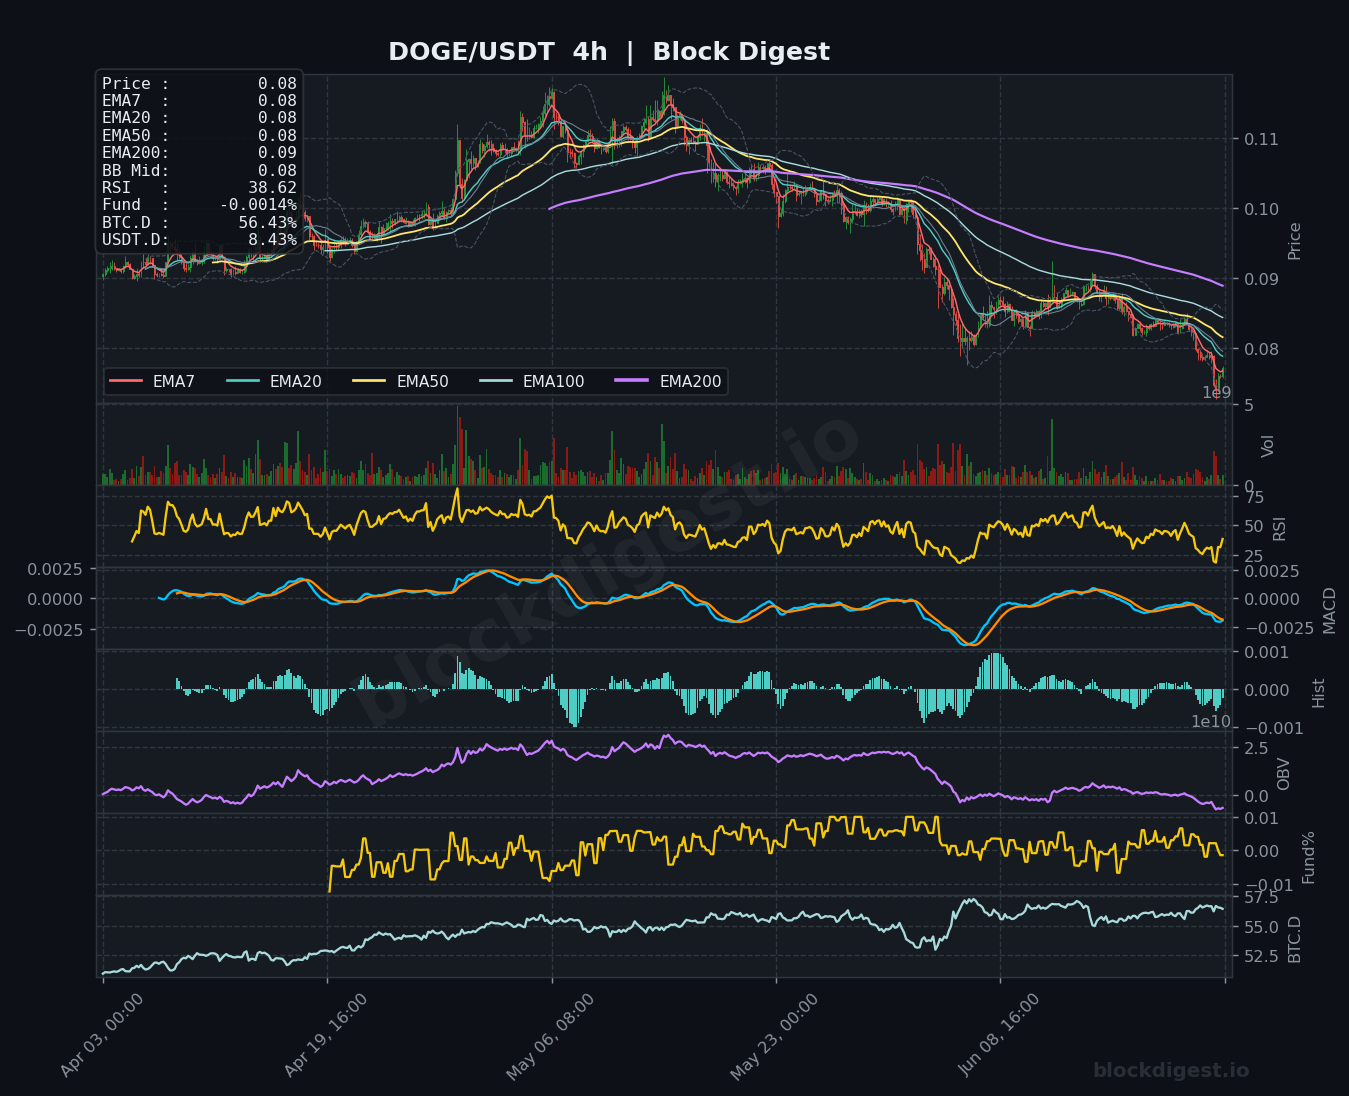
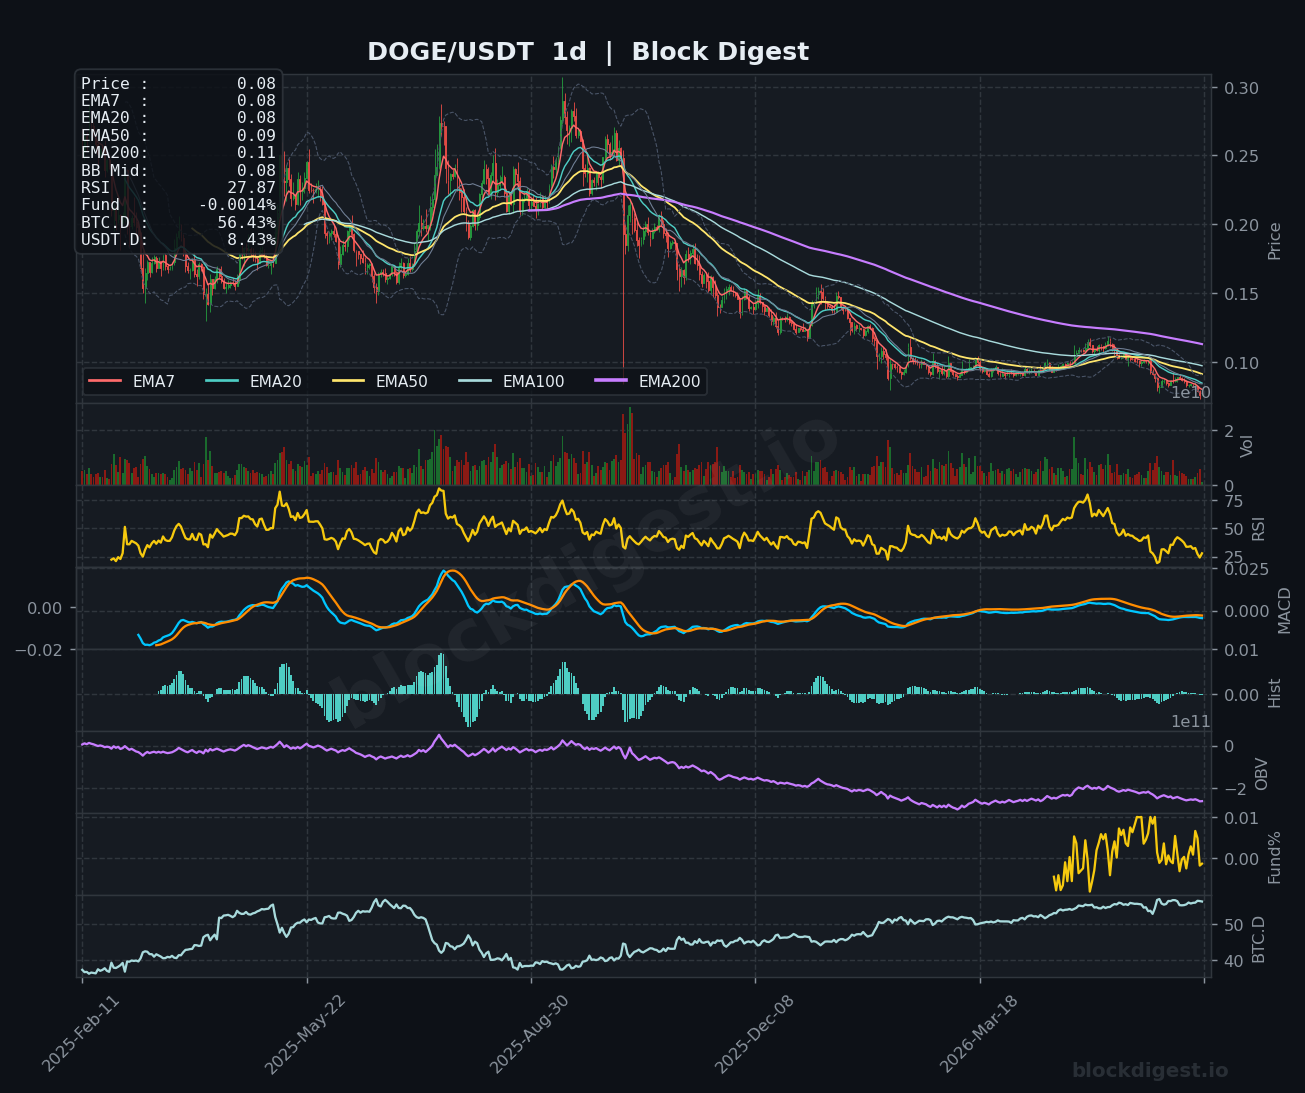
DOGE is trading at $0.08, having suffered a prolonged decline from peak levels near $0.30 on the daily chart, with price now compressing near multi-month lows and all daily EMAs in a firmly bearish descending order. The daily RSI at 27.87 is firmly in oversold territory — the weakest reading among all six assets reviewed today — though the MACD on the daily frame remains below zero with no clear bullish crossover signal yet. The 4h RSI at 38.62 and bearish MACD configuration suggest the intermediate trend remains under pressure, and the OBV on both the 4h and 1h timeframes continues to decline, reflecting persistent selling. While oversold conditions on the daily could prompt a technical bounce, DOGE lacks a credible structural base, and short-term bias remains cautious with the $0.075 level acting as key near-term support.
Litecoin (LTC)
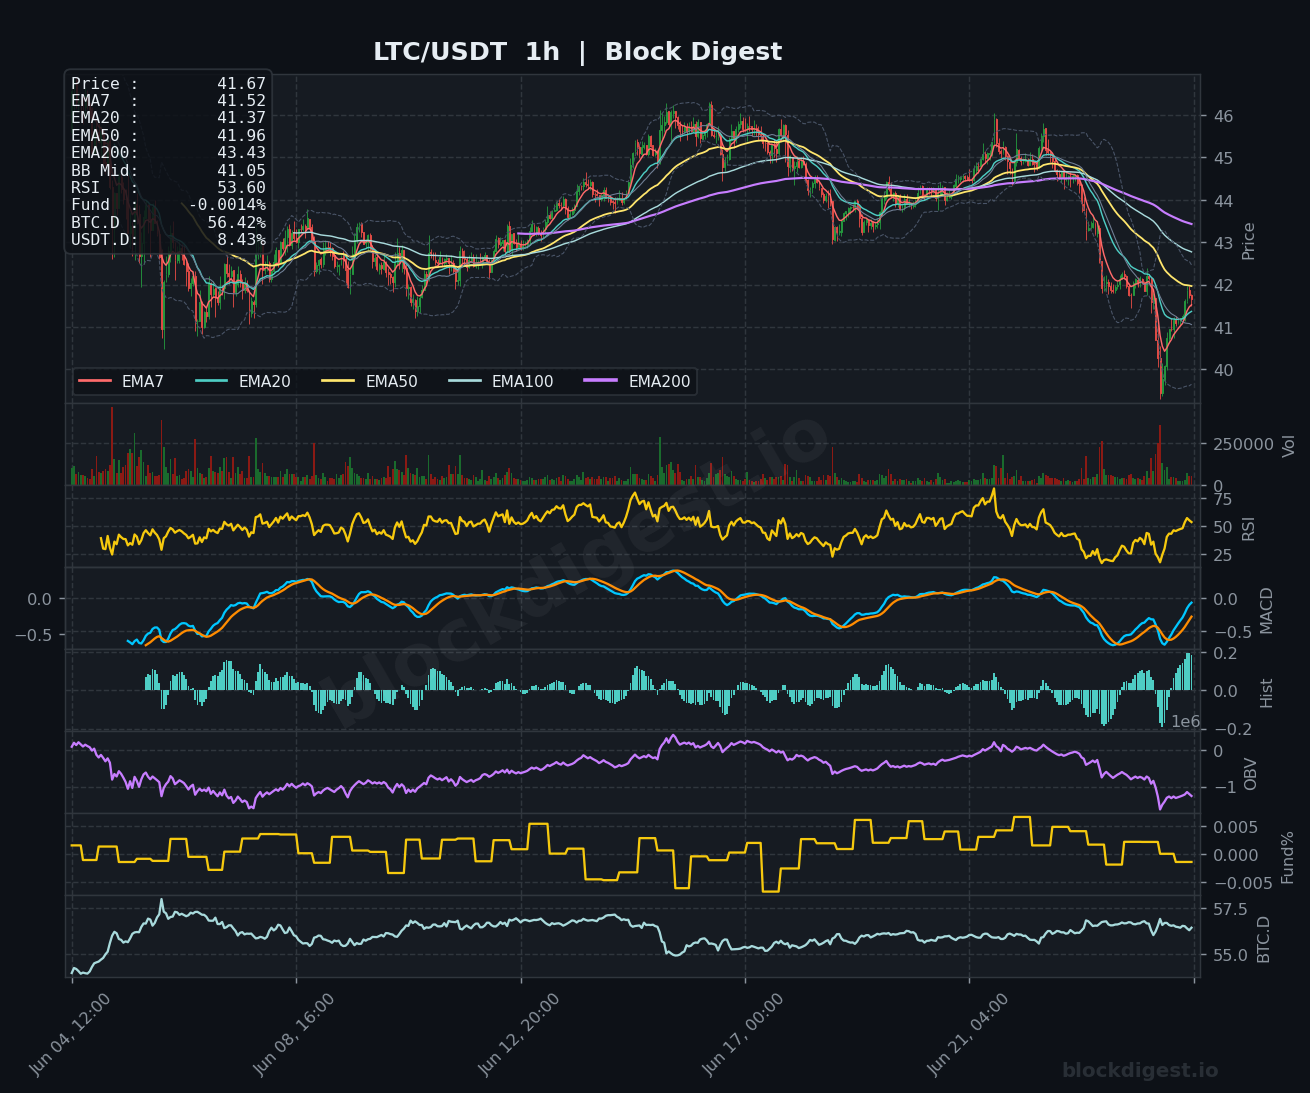
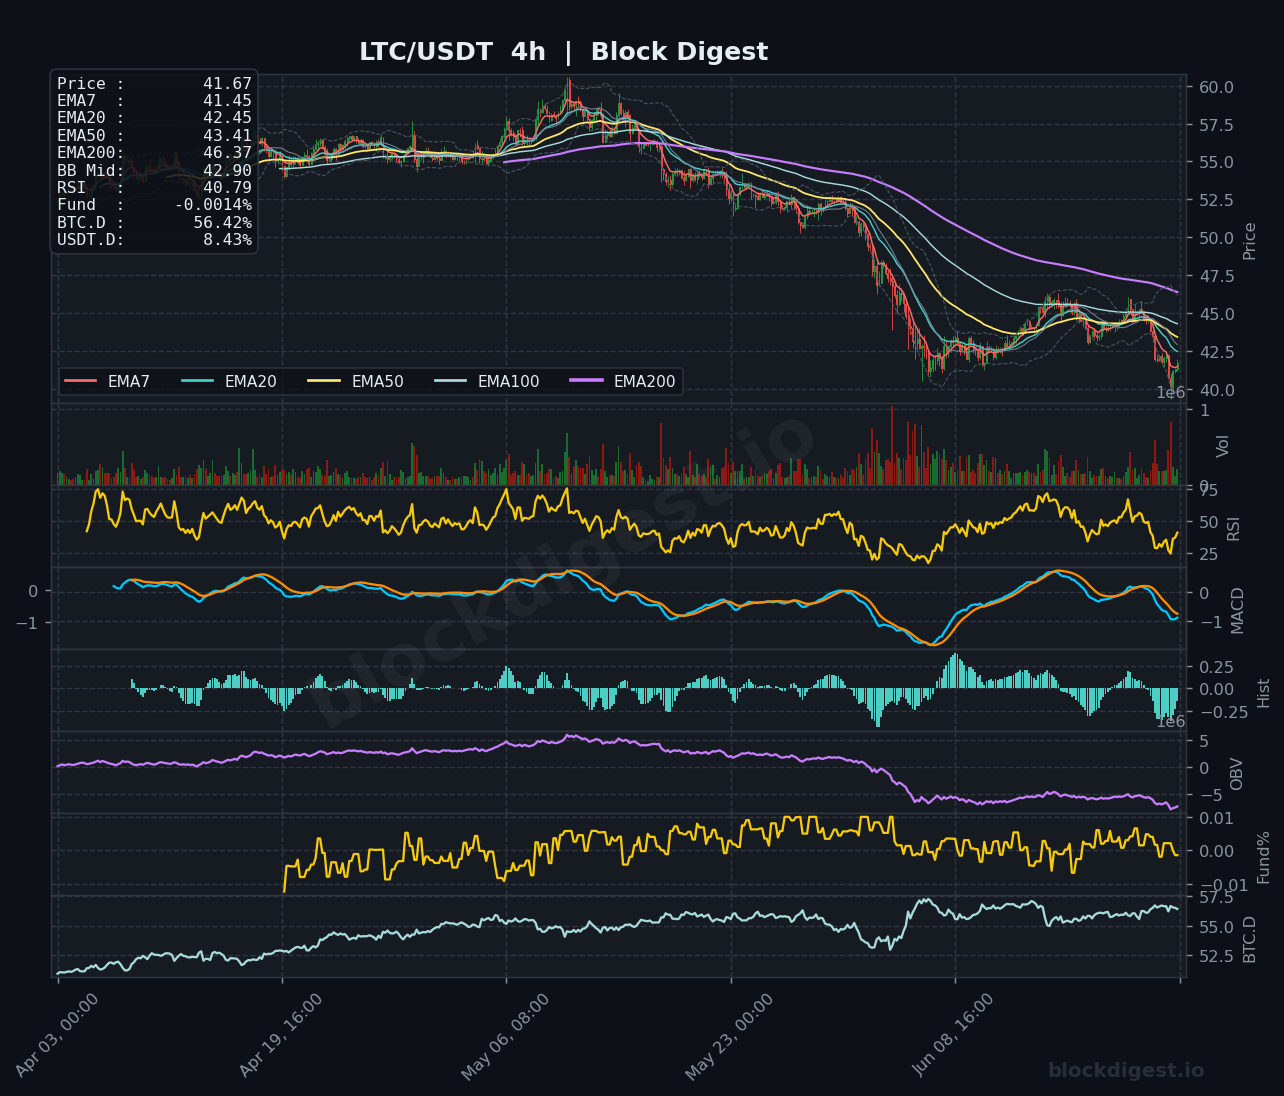
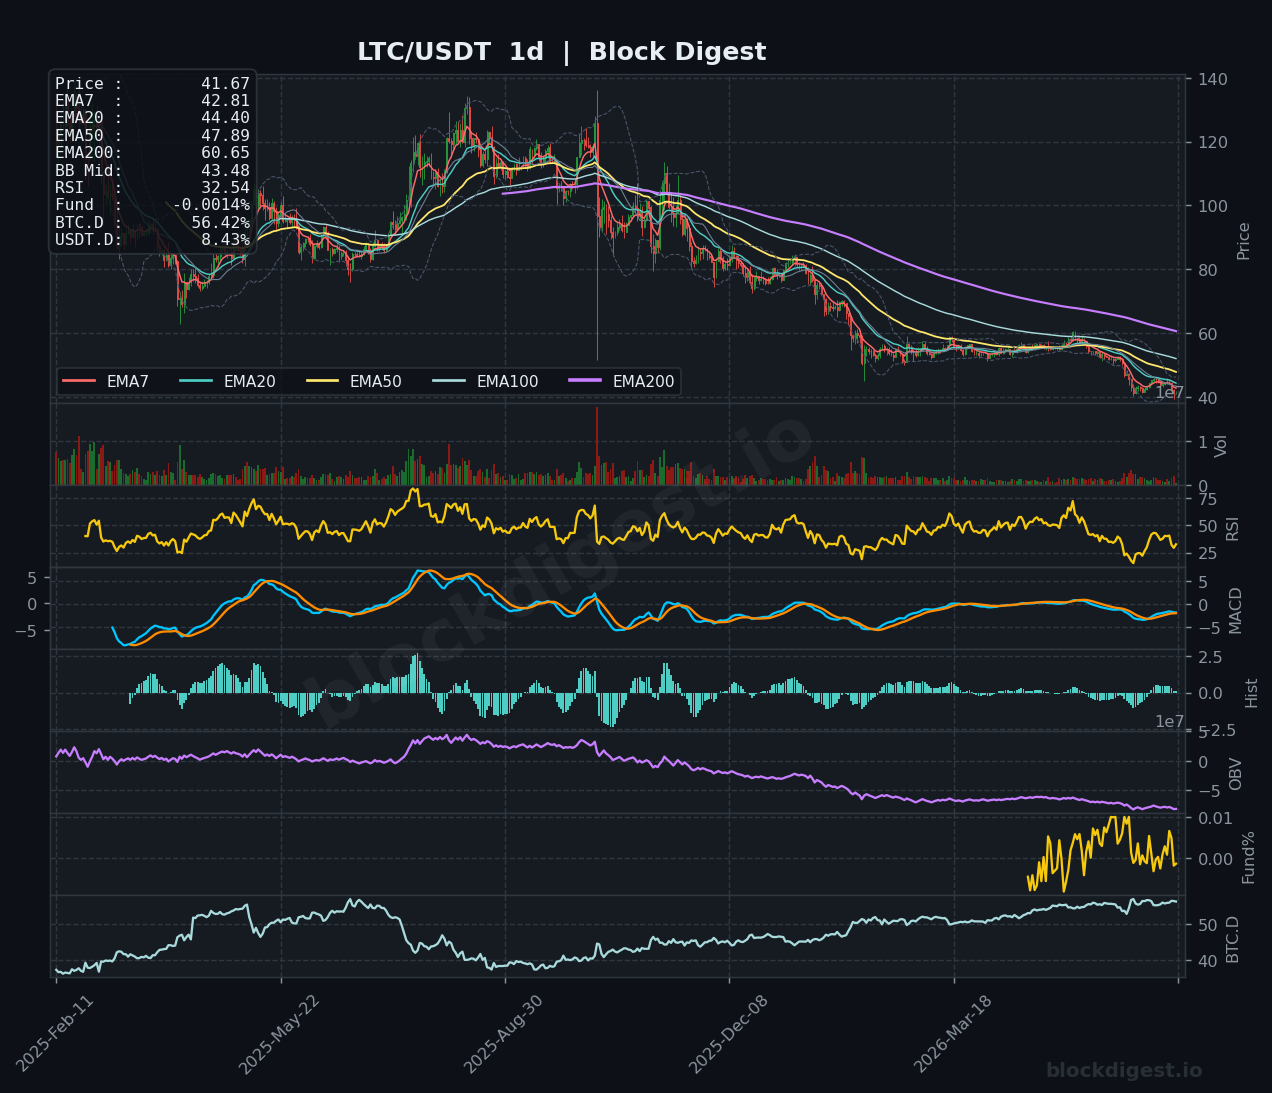
LTC is trading at $41.67, in one of the weakest technical positions across today’s review, with price sitting well below the EMA7 ($42.81), EMA20 ($44.40), EMA50 ($47.89), and a distant EMA200 at $60.65 on the daily chart. The daily RSI at 32.54 is deeply depressed, approaching oversold levels, while the MACD remains in negative territory with minimal signs of a bullish turn; the OBV on the daily continues its steady decline, confirming persistent distribution. On the 4h timeframe, RSI reads 40.79 and the MACD is hovering near the zero line following a bounce attempt, but the overall structure remains bearish with price trading inside a tight range near the lower Bollinger Band. The 1h MACD is showing tentative early signs of a crossover, offering a faint glimmer of near-term stabilization; key resistance is at $42.90 (BB Mid on the 4h) and $43.41 (EMA50 on 4h), with support near $40.
TRON (TRX)
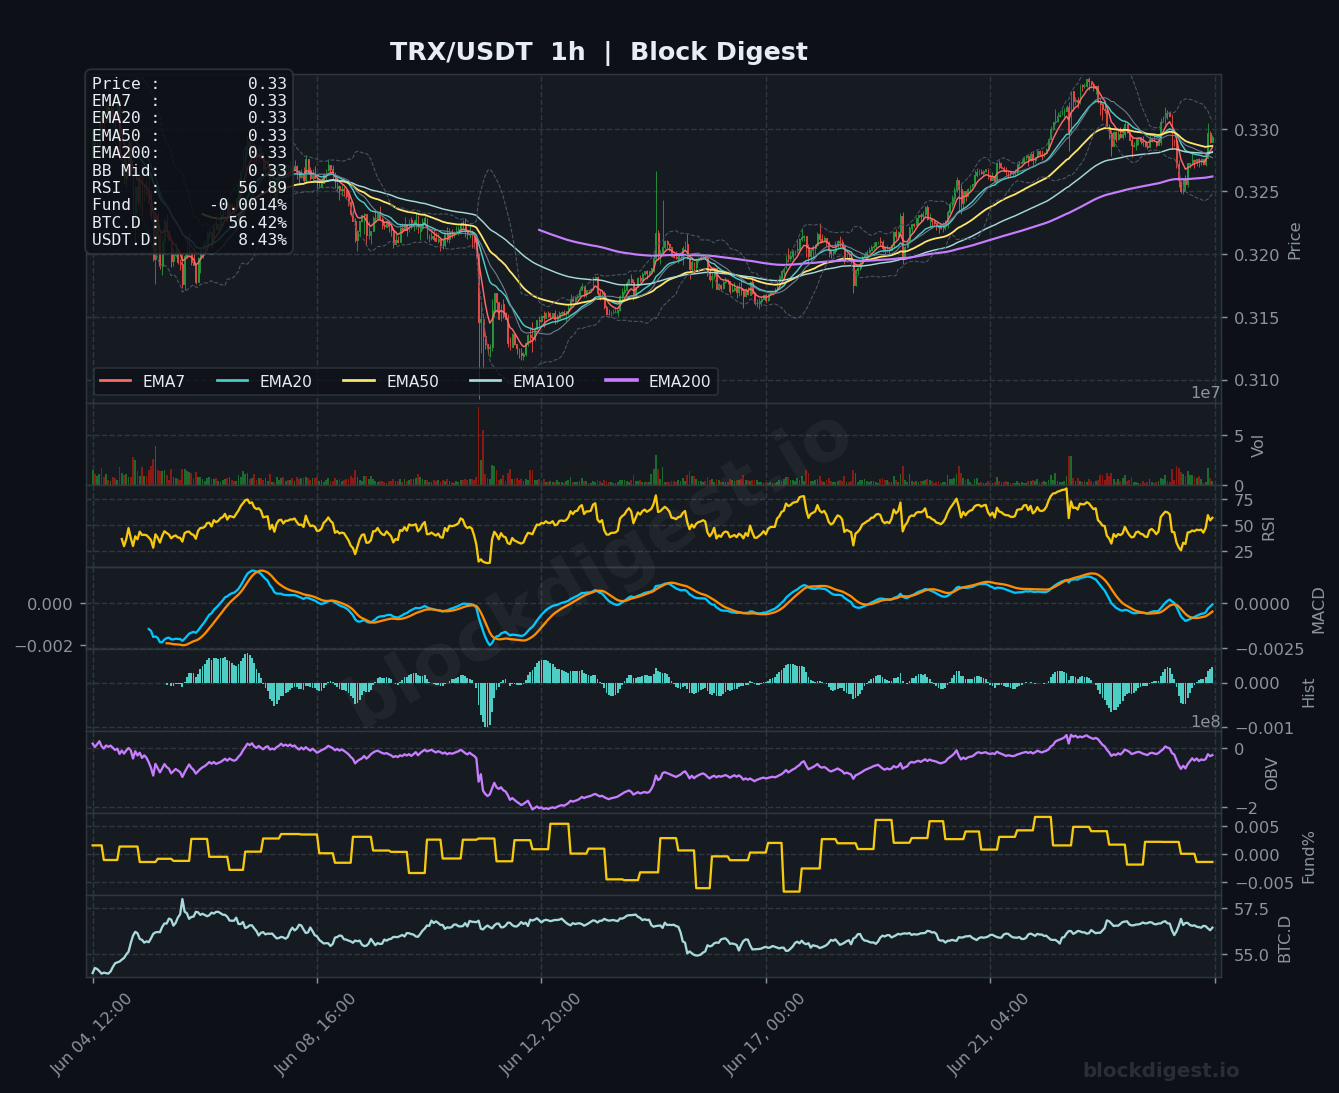
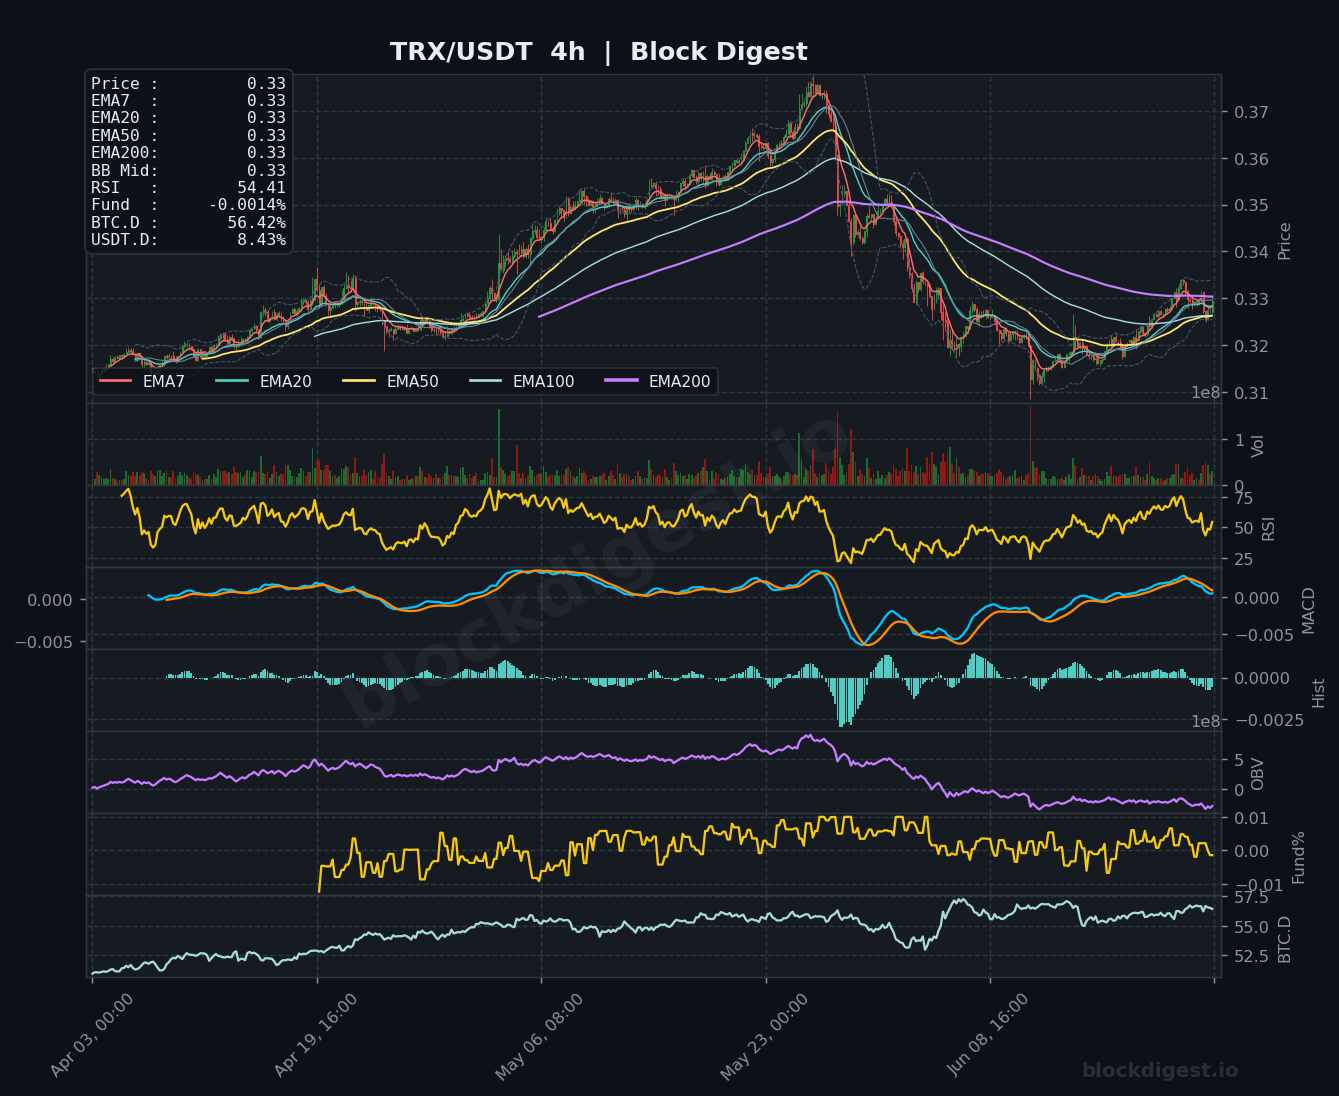
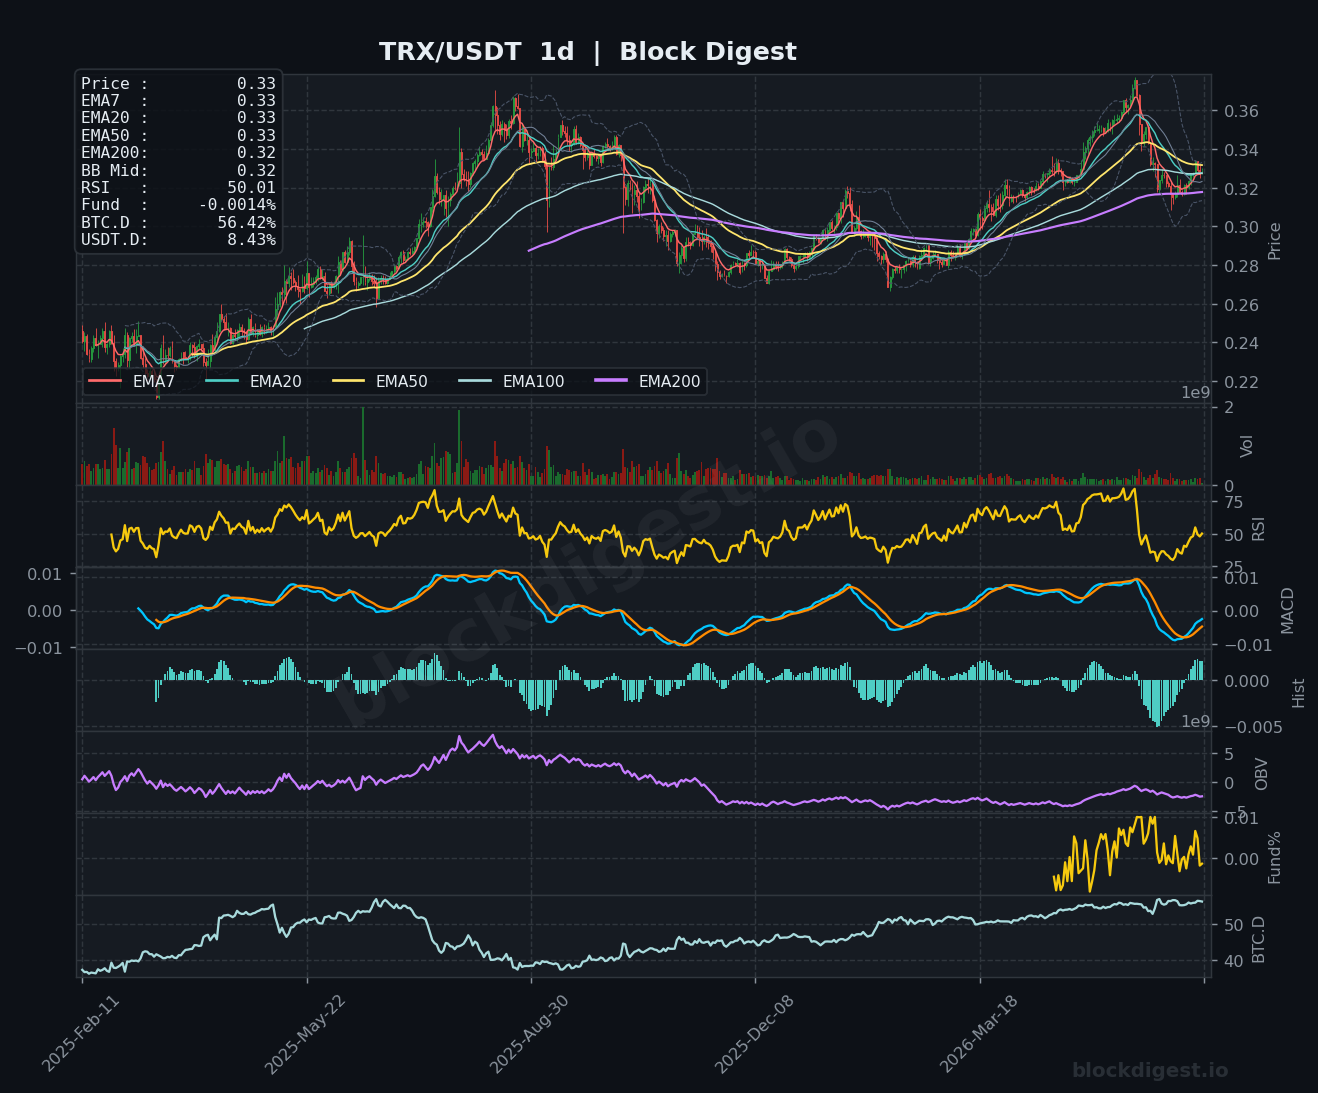
TRX stands out as the relative strength leader in today’s roundup, trading at $0.33 with price action significantly more constructive than its peers. On the daily chart, TRX is holding above its EMA200 ($0.32), with EMA7, EMA20, and EMA50 all clustered tightly at $0.33 — a sign of consolidation rather than breakdown — and the daily RSI is neutral at 50.01, indicating the asset has largely avoided the broad market carnage. The 4h chart shows RSI recovering to 54.41 with MACD attempting a crossover back toward zero following a corrective dip, and the 1h RSI at 56.89 with a tightening EMA cluster suggests near-term momentum is mildly constructive. Immediate support holds at the $0.32 EMA200 daily level, while a decisive move above $0.335 could invite follow-through buying toward the recent highs near $0.37.
Altcoin Outlook
The overall altcoin setup as of June 25, 2026 is broadly bearish, with the majority of the assets reviewed trading in sustained downtrends beneath key moving average resistance and showing declining OBV across multiple timeframes. TRX is the clear outlier, demonstrating relative strength by holding above its daily EMA200 with a neutral RSI — making it the most defensible position in the current environment. DOGE and LTC represent the weakest setups technically, with daily RSIs near or in oversold territory and no structural reversal signals in place, while XRP’s continued deterioration below $1.10 is particularly concerning given the depth of the move. Traders should monitor a potential pullback in BTC dominance below 56% as a prerequisite for any sustained altcoin recovery, with USDT.D contraction below 8% serving as a secondary confirmation that risk appetite is genuinely improving.
Disclaimer: This analysis is for informational purposes only and does not constitute financial advice. Cryptocurrency markets are highly volatile and unpredictable. All trading decisions should be made based on your own research and risk tolerance. Block Digest is not responsible for any financial losses incurred as a result of acting on this content.
Stay Ahead of the Market
Follow BlockDigest for crypto market intelligence, research and real-time updates.


