
Market Context
The broader altcoin market is operating under meaningful pressure as of June 23, 2026, with BTC dominance holding at 56.34% — a level that continues to suppress sustained capital rotation into altcoins. USDT.D at 8.29% signals that a notable portion of sidelined capital remains in stablecoins, reflecting cautious risk appetite rather than outright fear, but not yet the kind of aggressive deployment that fuels altcoin rallies. The overall picture across the six assets reviewed today is one of post-peak distribution, with most coins still trading well beneath their recent highs and struggling to reclaim key moving average clusters.
Solana (SOL)
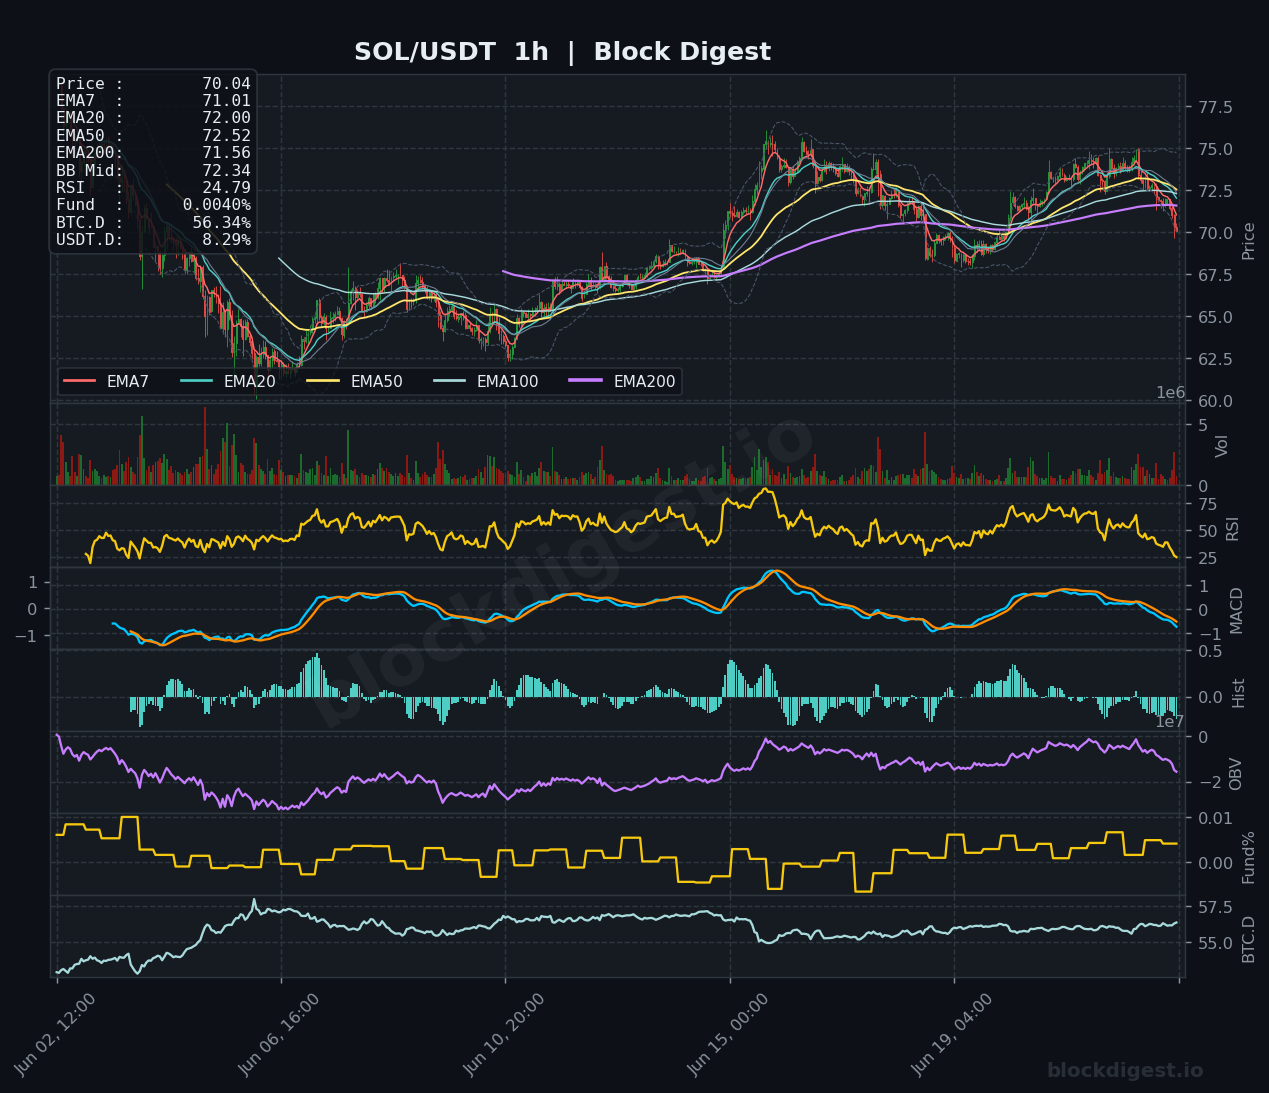
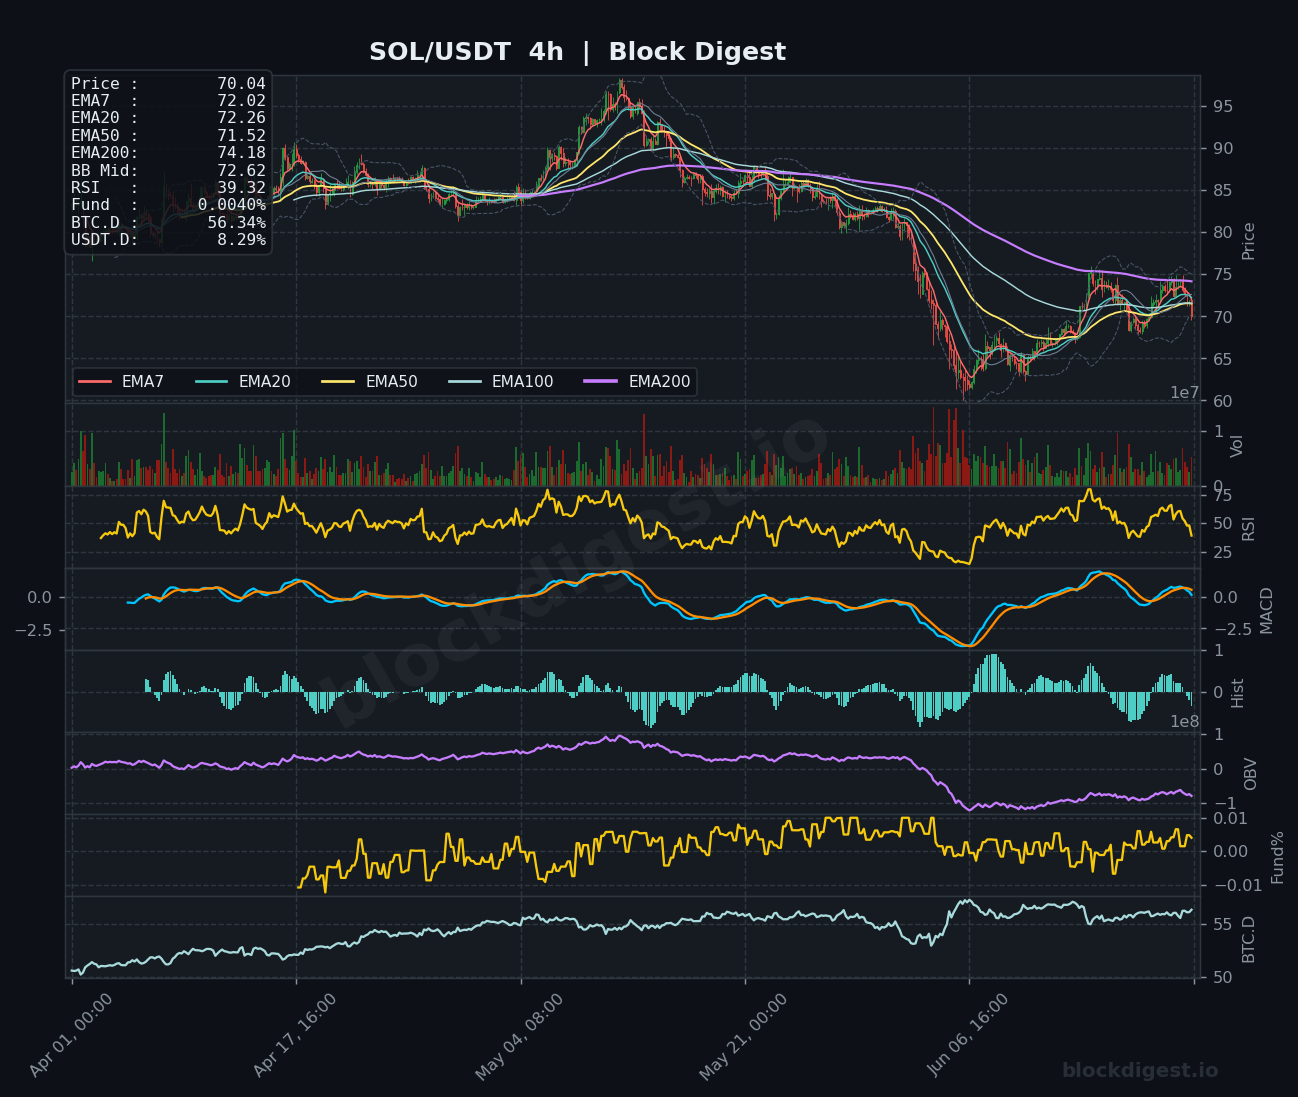
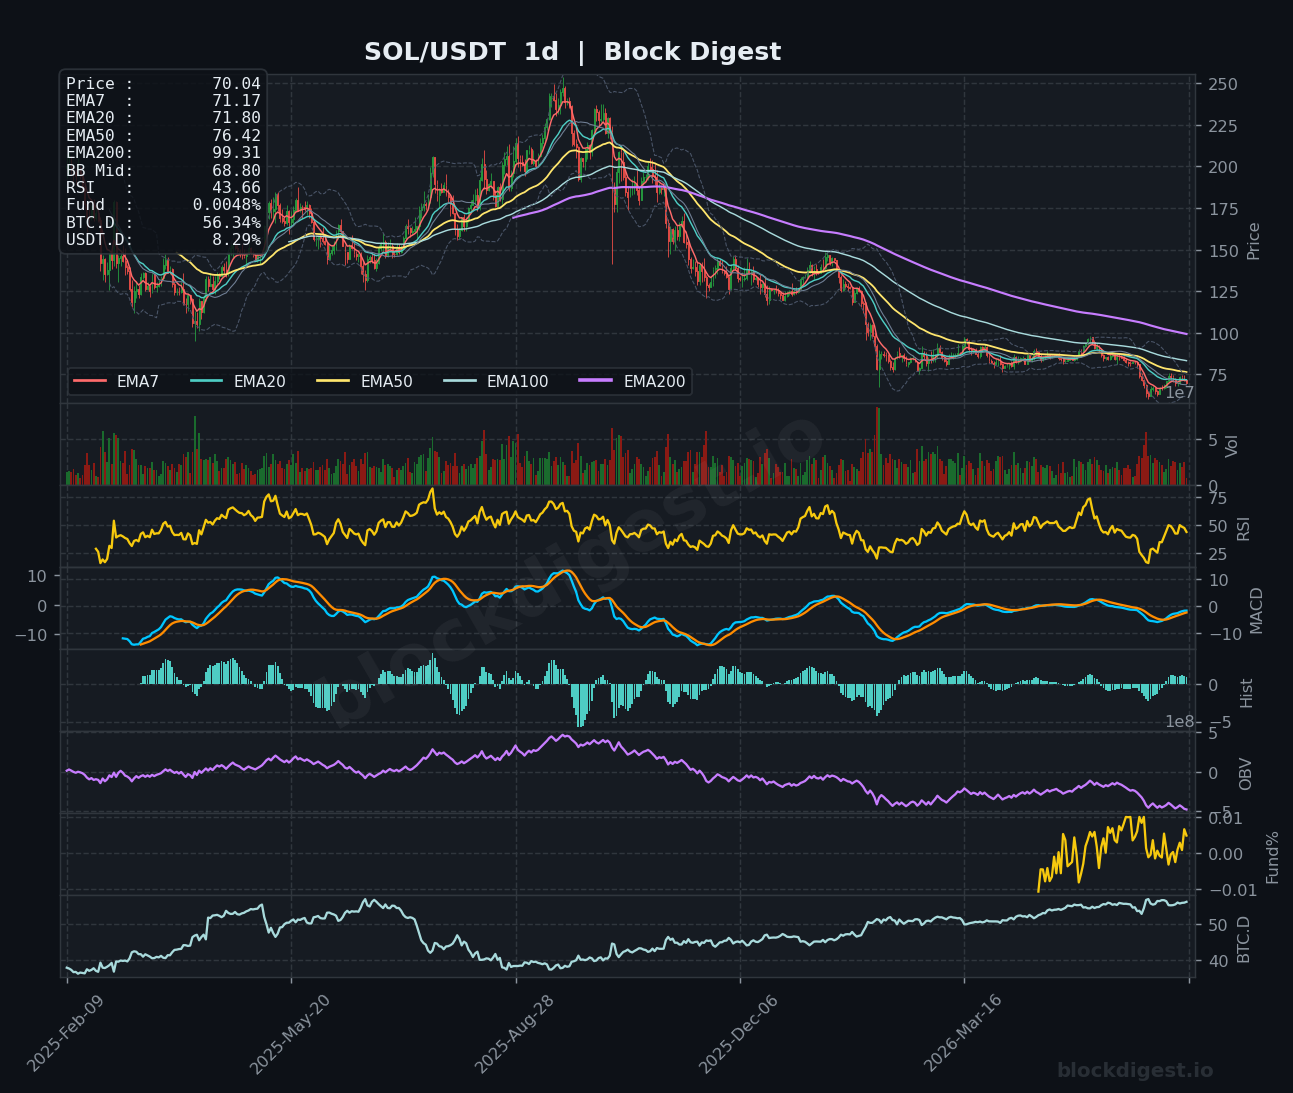
SOL is trading at $70.04, having sold off sharply from a recent peak near $75–76 and now sitting below all key EMAs on the 1h chart (EMA7: $71.01, EMA20: $72.00, EMA50: $72.52, EMA200: $71.56), confirming near-term bearish structure. The 1h RSI has collapsed to 24.79, placing SOL in deeply oversold territory on the short timeframe, which may invite a technical bounce but should not be mistaken for a trend reversal. On the 4h chart, RSI sits at 39.32 with the MACD attempting to curl upward from deeply negative territory, while on the daily the RSI reads 43.66 with price trading far beneath the EMA200 at $99.31 — underscoring the severity of the longer-term downtrend. Immediate resistance sits at the $72.00–$72.52 EMA cluster; a failure to reclaim that zone on any bounce keeps the short-term bias firmly bearish, with $67–$68 as the next meaningful support.
XRP (XRP)
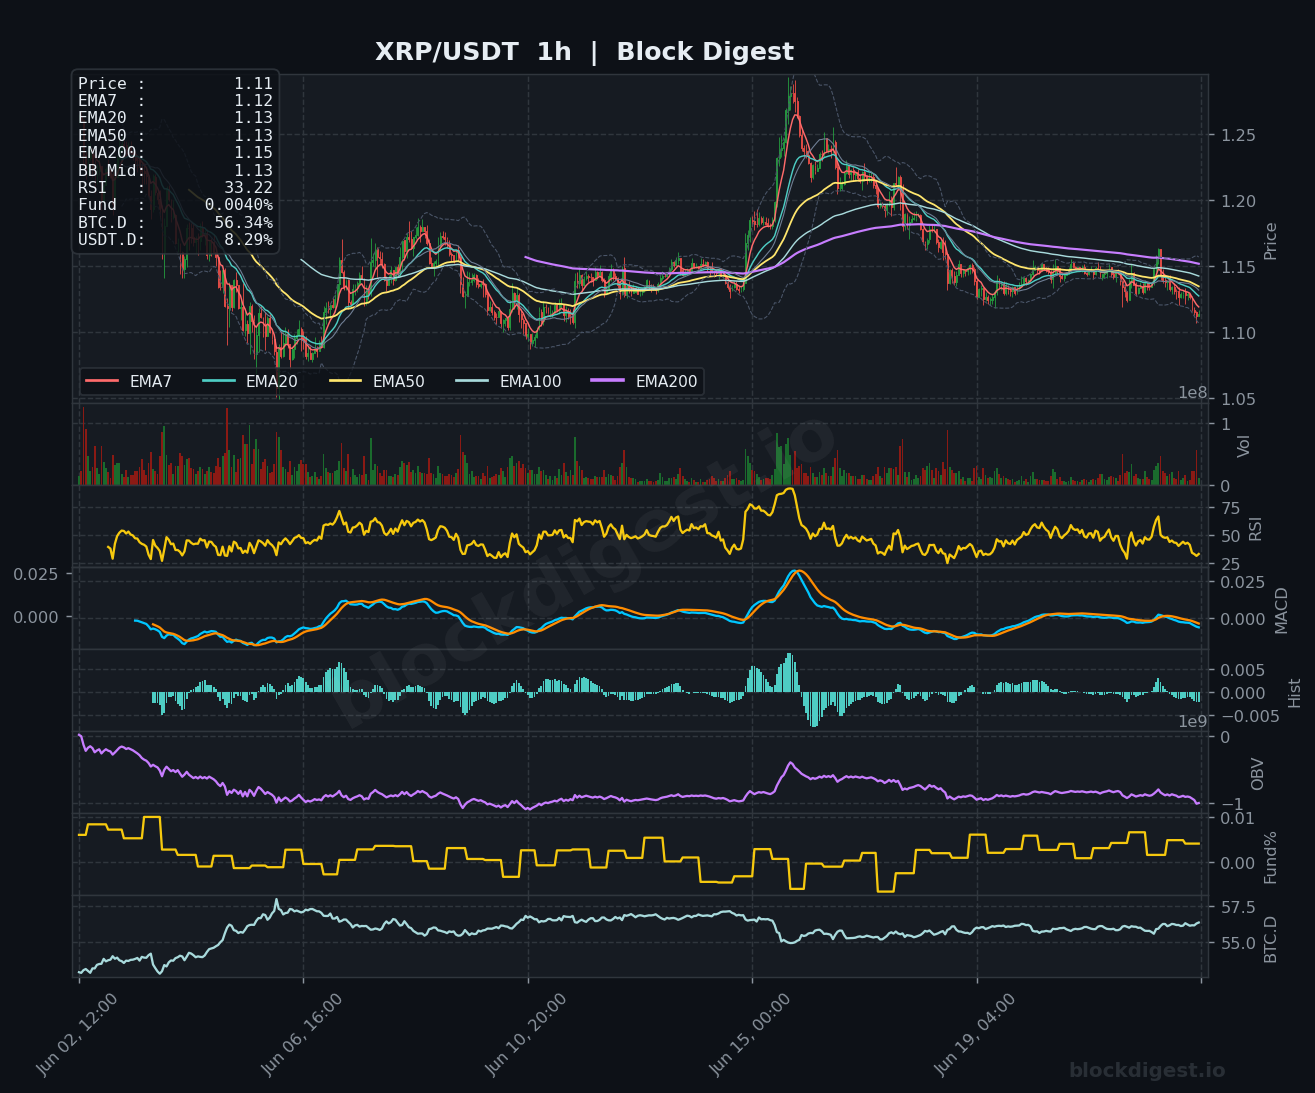
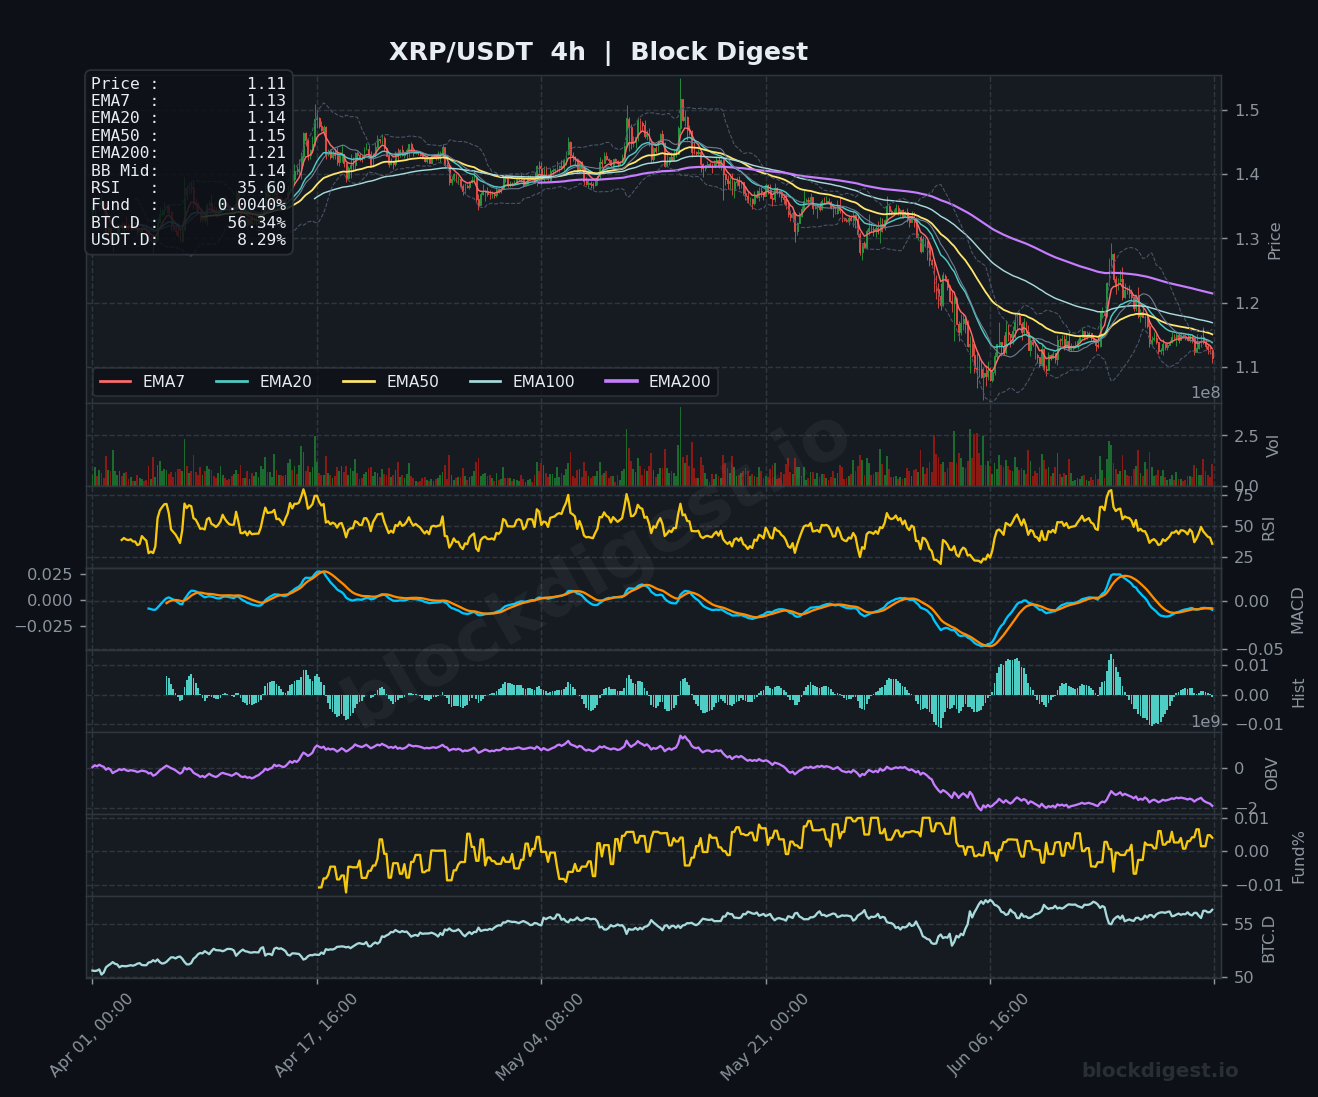
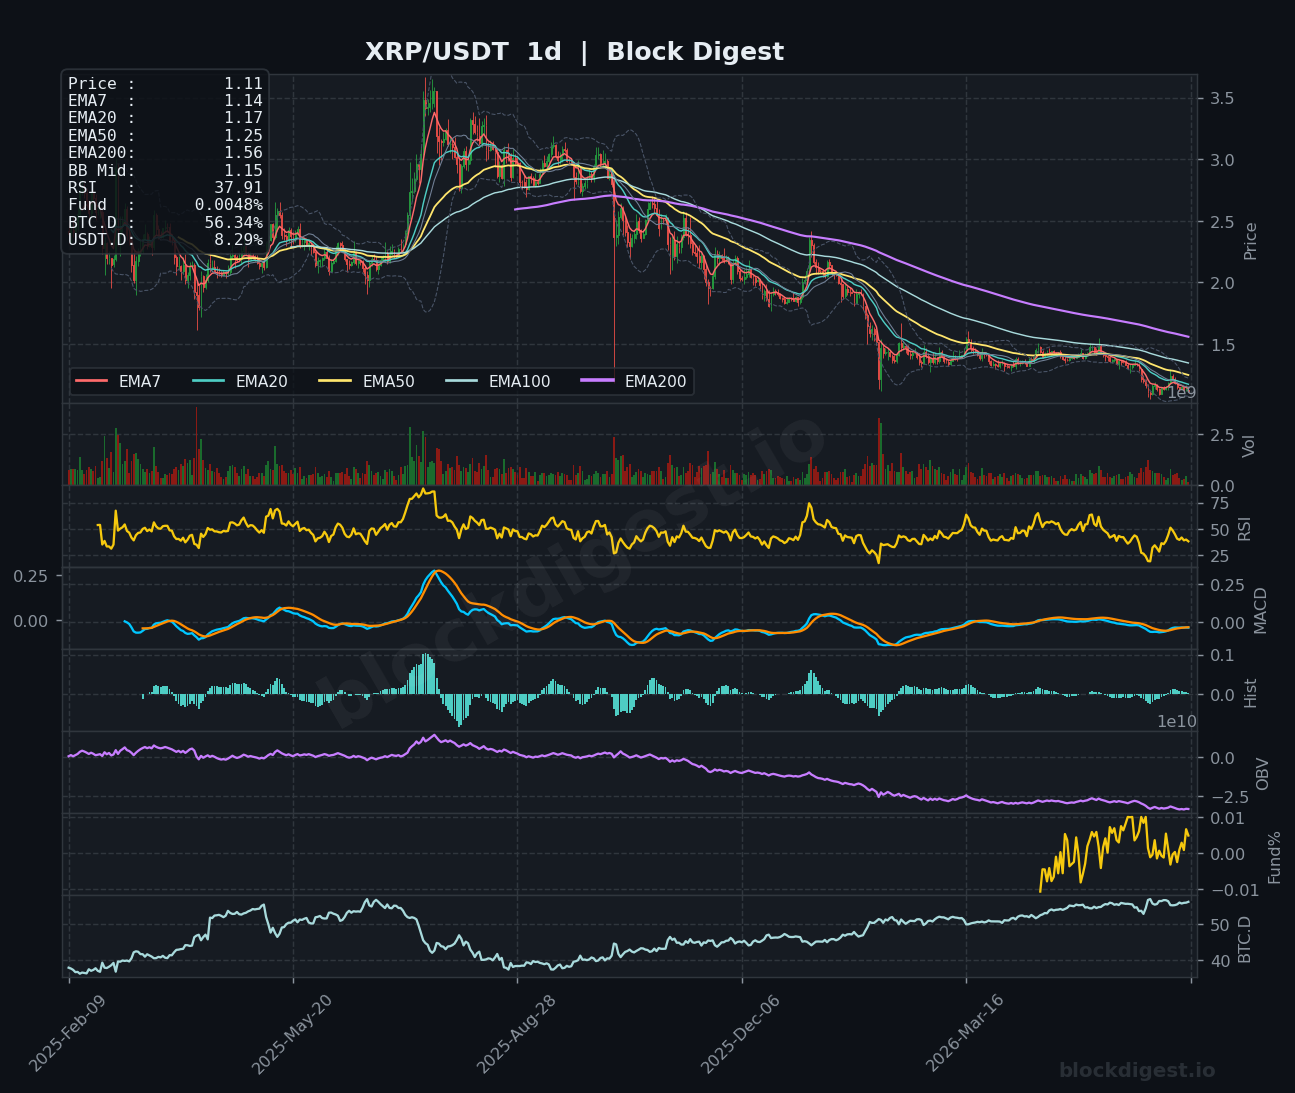
XRP is priced at $1.11, retreating from a sharp mid-period spike that tagged approximately $1.25 before reversing aggressively, leaving overhead supply well established. All EMAs on the 1h chart are stacked above current price (EMA7: $1.12, EMA200: $1.15), and the RSI at 33.22 indicates continued selling pressure without yet reaching the extreme oversold levels seen in some peers. The 4h RSI at 35.60 and a MACD that remains in bearish territory confirm the intermediate downtrend is intact, while the daily chart shows price well beneath the EMA50 ($1.25) and EMA200 ($1.56), with daily RSI at 37.91. Key support to watch is the $1.08–$1.10 zone; a breach there could accelerate selling toward $1.00, while reclaiming $1.15 would be the minimum requirement to shift the short-term bias to neutral.
BNB (BNB)
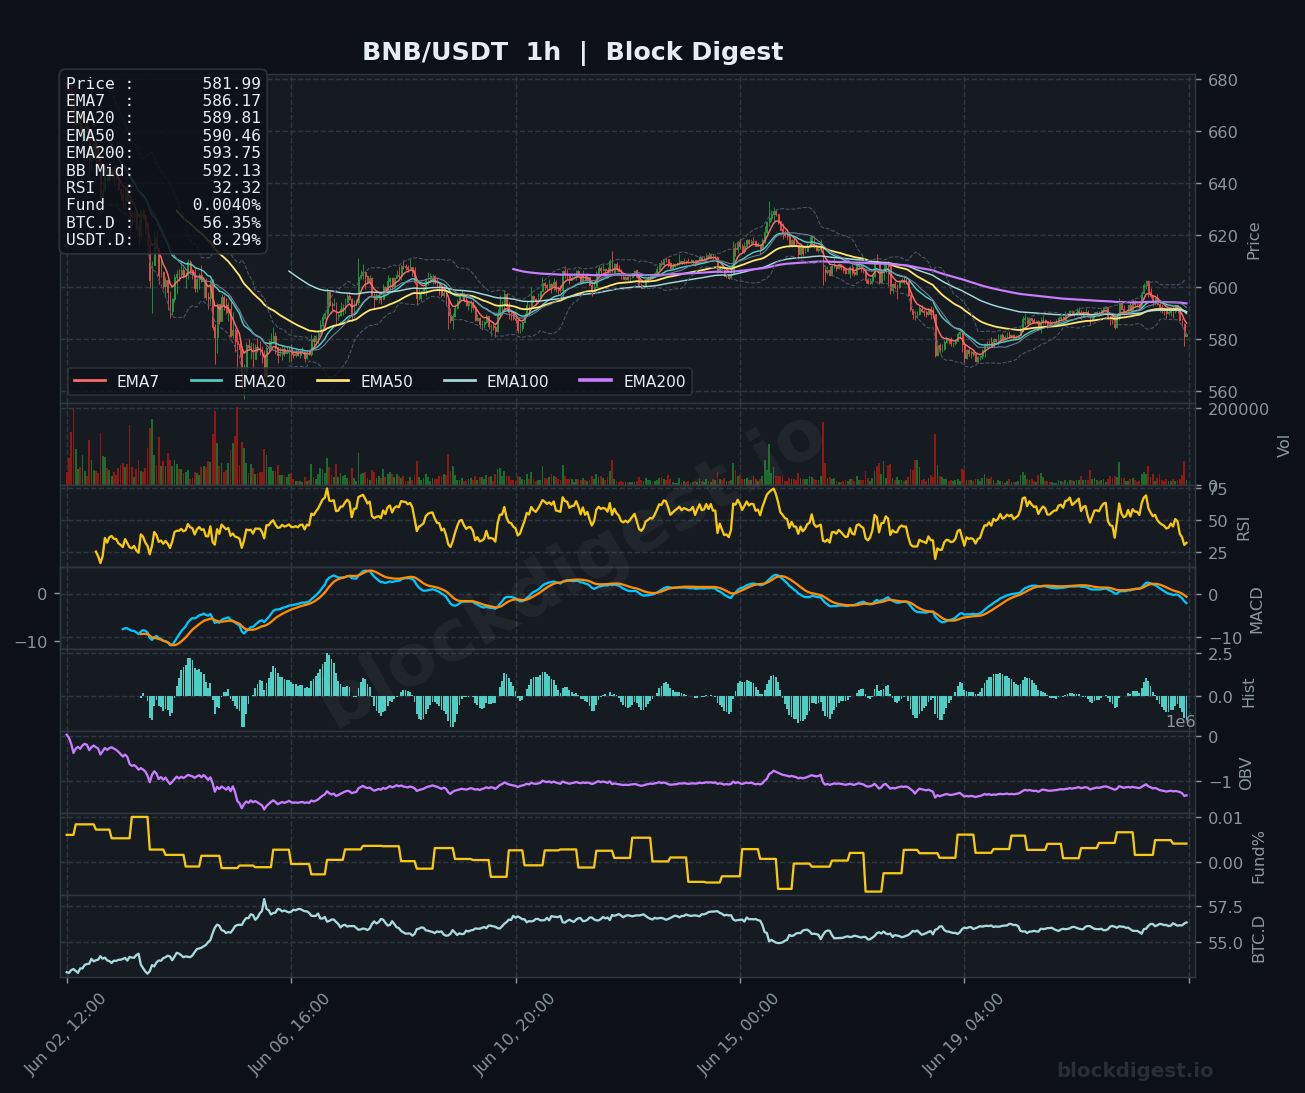
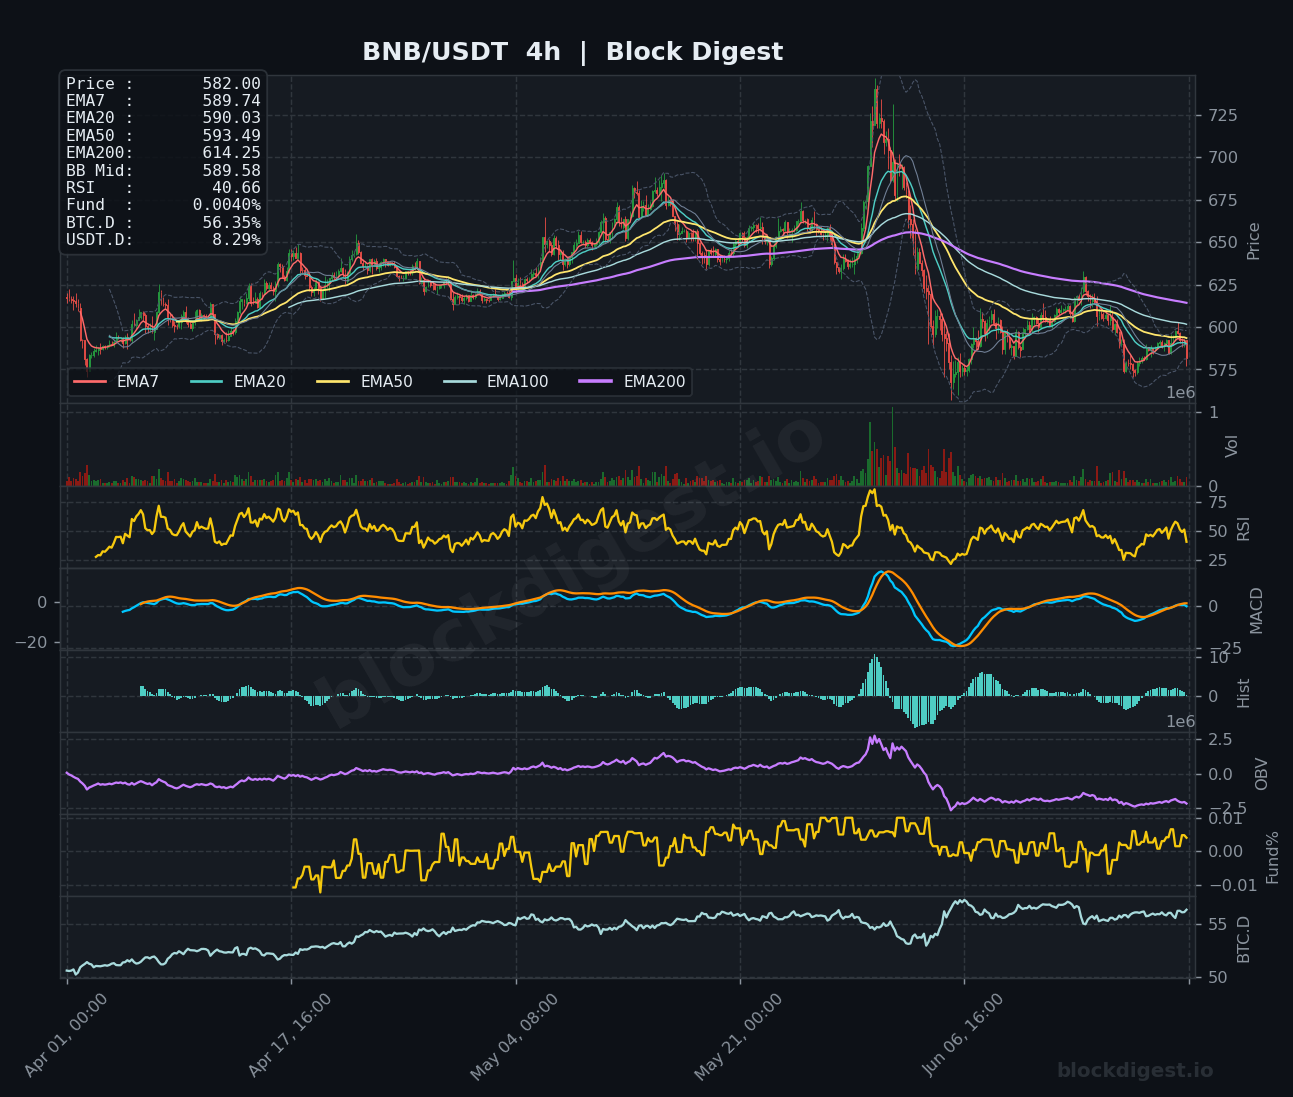
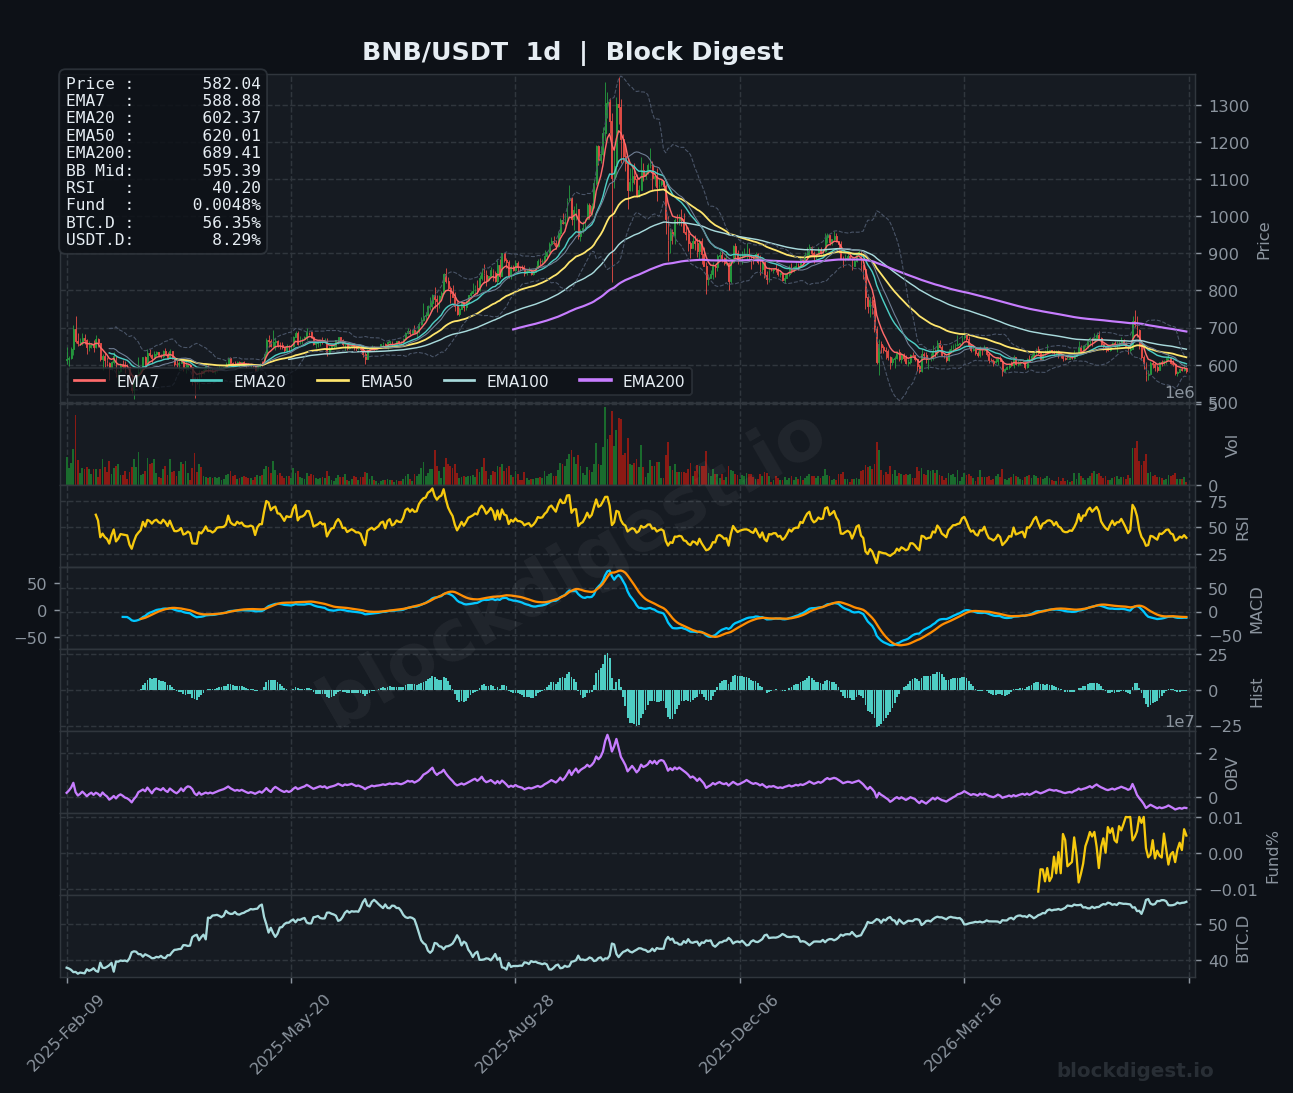
BNB is trading at $582.00, a substantial retreat from its spike high near $725 seen earlier in the observed period, with the price now compressed beneath all major EMAs on the 1h (EMA7: $586.17, EMA200: $593.75). The 1h RSI at 32.32 reflects near-term selling exhaustion beginning to emerge, and the MACD is showing a marginal bullish cross attempt, though conviction appears low given the OBV trend remains negative. On the 4h timeframe, RSI sits at 40.66 with the MACD approaching zero from below — a structure that suggests a base may be forming but recovery is not yet confirmed. The daily chart shows BNB trading far beneath its EMA200 at $689.41 with RSI at 40.20, placing the bias as bearish-to-neutral; the $575–$580 region is the critical support floor to hold, while $600–$602 (daily EMA20) is the first meaningful resistance to overcome.
Dogecoin (DOGE)
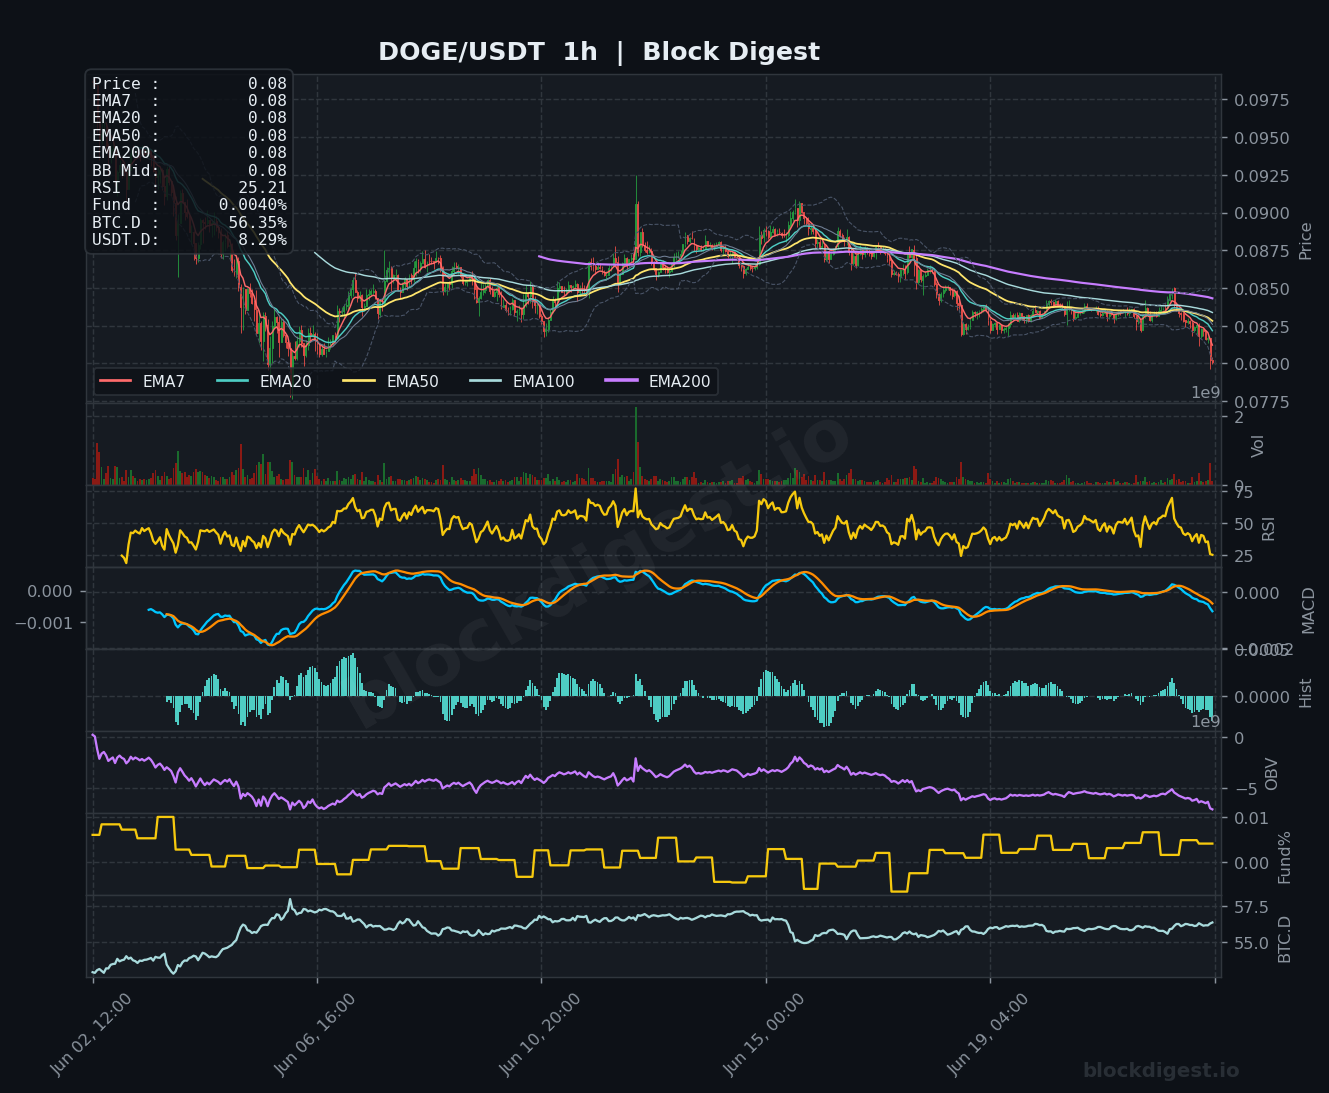
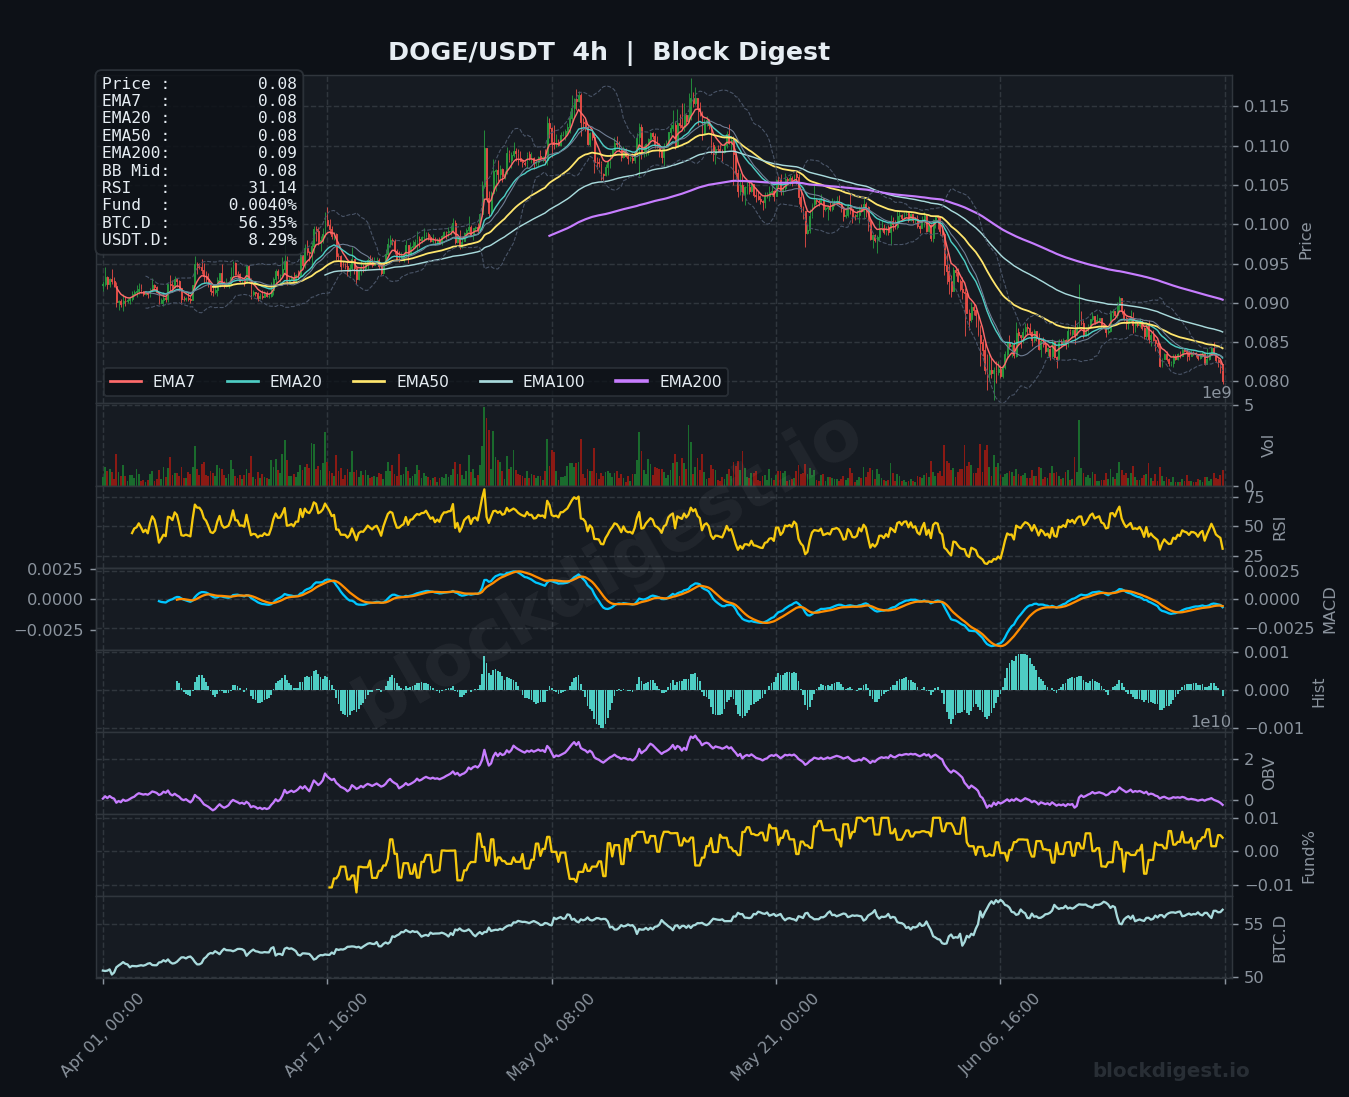
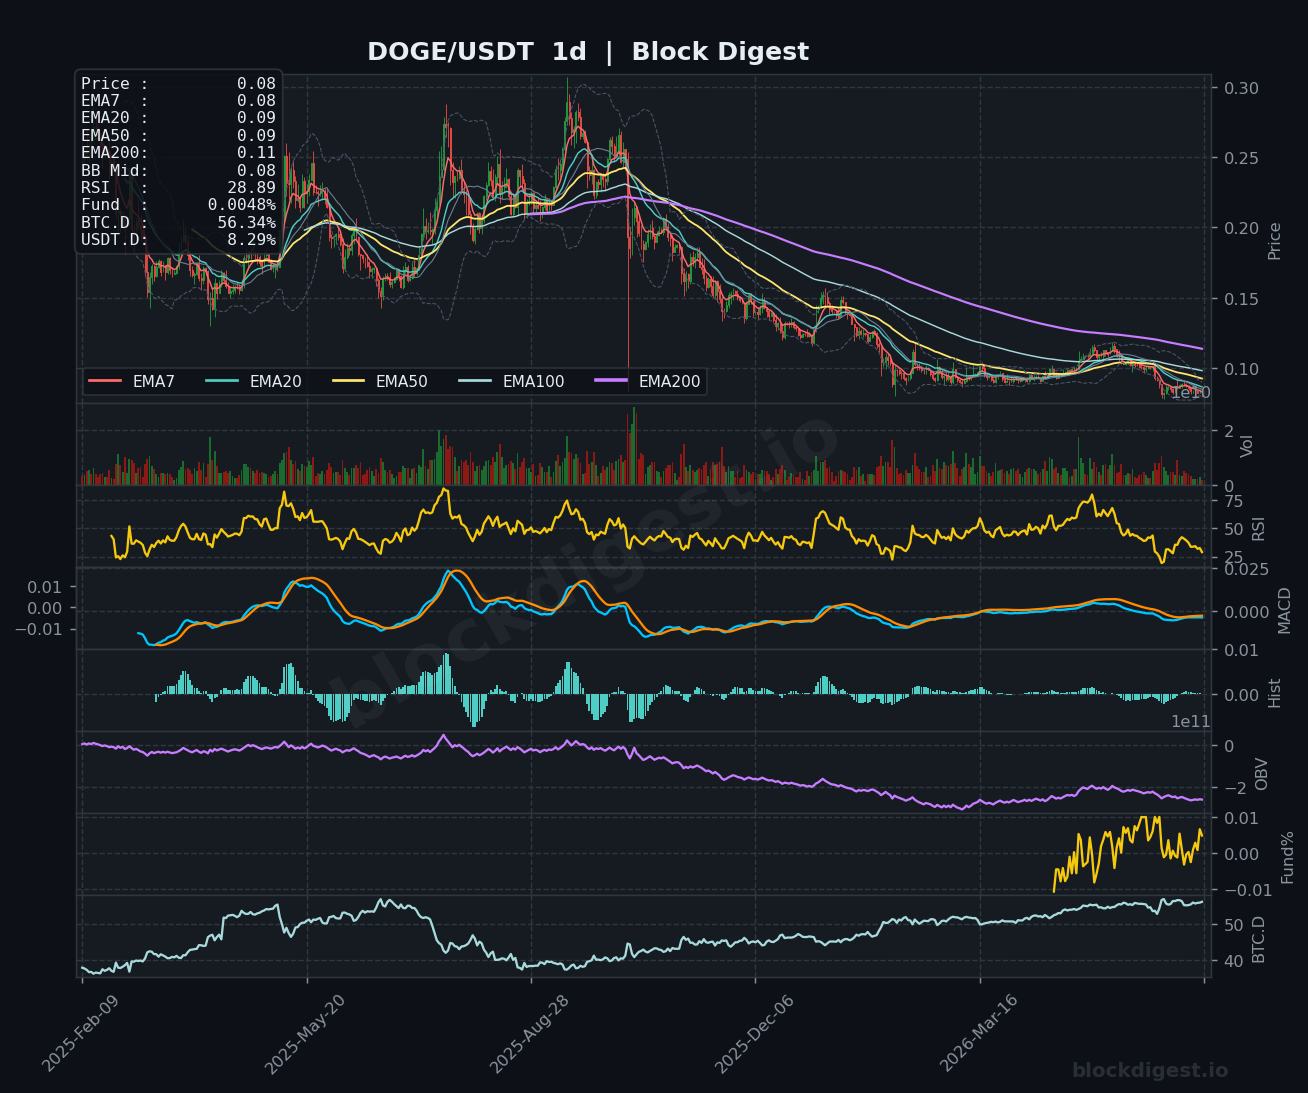
DOGE is currently trading at $0.0800, having declined steadily from a high near $0.115 and now pressing against multi-week lows with all EMAs on the 1h chart converged at $0.08 — a tightly compressed structure that often precedes a volatility expansion. The 1h RSI at 25.21 is in oversold territory, and the MACD signal line is crossing to bearish on the hourly, while the 4h RSI at 31.14 similarly sits near oversold conditions. The daily chart is particularly concerning, with RSI at 28.89 — the lowest reading among the six coins reviewed today — and price having lost the EMA50 ($0.09) and EMA200 ($0.11) decisively, with OBV in persistent decline. The short-term bias is bearish, with $0.078–$0.080 acting as immediate support; a daily close below $0.078 would open downside toward $0.070, while a recovery above $0.085 would be needed to suggest any near-term stabilization.
Litecoin (LTC)
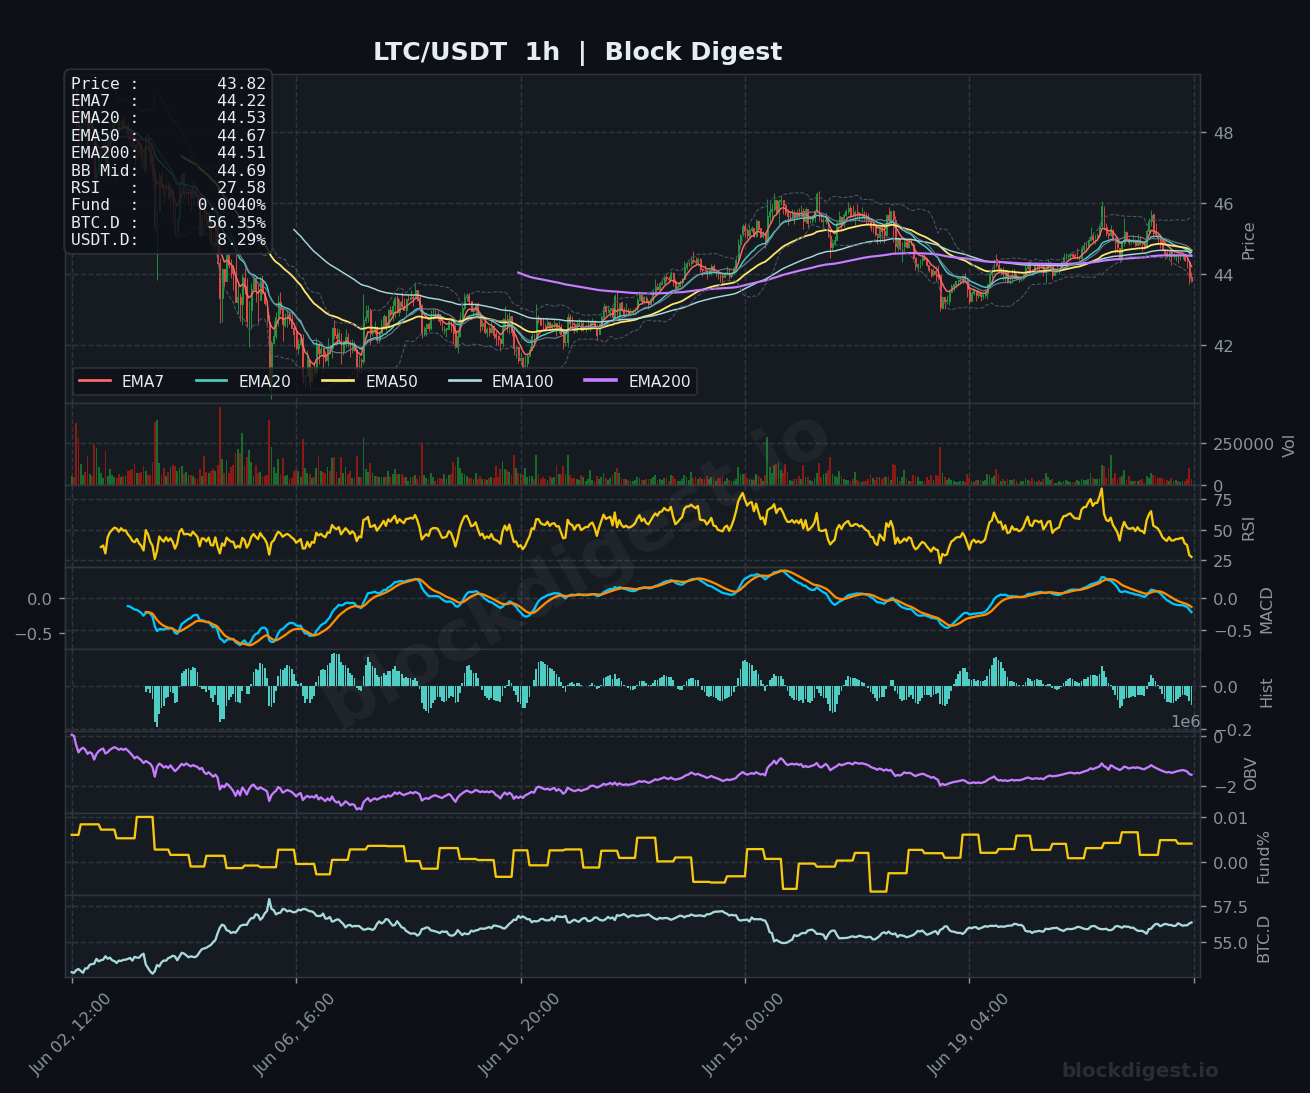
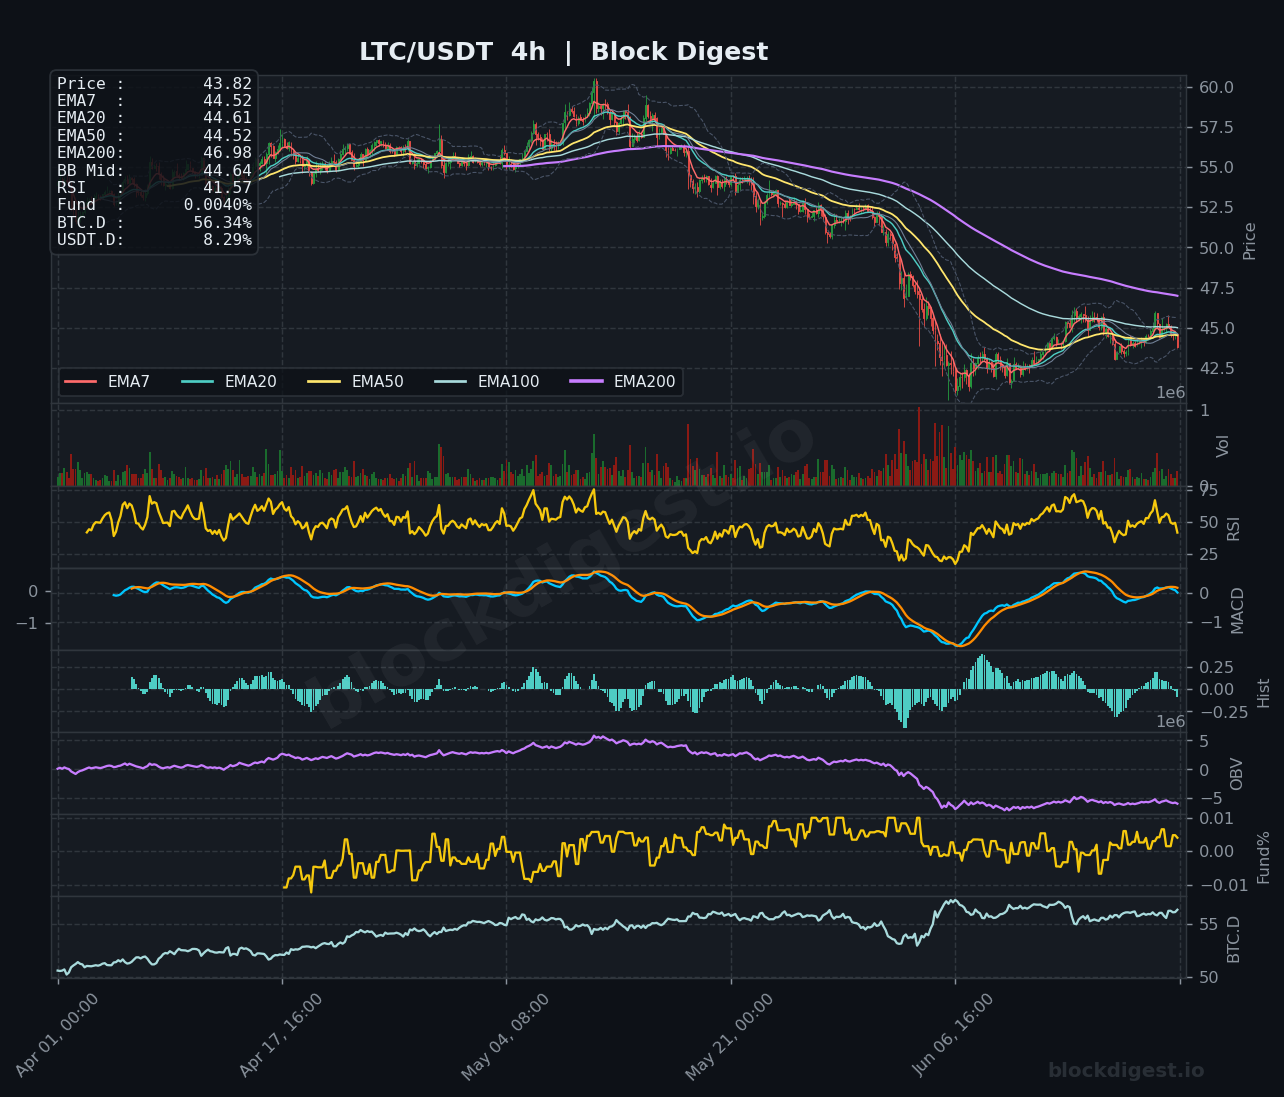
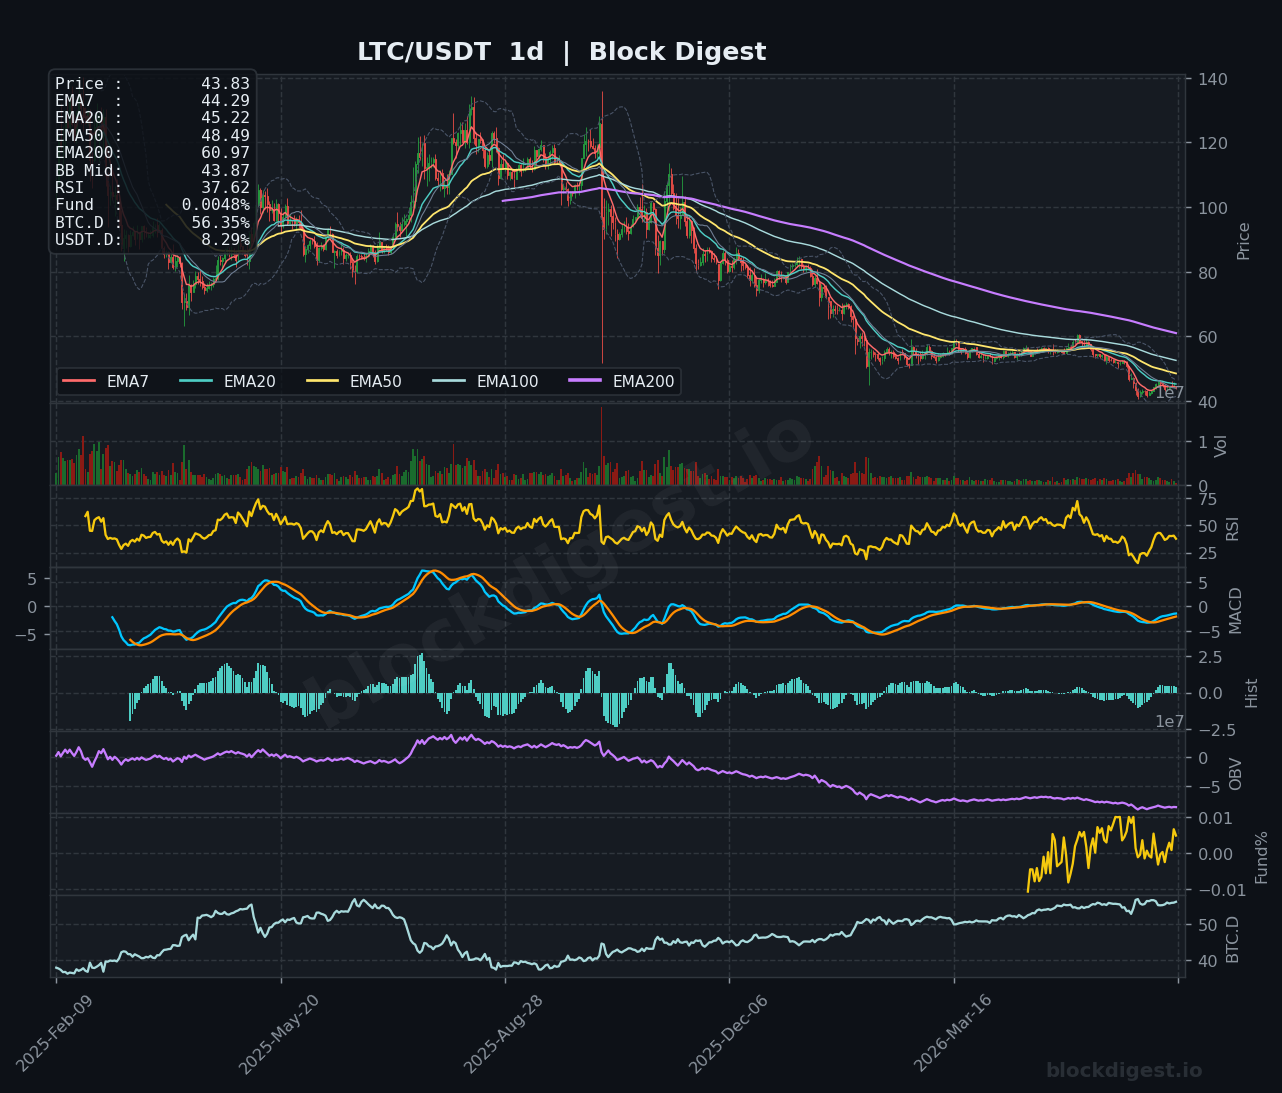
LTC is trading at $43.82, well beneath all EMAs on the 1h (EMA7: $44.22, EMA200: $44.51) after a failed attempt to recover above the $46 area, and the 1h RSI at 27.58 confirms the latest leg lower is generating oversold conditions. The 4h chart shows RSI at 41.57 with the MACD slowly recovering toward zero — an early sign of potential stabilization, though not a confirmed reversal — and price remains trapped beneath the EMA200 at $46.98, which represents significant resistance. On the daily timeframe, RSI reads 37.62, price sits below the EMA50 ($48.49) and a steeply declining EMA200 ($60.97), and OBV continues to trend lower, reflecting sustained net outflows. LTC’s bias remains bearish; $42.50–$43.00 is the immediate support area to watch, and any bounce needs to clear $45.00–$45.22 (daily EMA20) convincingly to have validity.
TRON (TRX)
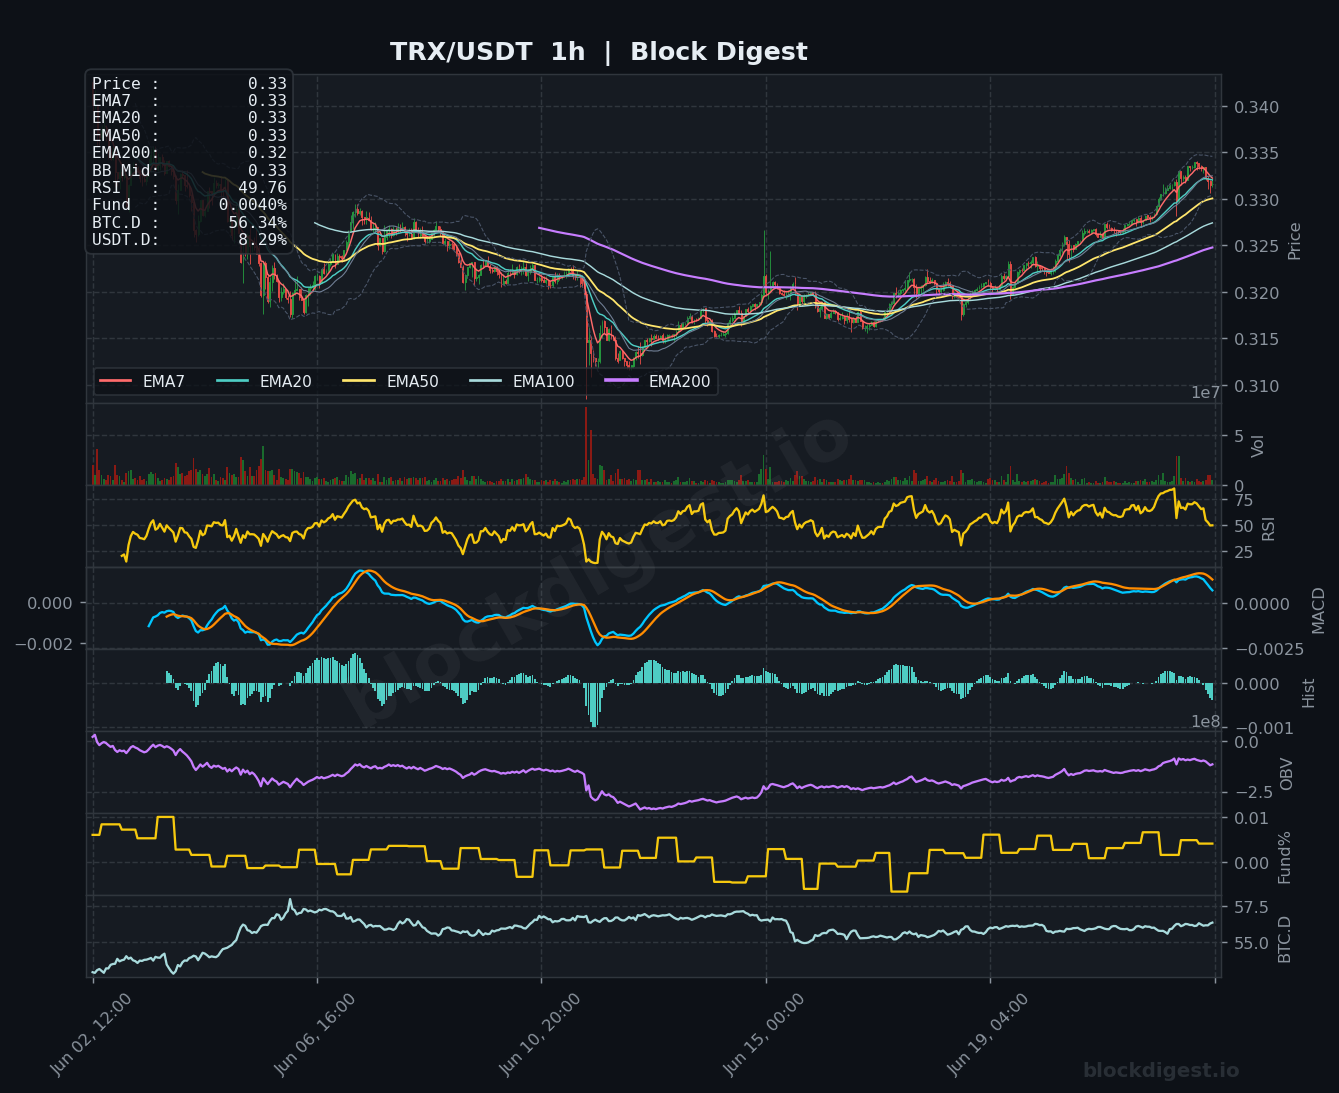
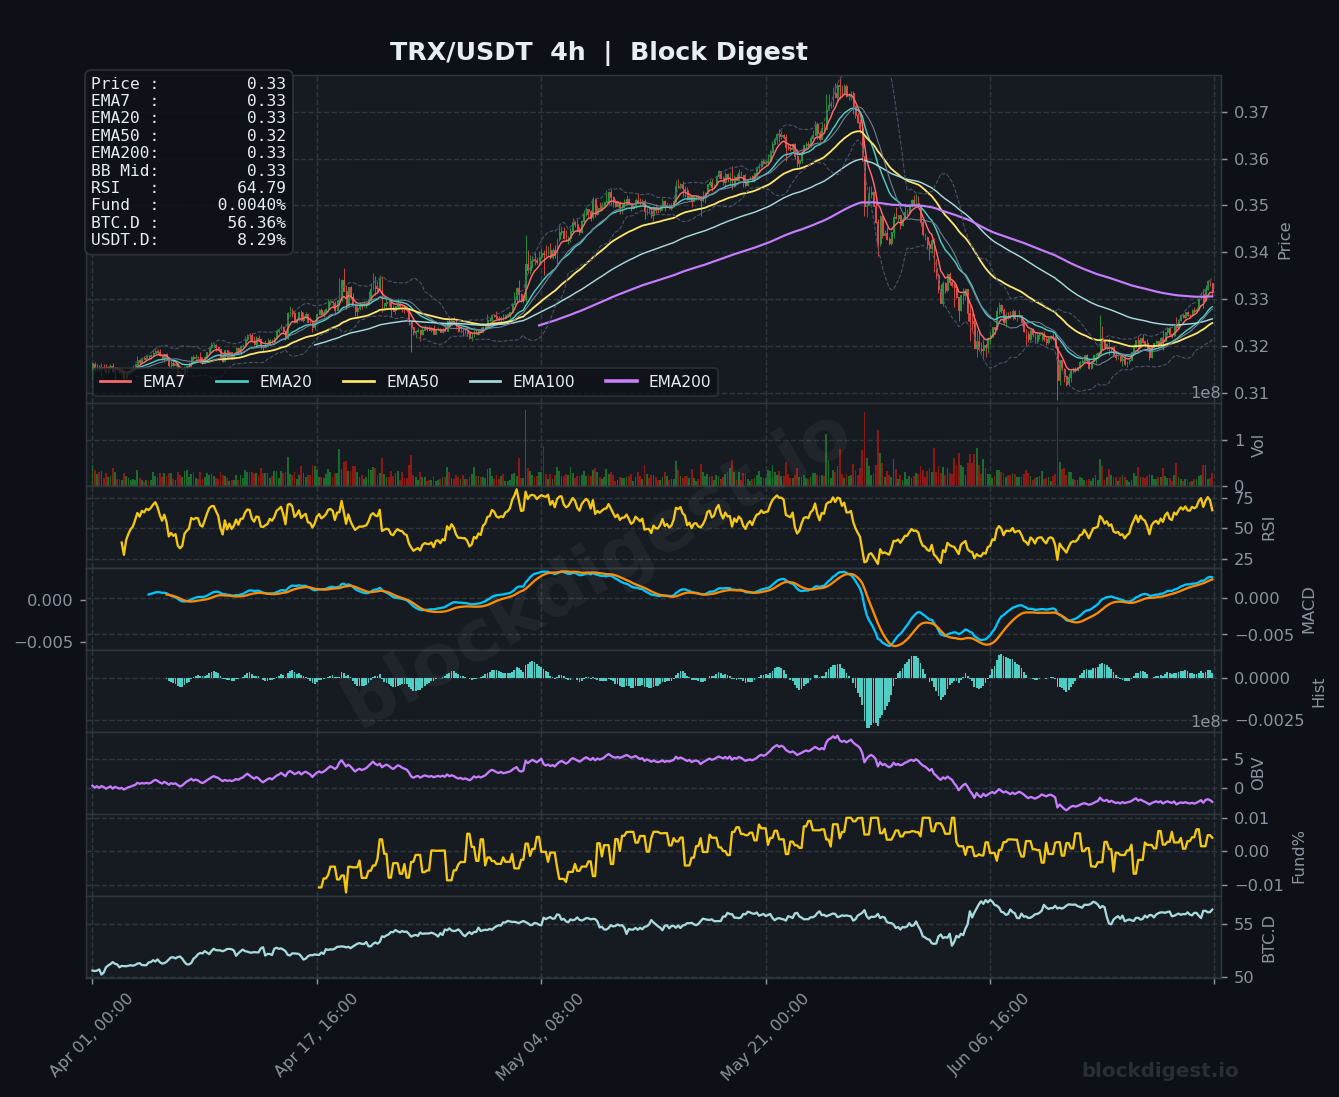
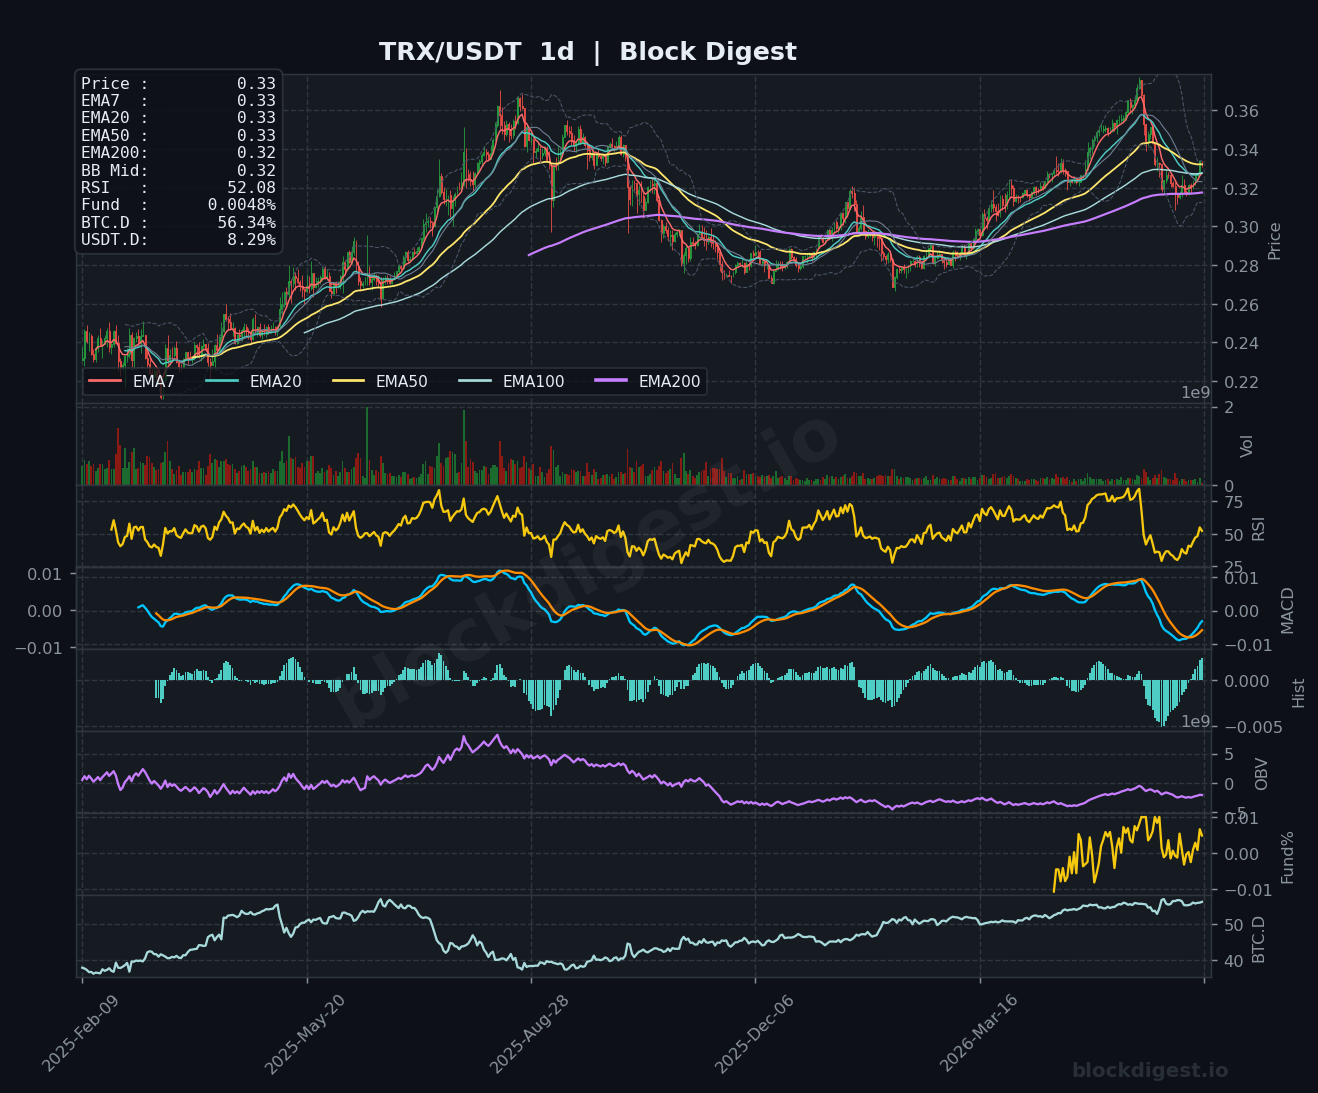
TRX stands out as the clear relative strength leader among today’s reviewed assets, trading at $0.33 with the 1h RSI at 49.76 — essentially neutral and a stark contrast to the oversold readings seen in SOL, XRP, DOGE, and LTC. On the 1h chart, price is trading above the EMA200 ($0.32) with EMAs tightly clustered around current price, suggesting consolidation rather than distribution. The 4h RSI at 64.79 indicates bullish momentum on the intermediate timeframe, with the MACD turning back toward positive territory after a brief pullback, while the daily RSI at 52.08 confirms TRX remains in a mid-range, healthy position without being overextended. Key support sits at $0.32 (EMA200 on the 1h), and while a daily MACD that has recently rolled over warrants caution, TRX’s bias is neutral-to-cautiously-bullish relative to its peers, with $0.335–$0.340 as the near-term resistance zone to clear.
Altcoin Outlook
The overarching theme across today’s altcoin landscape is one of broad-based weakness and post-distribution pressure, with DOGE, SOL, LTC, XRP, and BNB all printing sub-40 RSI readings on the daily — a historically notable cluster of oversold conditions that can precede tactical bounces but does not in itself signal trend reversal absent a meaningful catalyst or shift in BTC dominance. TRX is the lone outlier showing relative resilience, with neutral-to-bullish momentum across timeframes and a structure that suggests it has better absorbed recent market-wide selling. Traders should watch for whether BTC dominance begins to roll over from the 56.34% level, as any sustained move below 55% would be the clearest signal that capital rotation into altcoins is beginning to gather pace. Until USDT.D shows a clear downward trend from current 8.29% levels and altcoins begin reclaiming their respective 20-day EMAs on the daily chart, the path of least resistance remains to the downside, and any bounces should be treated with skepticism in the absence of strong volume confirmation.
Disclaimer: This analysis is for informational purposes only and does not constitute financial advice. Cryptocurrency markets are highly volatile and unpredictable. All trading decisions should be made based on your own research and risk tolerance. Block Digest is not responsible for any financial losses incurred as a result of acting on this content.
Stay Ahead of the Market
Follow BlockDigest for crypto market intelligence, research and real-time updates.


