Weekly Market Overview
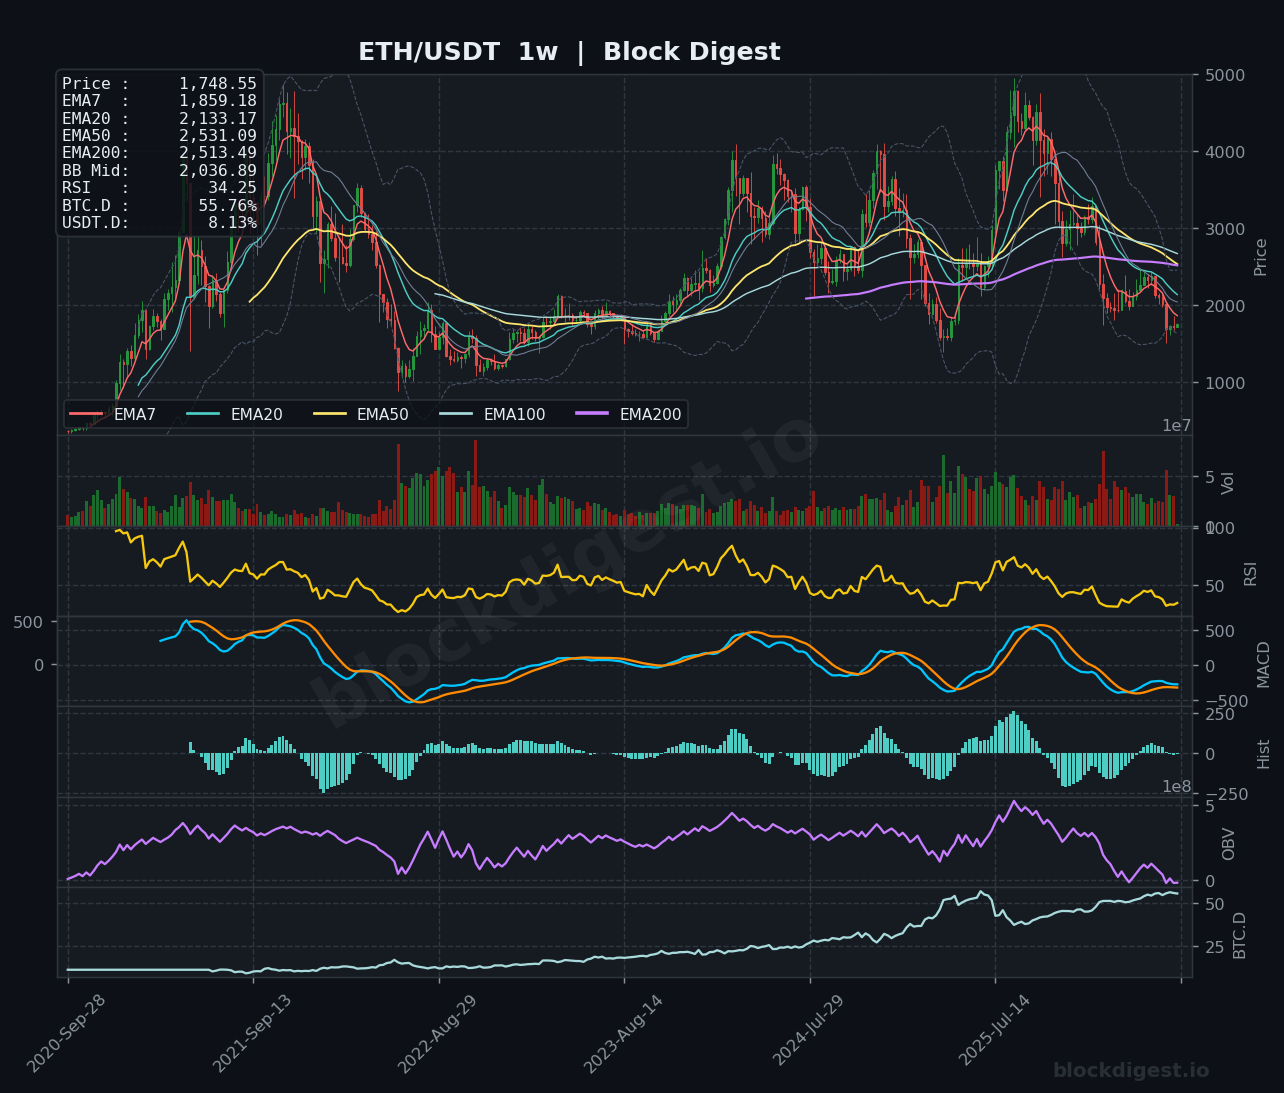
ETH/USDT enters the week of June 22, 2026 trading at approximately $1,747–$1,748, consolidating after a prolonged multi-month downtrend that saw price collapse from the $4,500 region into the mid-$1,500s. The current weekly candle structure suggests a tentative stabilization attempt, with price finding some footing above the recent capitulation lows near $1,540–$1,570. However, the broader weekly trend remains firmly bearish, with lower highs and lower lows dominating price action since the cycle peak. The recovery off the lows is modest and unconvincing at this stage, and any meaningful bullish thesis requires reclaiming significantly higher ground before it can be taken seriously.
Higher Timeframe Structure
On the weekly chart, the EMA stack remains in a deeply bearish configuration: price trades well below the EMA7 ($1,859), EMA20 ($2,133), EMA50 ($2,531), and EMA200 ($2,513), with all moving averages sloping downward in a full bearish cascade. Price is currently hugging the lower Bollinger Band, with the BB midline sitting at $2,037 — a level that now represents significant overhead resistance in the macro context. The weekly RSI at 34.25 is approaching oversold territory but has not yet reached the extreme sub-30 readings historically associated with major cycle bottoms on ETH’s weekly chart. Contextually, the $1,750 zone corresponds to a historically significant structural area that previously acted as support during the 2021 bull cycle before breaking down in 2022, making the current test of this level critical from a macro perspective.
Multi-Timeframe Confluence
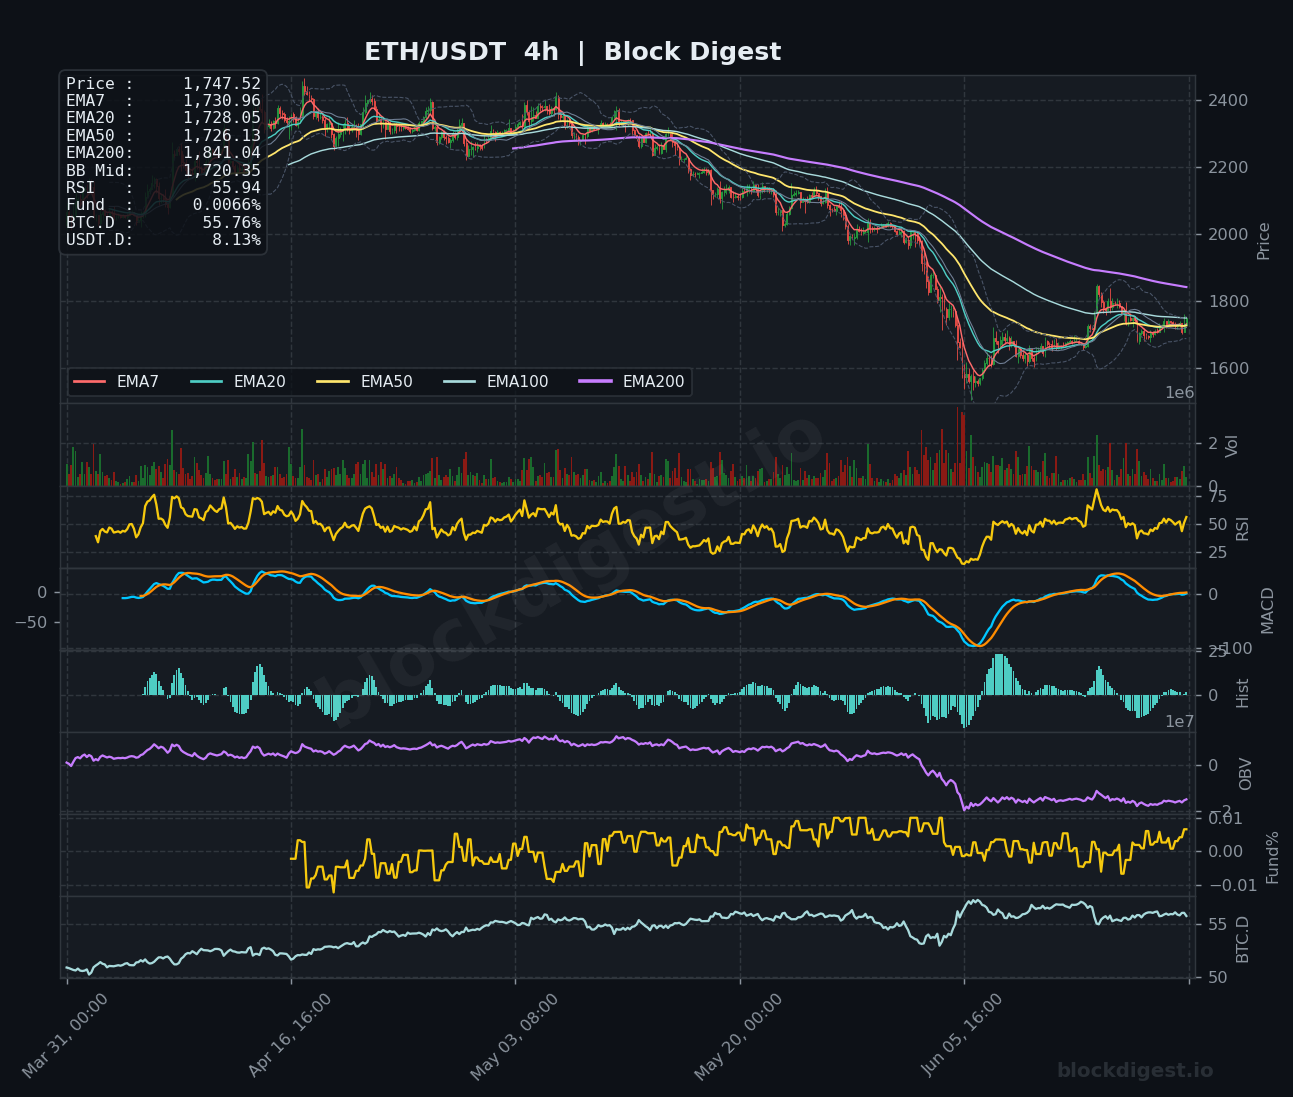
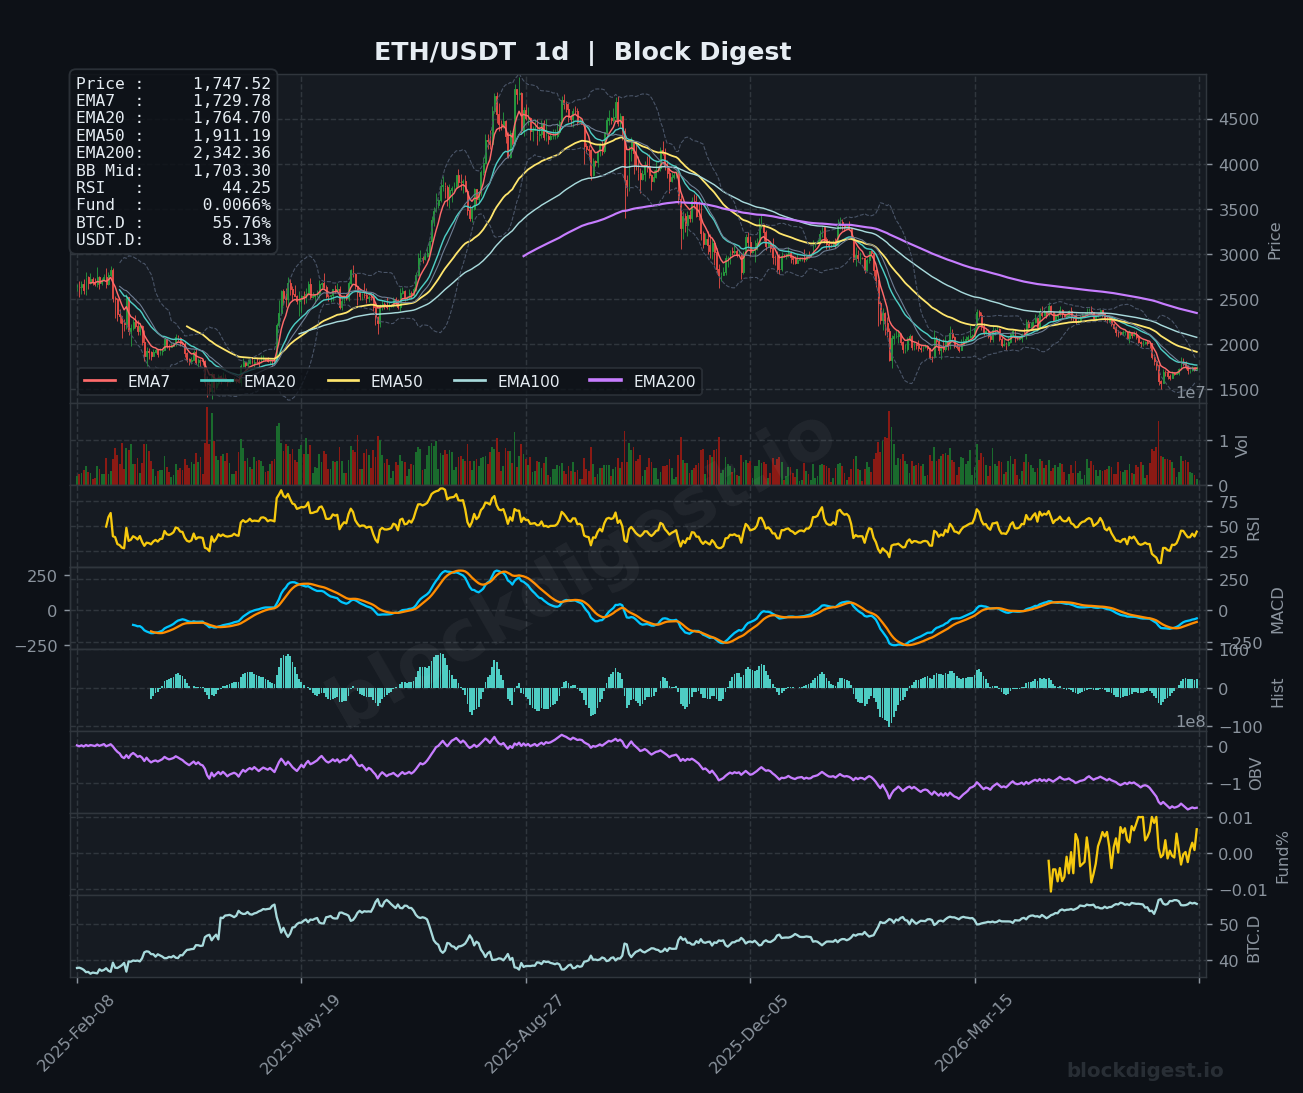
The weekly, daily, and 4-hour timeframes all share a consistent bearish narrative, with no meaningful bullish divergence yet confirmed across all three. On the daily chart, price sits below all major EMAs — EMA7 ($1,730), EMA20 ($1,765), EMA50 ($1,911), and EMA200 ($2,342) — reinforcing the macro downtrend, though the daily RSI at 44.25 does show a mild recovery from its recent lows. The 4-hour chart offers the only near-term constructive signal, with price trading marginally above its short-term EMAs (EMA7: $1,731, EMA20: $1,728, EMA50: $1,726) and RSI recovering to 55.94, suggesting some intraweek buying pressure. However, this short-term 4h momentum has yet to translate into a meaningful daily or weekly trend reversal, and the confluence of resistance between $1,800–$1,850 across all timeframes is substantial.
Key Weekly Levels
- Weekly Resistance: $1,850 (weekly EMA7 and prior consolidation zone); $2,035–$2,050 (weekly BB midline and psychological round number); $2,133 (weekly EMA20, major macro resistance)
- Weekly Support: $1,700–$1,720 (4h BB midline and near-term structural floor); $1,570–$1,600 (recent capitulation lows and multi-year demand zone); $1,400–$1,420 (macro historical support from 2023 accumulation range)
Momentum & Volume Analysis
The weekly MACD remains in deep negative territory, with the signal line and MACD line both trending below zero and showing no imminent bullish crossover, reflecting the sustained macro selling pressure. Weekly OBV has declined sharply from its 2024 highs and continues to trend lower, confirming that the price weakness is accompanied by genuine volume distribution rather than a liquidity vacuum. On the 4-hour timeframe, the MACD is attempting a bullish crossover near the zero line, and the histogram has shifted positive — a short-term encouraging sign, but insufficient to counter the daily and weekly bearish MACD posture. The funding rate of +0.0066% is nearly neutral, which is notable given the recent low-price environment; it suggests the market is neither aggressively short nor positioned for a squeeze, implying genuine uncertainty rather than speculative excess in either direction.
BTC Dominance & Altcoin Implications
BTC dominance currently sits at 55.76% and, based on the 4h chart’s BTC.D panel, has been in a sustained uptrend since early in the observed window, reflecting continued capital rotation away from altcoins and into Bitcoin. USDT dominance at 8.13% remains elevated, indicating a significant portion of market participants are holding stablecoins rather than deploying into risk assets — a defensive posture that typically delays any meaningful altcoin recovery. Until BTC.D shows a convincing reversal from this elevated level alongside a decline in USDT.D, ETH and the broader altcoin market are likely to remain under sustained relative pressure.
Risk Scenarios
- Bull case: A sustained hold above $1,750 on the weekly close, followed by a breakout above the $1,850 EMA7 resistance with meaningful volume, would open the path toward the $2,035 BB midline and eventually the $2,133 EMA20. A catalyst such as improved macro conditions, ETH-specific developments (ETF inflows, protocol upgrades), or a BTC dominance reversal could accelerate this recovery toward the $2,300–$2,500 range over the coming months.
- Bear case: Failure to hold $1,700 on a weekly closing basis would expose the critical $1,570–$1,600 capitulation low; a confirmed weekly close below that level would be structurally devastating, opening the door to a test of the $1,400–$1,420 macro support zone and potentially triggering a fresh wave of altcoin liquidations across the market.
Weekly Outlook
The directional bias for the week ahead is cautiously neutral with a slight bearish lean, as the higher timeframe structure remains firmly downward and the current bounce off lows lacks the volume and momentum confirmation necessary to declare a trend reversal. The $1,750–$1,850 zone is the pivotal battleground this week — bulls need to claim and hold this range to build any credibility for a recovery thesis, while bears will look to fade any approach toward $1,850 given the dense EMA resistance overhead. Key catalysts to monitor include any macro risk-on/risk-off shifts driven by Fed commentary or USD movements, BTC price action and its impact on dominance dynamics, and whether ETH can sustain above its short-term 4h EMA cluster. The weekly RSI approaching oversold at 34.25 is the most compelling argument for a near-term bounce, but historically ETH has spent extended periods in oversold territory during bear phases, so this alone is not a sufficient buy signal. Overall risk/reward for new long positions is marginal until a clear weekly structure reclaim is confirmed.
Disclaimer: This analysis is for informational purposes only and does not constitute financial advice. Cryptocurrency markets are highly volatile and unpredictable. All trading decisions should be made based on your own research and risk tolerance. Block Digest is not responsible for any financial losses incurred as a result of acting on this content.
Stay Ahead of the Market
Follow BlockDigest for crypto market intelligence, research and real-time updates.