
Market Overview
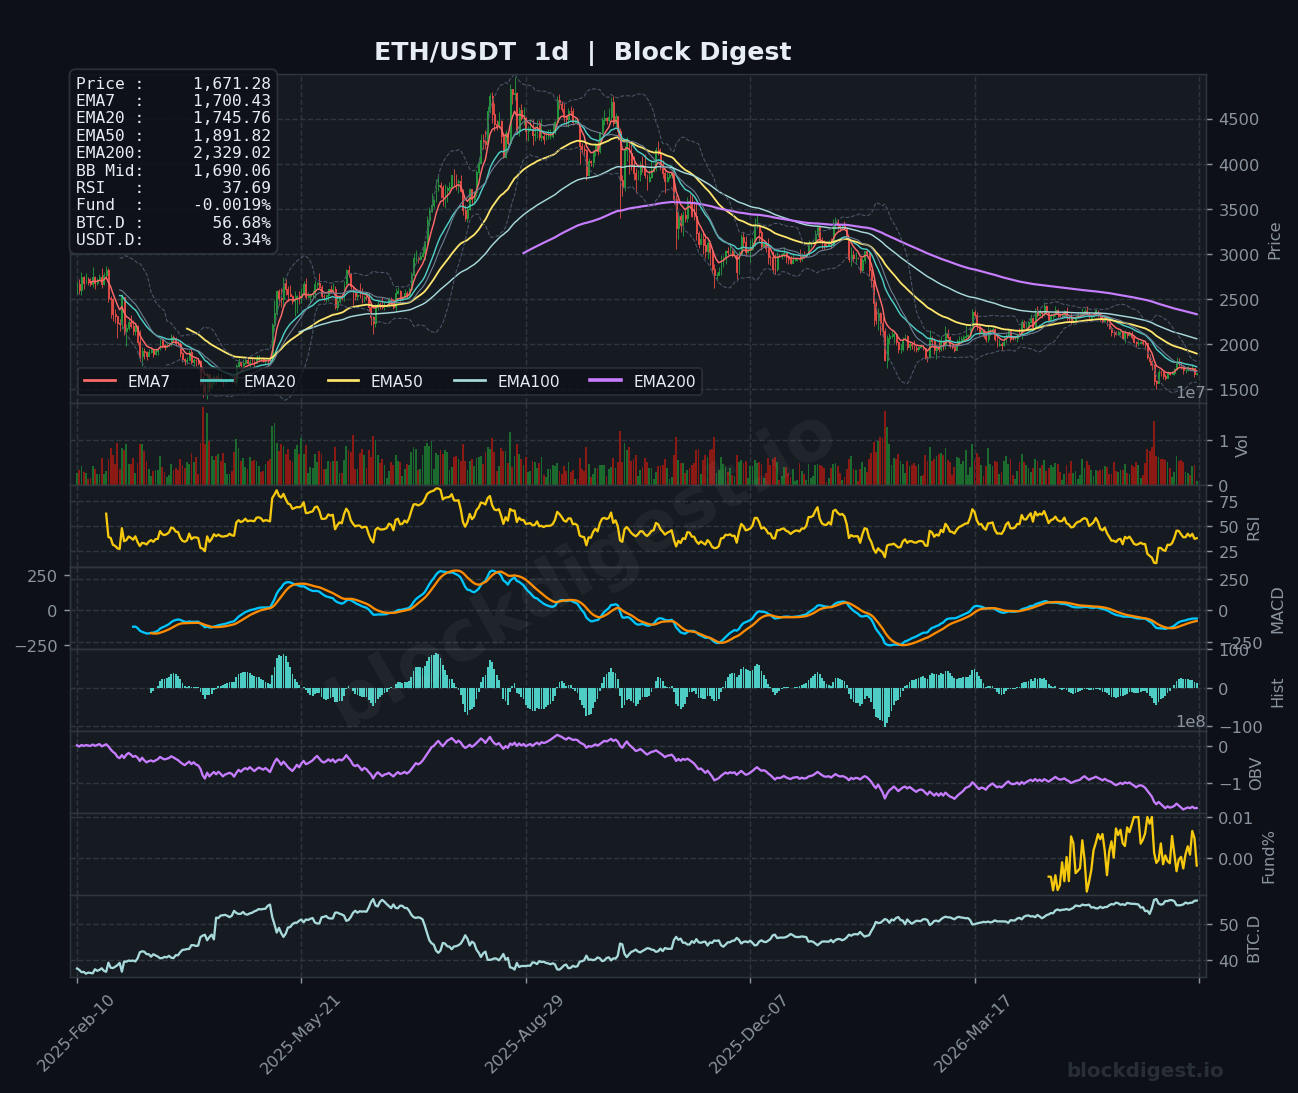
ETH/USDT is currently trading at $1,671.28, sitting in a structurally weak position across all timeframes. On the daily chart, price is trading well below all major EMAs — the EMA7 at $1,700.43, EMA20 at $1,745.76, EMA50 at $1,891.82, and the EMA200 at $2,329.02 — confirming that the dominant trend remains firmly bearish. The Bollinger Band midline on the daily sits at $1,690.06, with price currently pressing below it, suggesting continued downward pressure. The broader macro structure on the 1D chart reflects a prolonged distribution phase that has been in place since the highs above $4,000, and there is no clear structural reversal yet in evidence.
Multi-Timeframe Confluence
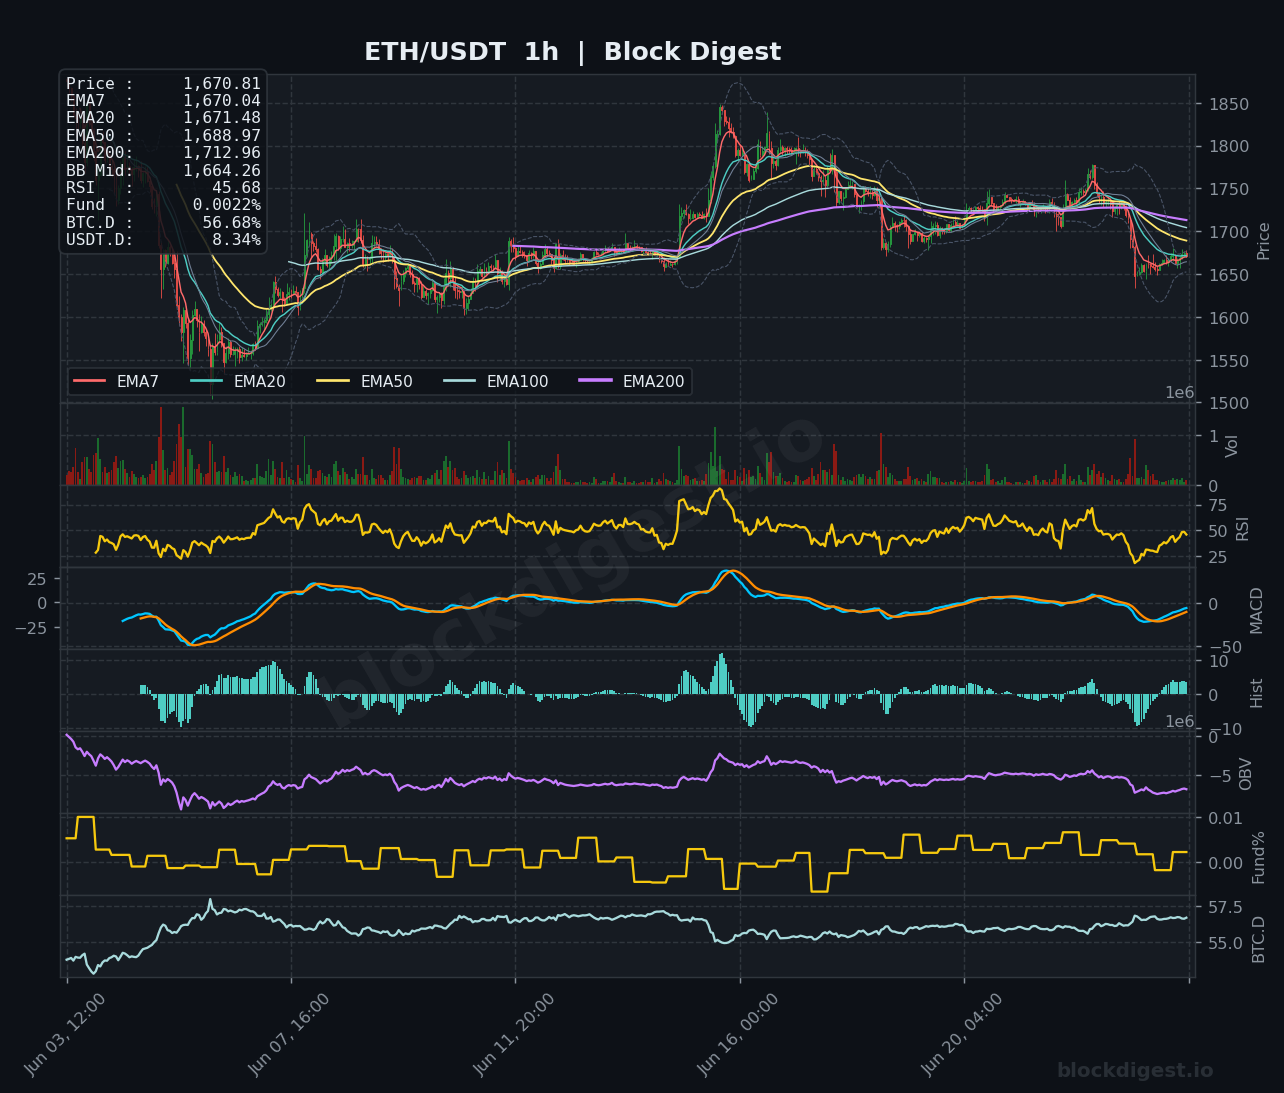
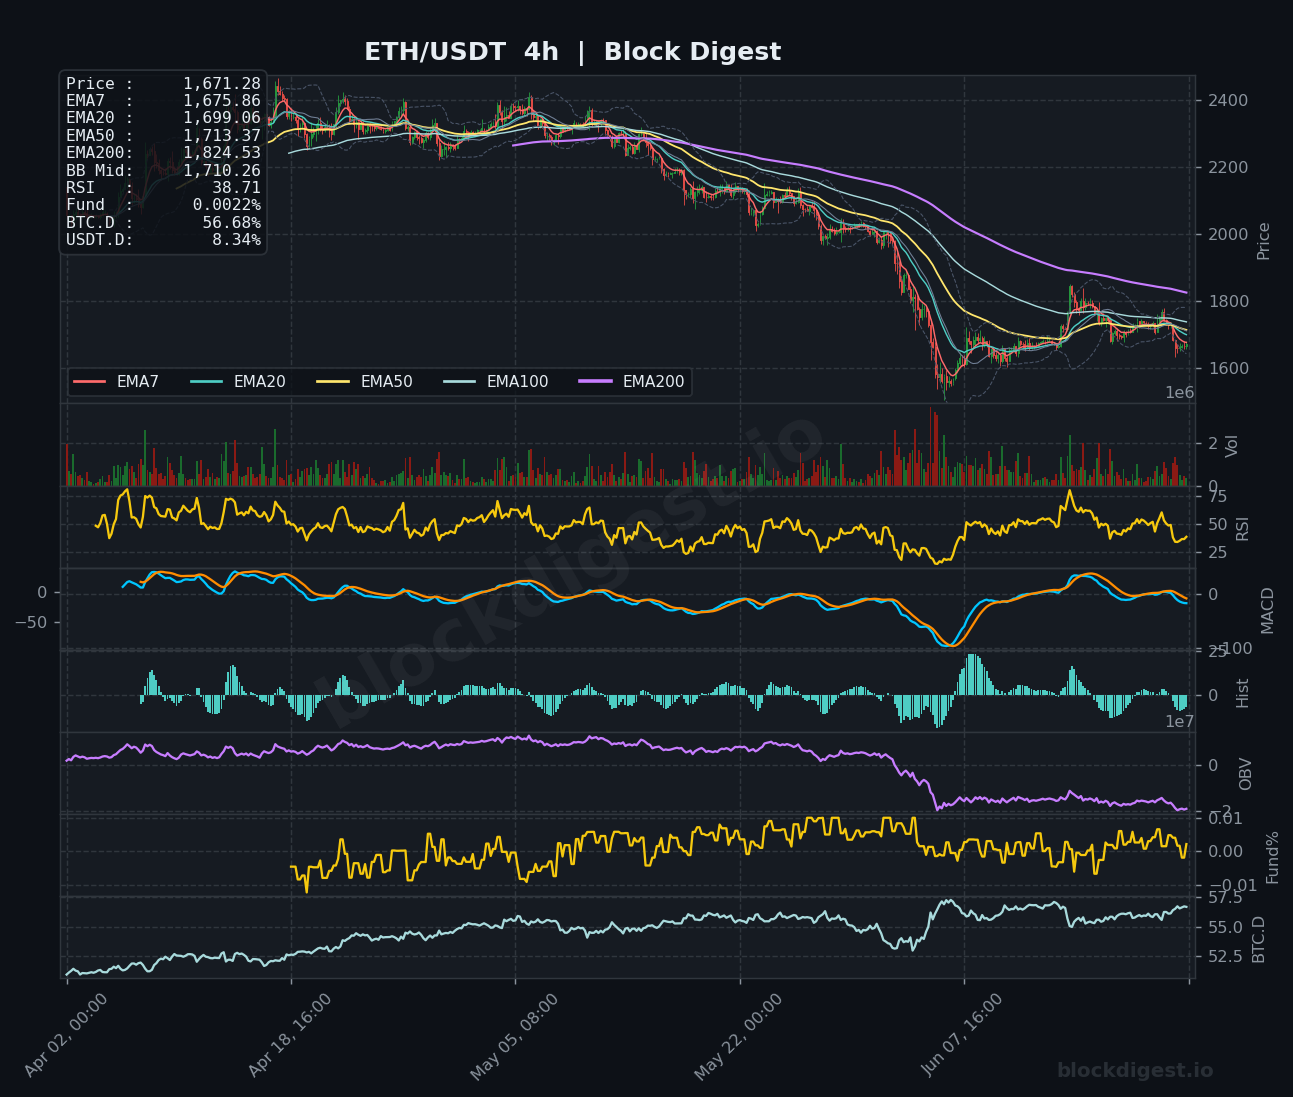
On the 1-hour chart, price is trading essentially flat against its short-term EMAs (EMA7: $1,670.04, EMA20: $1,671.48), indicating near-term indecision following a sharp recent sell-off. The 4-hour chart presents a more definitively bearish picture, with price sitting below EMA7 ($1,675.86), EMA20 ($1,699.06), EMA50 ($1,713.37), and the EMA200 at $1,824.53 — a full bearish EMA stack with no sign of imminent reclamation. The 1-hour and 4-hour timeframes are broadly in agreement with the daily bearish trend, with any short-term bounces likely to encounter selling pressure at the cluster of overhead EMAs between $1,699 and $1,713 on the 4H chart.
Key Levels to Watch
- Resistance: $1,699–$1,713 — 4H EMA20 and EMA50 confluence zone, the most immediate overhead barrier that bulls must reclaim to show any meaningful recovery intent
- Resistance: $1,745–$1,750 — Daily EMA20 at $1,745.76, a level that capped multiple recent bounces and represents the threshold for a more significant trend shift
- Resistance: $1,824 — 4H EMA200, a major structural resistance that aligns with the broader bear trend and would require substantial buying conviction to breach
- Support: $1,650 — Nearest psychological and recent structural low; a sustained break here opens the door to accelerated downside
- Support: $1,600 — Round-number support and prior consolidation region; represents a significant psychological floor for market participants
- Support: $1,540–$1,550 — Deeper structural support visible on the daily chart from prior accumulation; this zone would be the key target in a breakdown scenario
Momentum & On-Chain Signals
The RSI readings paint a consistently weak picture across timeframes: 45.68 on the 1H, 38.71 on the 4H, and 37.69 on the 1D — all below the neutral 50 level and approaching oversold territory on the higher timeframes without yet triggering a meaningful bounce. The 4H MACD remains in negative territory with the signal line and MACD line both below zero, though the histogram shows signs of slight compression, hinting at a possible deceleration in bearish momentum rather than a reversal. OBV on both the 4H and 1D charts continues to trend lower, confirming ongoing distribution and a lack of meaningful accumulation at current prices. The funding rate is essentially neutral at +0.0022% on the 1H/4H and marginally negative (-0.0019%) on the daily view, suggesting the market is not yet heavily positioned in either direction — shorts are not crowded enough to trigger a meaningful squeeze.
BTC Dominance & Market Sentiment
BTC dominance stands at 56.68%, a reading that reflects continued capital rotation favoring Bitcoin over altcoins and represents a headwind for ETH specifically. USDT dominance at 8.34% signals a meaningful degree of risk-off positioning, with capital parked in stablecoins rather than being actively deployed into the altcoin market. Together, these readings suggest the broader market environment remains cautious, limiting the probability of a sustained ETH rally without a catalyst-driven shift in macro sentiment.
Risk Scenarios
- Bullish case: A decisive hourly close above the $1,699–$1,713 EMA cluster on the 4H chart, accompanied by rising OBV and RSI reclaiming 50, would open a path toward the $1,745–$1,750 daily EMA20 zone and potentially $1,824 over the following days.
- Bearish case: Failure to hold the $1,650 support zone and a confirmed breakdown on the 4H close would expose the $1,600 handle, with momentum-driven continuation targeting the $1,540–$1,550 structural support zone below.
Outlook
The overall bias remains cautiously bearish heading into the next 24–48 hours, with ETH trading below all major EMAs across every timeframe and momentum indicators aligned to the downside. The immediate focus is on whether price can stabilize and reclaim the $1,690–$1,699 range — the BB midline and 4H EMA20 — as any failure to do so maintains the path of least resistance to the downside. A shift in thesis would require a convincing reclaim of $1,713 on the 4H with improved volume and OBV support, while a daily close below $1,650 would invalidate any near-term recovery narrative. Until BTC dominance shows signs of peaking and broader risk appetite returns, ETH faces a challenging environment where rallies are likely to be sold into.
Disclaimer: This analysis is for informational purposes only and does not constitute financial advice. Cryptocurrency markets are highly volatile and unpredictable. All trading decisions should be made based on your own research and risk tolerance. Block Digest is not responsible for any financial losses incurred as a result of acting on this content.
Stay Ahead of the Market
Follow BlockDigest for crypto market intelligence, research and real-time updates.


