
Market Overview
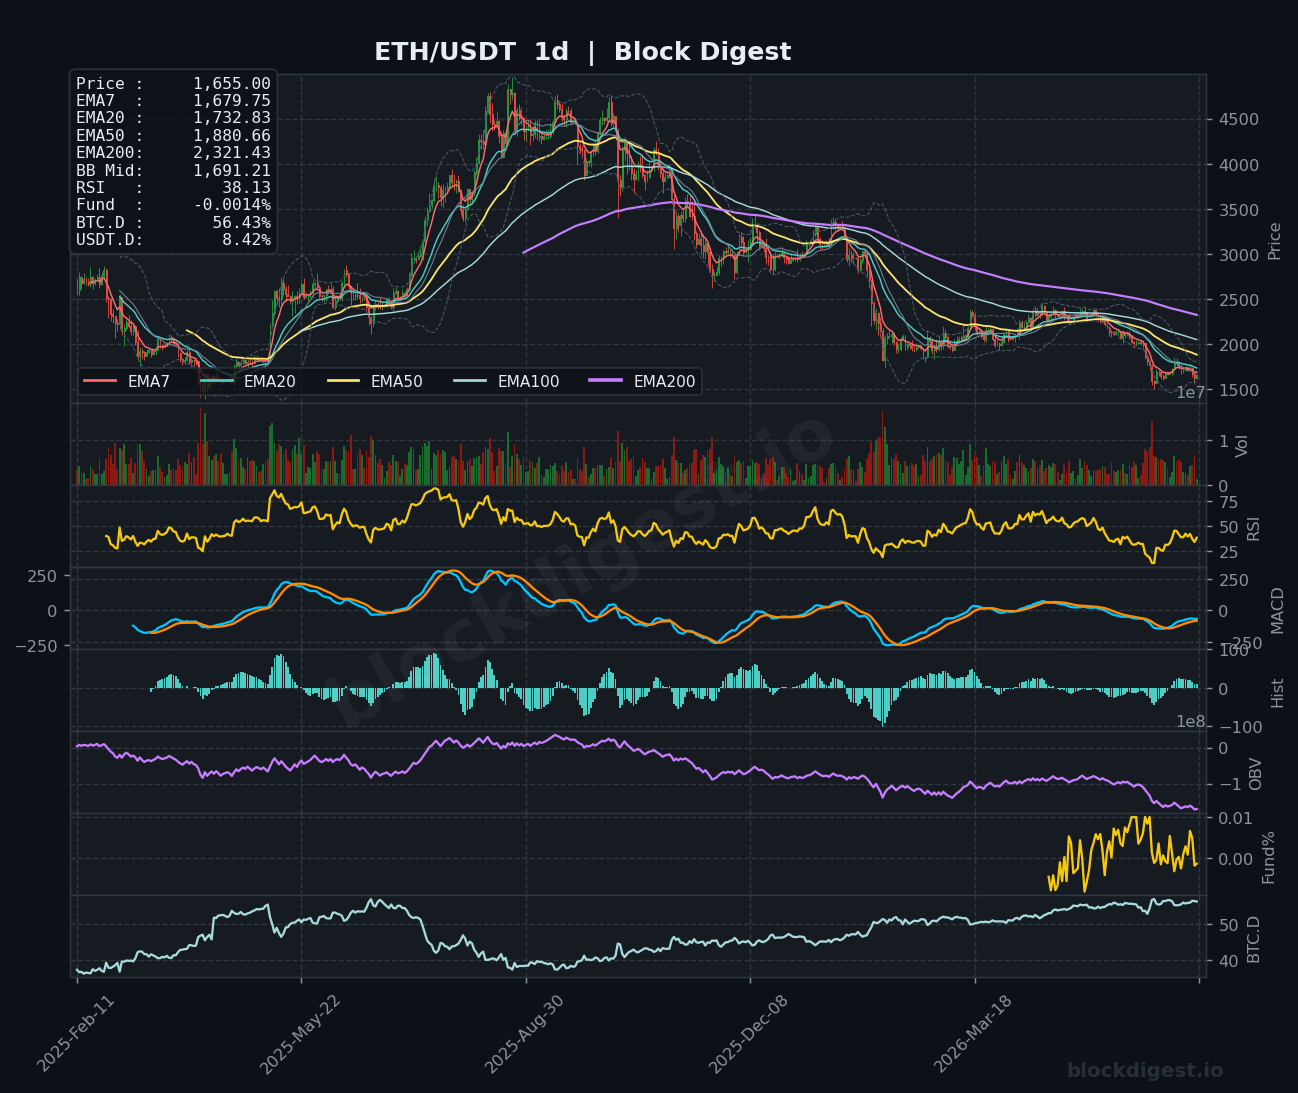
ETH/USDT is currently trading at $1,655.00, situated in a structurally weak position across all major timeframes. On the daily chart, price remains well below all key EMAs — the EMA7 at $1,679.75, EMA20 at $1,732.83, EMA50 at $1,880.66, and the distant EMA200 at $2,321.43 — confirming a sustained downtrend that has been in place since the highs above $4,000. Price is also trading below the daily Bollinger Band midline at $1,691.21, reinforcing bearish market structure. The dominant daily trend is unambiguously bearish, with the EMA stack in full descending order and no meaningful signs of macro trend reversal.
Multi-Timeframe Confluence
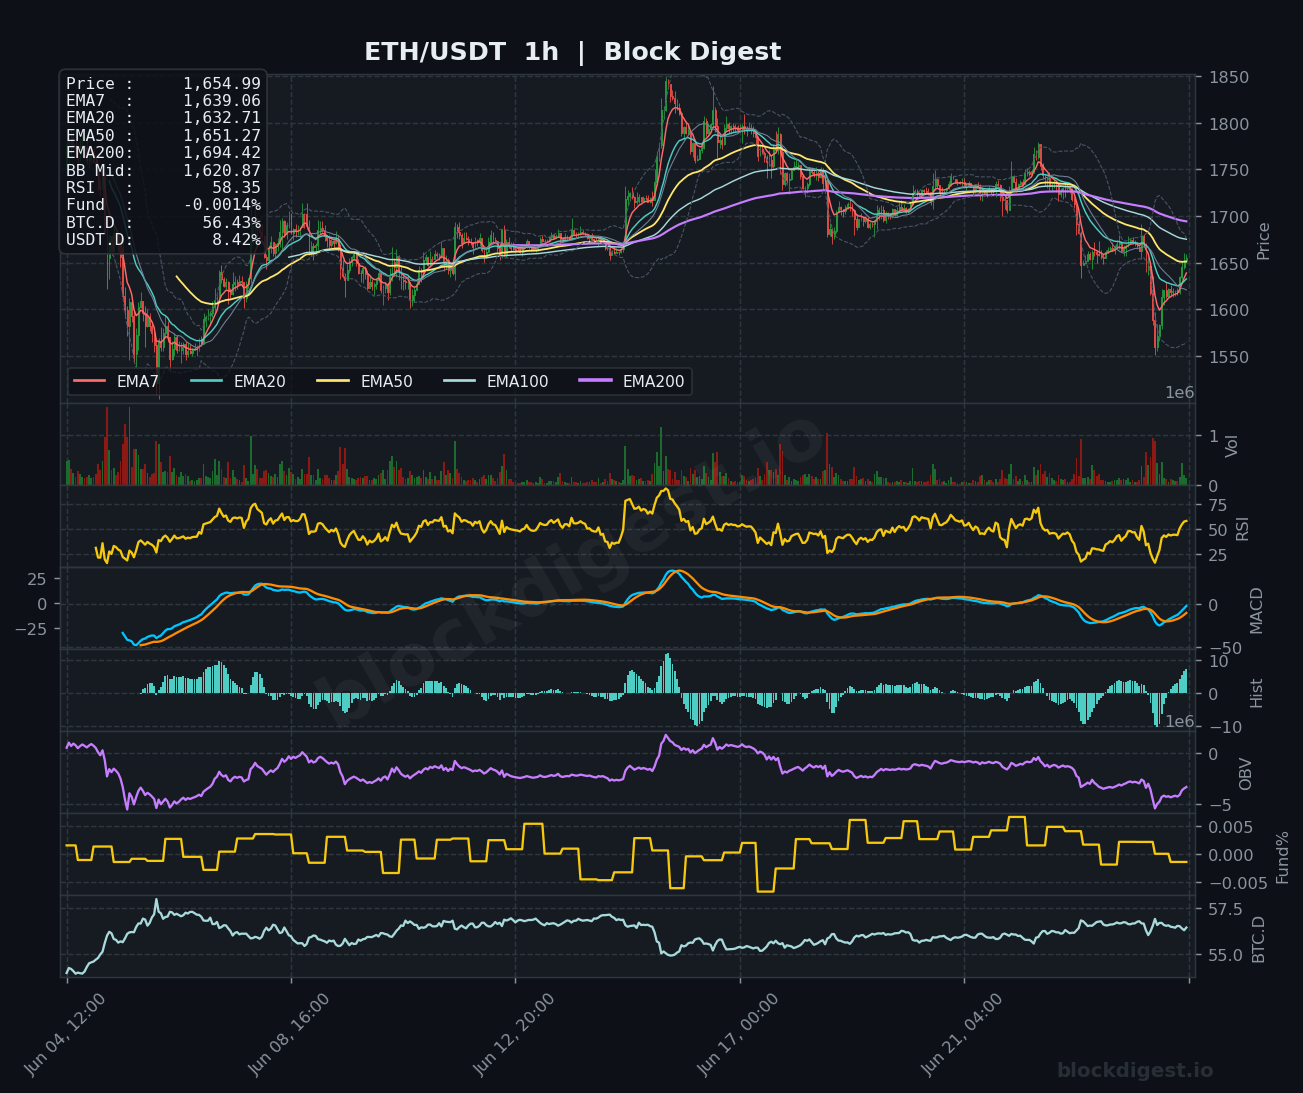
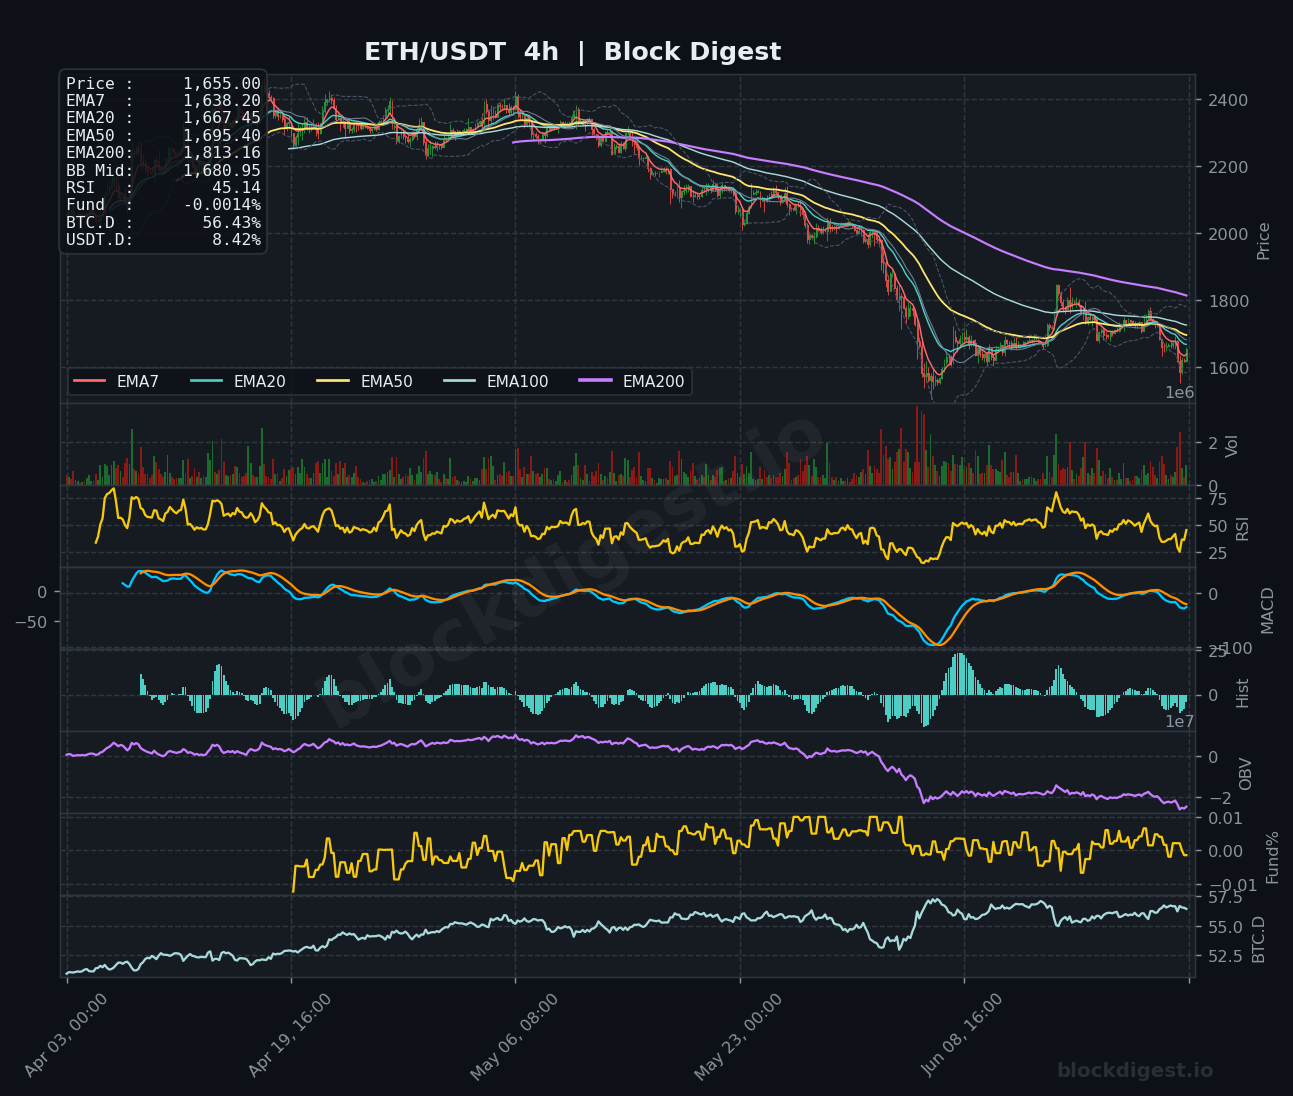
Across all three timeframes, the EMA configurations tell a consistent bearish story, though short-term price action is showing early stabilization attempts. On the 1-hour chart, price has reclaimed ground above EMA7 ($1,639.06) and EMA20 ($1,632.71) and is pressing against EMA50 ($1,651.27), suggesting a minor intraday recovery after a recent sharp sell-off toward $1,550. The 4-hour chart shows price trading below all major EMAs — EMA7 at $1,638.20, EMA20 at $1,667.45, EMA50 at $1,695.40, and EMA200 at $1,813.16 — with the 4H BB midline at $1,680.95 acting as a key overhead reference. Higher timeframe resistance remains dense and layered, meaning any short-term bounce is likely to face meaningful selling pressure before the $1,700–$1,730 zone.
Key Levels to Watch
- Resistance: $1,680–$1,695 — 4H EMA7/EMA50 cluster and the 4H Bollinger Band midline; a zone where sellers have consistently re-engaged during this downtrend
- Resistance: $1,730–$1,735 — Daily EMA20 and a prior consolidation ceiling; reclaiming this level would be the first meaningful structural shift
- Resistance: $1,813 — 4H EMA200, a major macro overhead level that has capped rallies throughout the recent decline
- Support: $1,620–$1,632 — 1H BB midline and short-term EMA cluster; near-term floor for the current intraday recovery
- Support: $1,575–$1,585 — Recent swing low zone tested during the most recent flush; a break below here opens the path toward the $1,500 psychological level
- Support: $1,540–$1,550 — Structural base from the most recent capitulation candle; losing this level on a daily close would signal significant demand failure
Momentum & On-Chain Signals
The RSI readings reflect the multi-timeframe weakness clearly: daily RSI sits at a depressed 38.13, hovering near oversold territory but not yet producing a confirmed reversal signal; the 4-hour RSI at 45.14 is neutral-to-bearish; and the 1-hour RSI at 58.35 is recovering modestly, consistent with the short-term bounce. On the MACD front, the 4H MACD lines are attempting a bullish curl from deeply negative levels, with histogram bars contracting — a tentative sign of momentum exhaustion in the sell-off, though no confirmed crossover has occurred. The OBV on the 4H chart shows a pronounced step-down during the recent decline and has not recovered, indicating distribution rather than accumulation at current levels. Funding rates remain marginally negative at -0.0014%, suggesting the market is not yet positioned aggressively long, which removes immediate liquidation risk to the upside but also highlights the absence of strong conviction buyers.
BTC Dominance & Market Sentiment
BTC dominance currently reads 56.43%, a historically elevated level that signals capital concentration in Bitcoin and ongoing risk-off sentiment toward altcoins including ETH. USDT dominance at 8.42% reflects a meaningful stablecoin allocation, suggesting a portion of market participants remain sidelined or defensively positioned. For ETH specifically, elevated BTC.D continues to act as a structural headwind, as a rotation into altcoins typically requires BTC.D to roll over from these levels — a move that has not yet materialized.
Risk Scenarios
- Bullish case: A sustained hourly close above $1,695, followed by a reclaim of the $1,730–$1,735 daily EMA20 zone on meaningful volume, would suggest a relief rally toward the $1,813 4H EMA200, potentially extending to $1,880 if broader market sentiment improves alongside a softening BTC.D.
- Bearish case: Failure to hold the $1,620–$1,632 support cluster on a 4H close would likely accelerate selling pressure toward the $1,575 swing low, and a confirmed daily close below $1,550 would open a measured move toward the $1,450–$1,480 range with limited technical support in between.
Outlook
The overall directional bias for ETH remains bearish on the higher timeframes, with the current price action best characterized as a short-term technical bounce within an ongoing downtrend. The critical triggers to watch over the next 24–48 hours are whether price can sustain above the $1,655–$1,680 range during the U.S. session and whether the 4H MACD completes a bullish crossover to add conviction to the intraday recovery. A decisive failure below $1,620 would invalidate the short-term recovery thesis and shift attention back to $1,575 and below. Until ETH reclaims the daily EMA20 at $1,732.83 on a closing basis, any rally should be treated as a counter-trend move rather than the beginning of a structural trend reversal.
Disclaimer: This analysis is for informational purposes only and does not constitute financial advice. Cryptocurrency markets are highly volatile and unpredictable. All trading decisions should be made based on your own research and risk tolerance. Block Digest is not responsible for any financial losses incurred as a result of acting on this content.
Stay Ahead of the Market
Follow BlockDigest for crypto market intelligence, research and real-time updates.


