
Market Overview
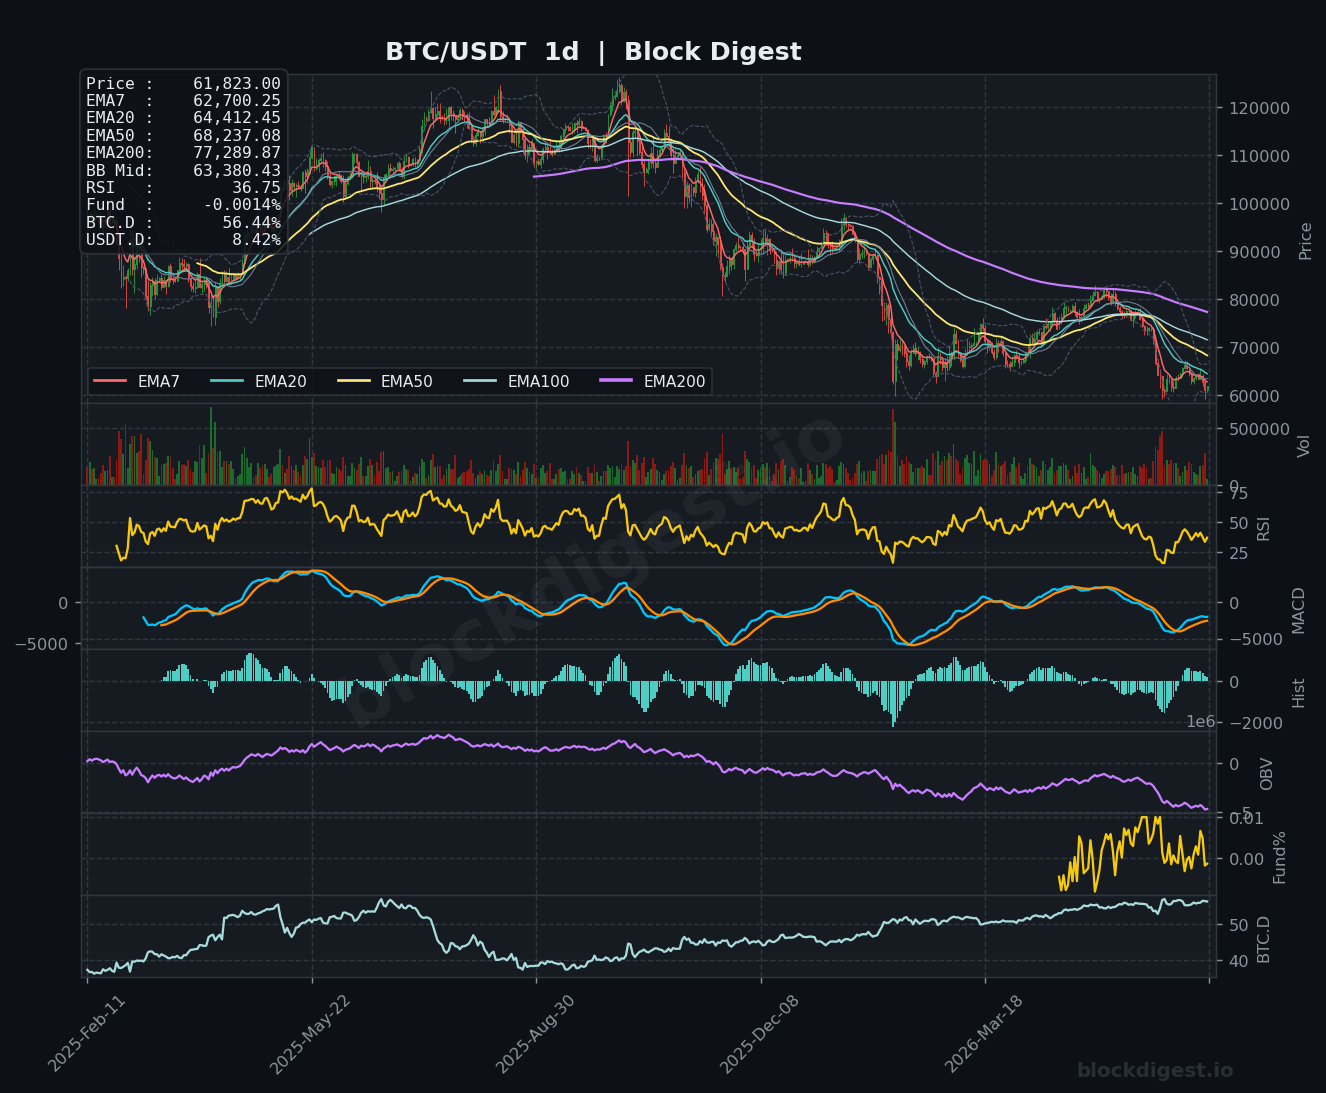
Bitcoin is currently trading at $61,823, sitting in a structurally weak position across all major timeframes. On the daily chart, price has broken decisively below all key EMAs — the EMA7 at $62,700, EMA20 at $64,412, EMA50 at $68,237, and the long-term EMA200 at $77,289 — confirming a sustained bearish trend structure. Price is also trading below the daily Bollinger Band midline at $63,380, suggesting bears remain in control of the medium-term narrative. The broader daily trend reflects a significant drawdown from cycle highs, with the current price action representing a multi-month distribution phase that has yet to show convincing exhaustion signals.
Multi-Timeframe Confluence
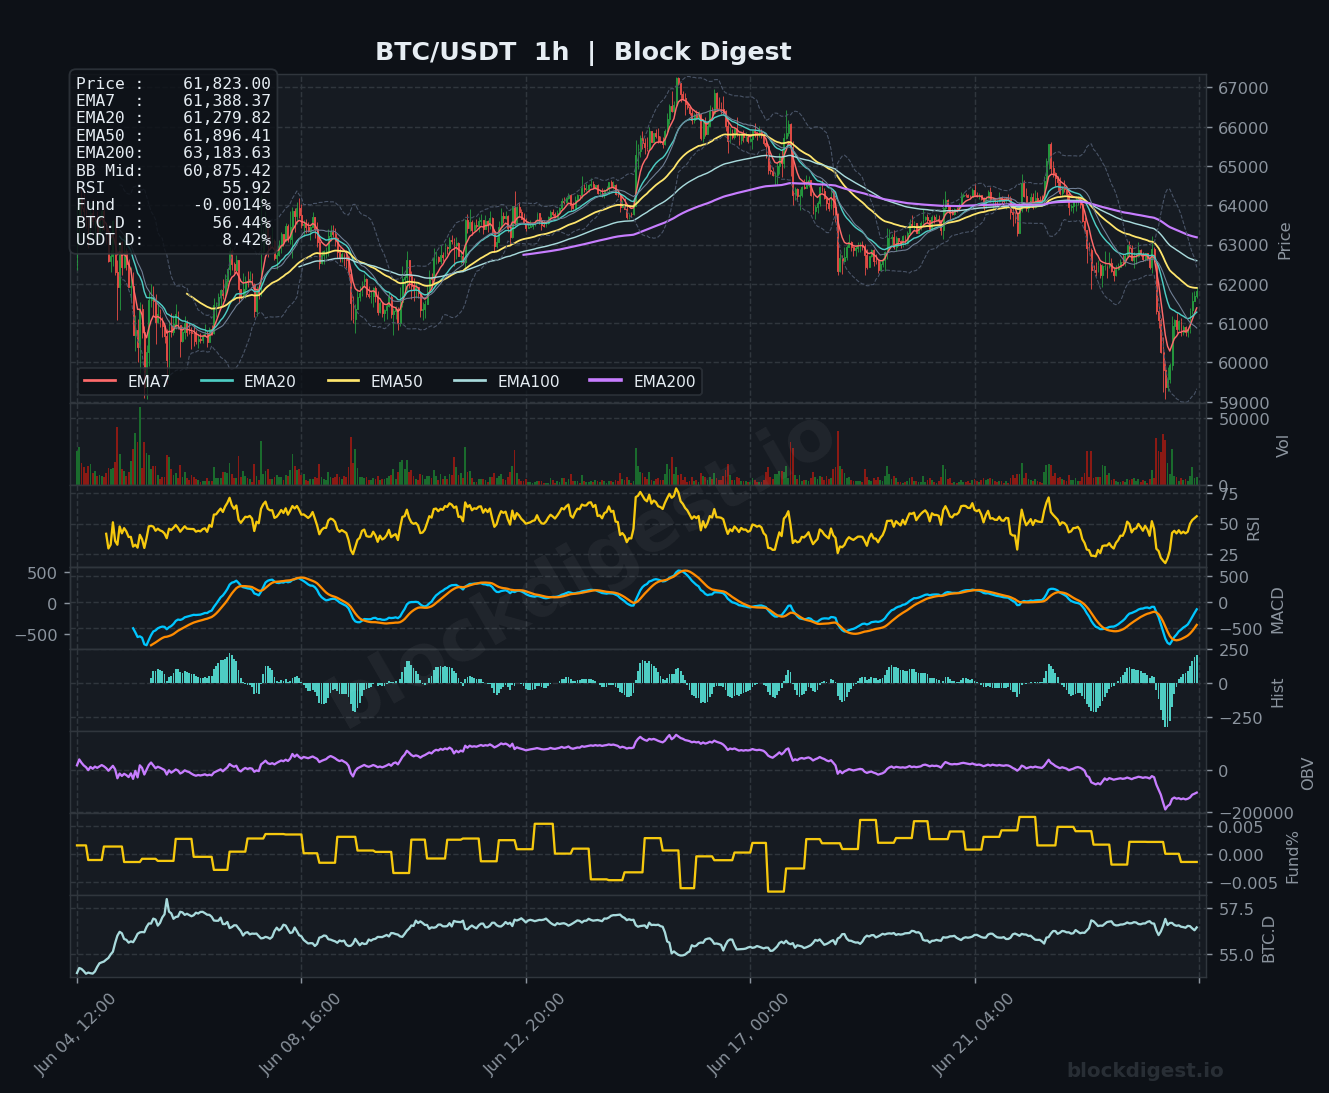
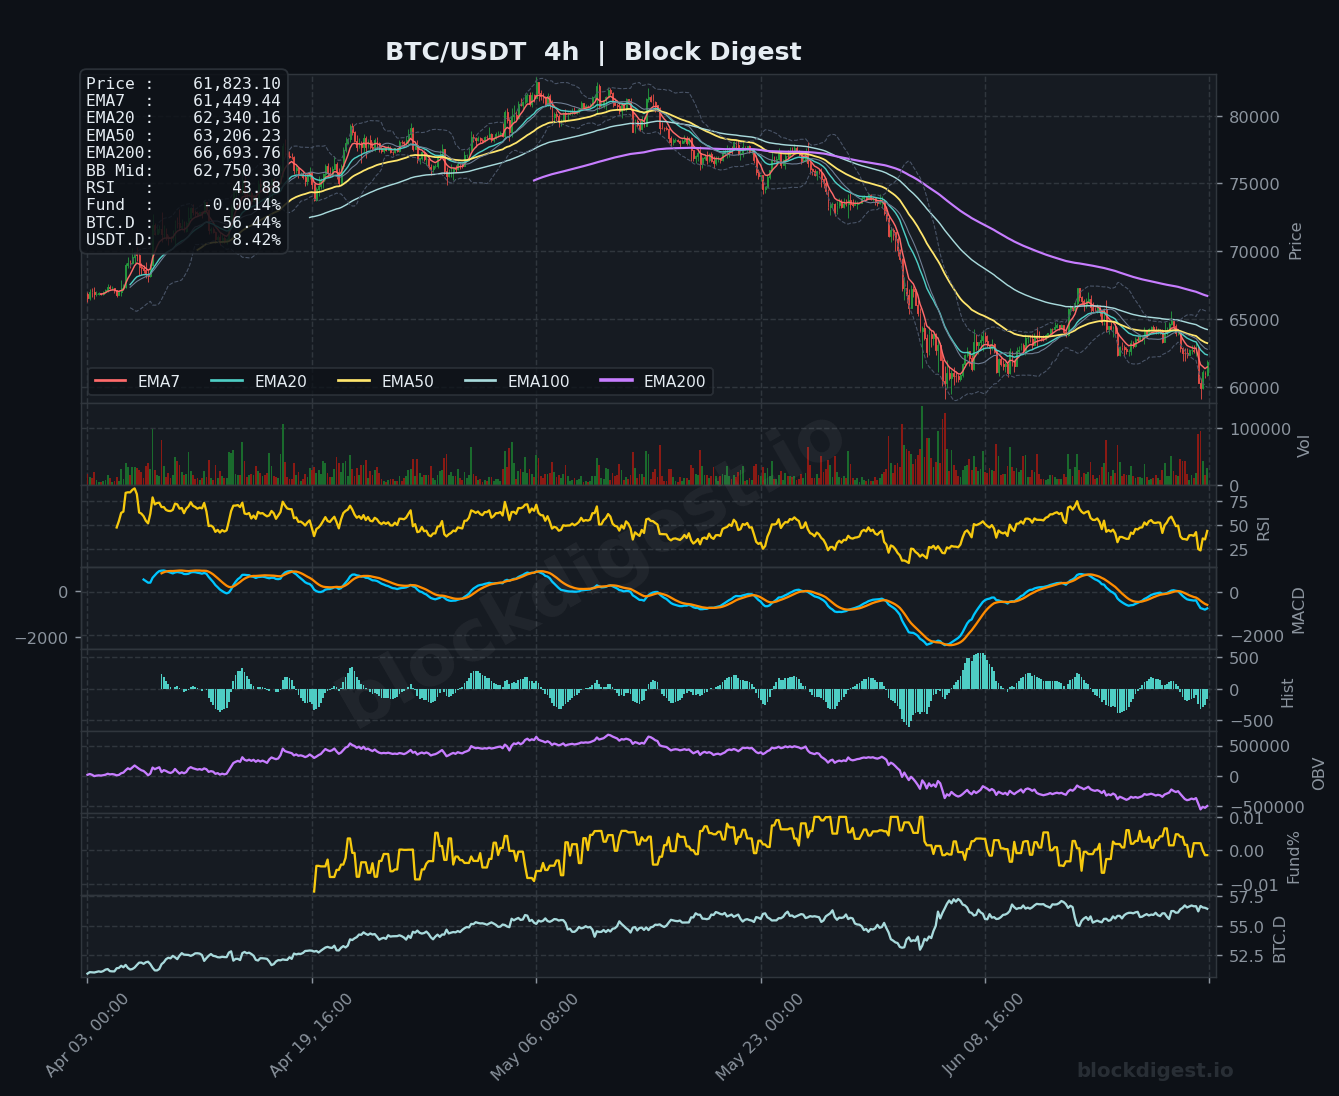
Across all three timeframes, the EMA stack is bearishly aligned, with short-term EMAs trading well below longer-term averages — a consistent signal of distribution rather than accumulation. On the 1-hour chart, price is holding fractionally above the EMA7 ($61,388) and EMA20 ($61,279), offering a thin near-term cushion, but the EMA50 ($61,896) is acting as immediate overhead resistance. The 4-hour timeframe shows price below the BB midline at $62,750 and all major EMAs converging in a bearish formation, with no meaningful recovery attempt visible. Short-term momentum on the 1-hour is mildly constructive but insufficient to challenge the dominant bearish structure on higher timeframes.
Key Levels to Watch
- Resistance: $61,896 — the 1h EMA50, acting as immediate intraday overhead resistance and a level bulls need to reclaim to stabilize price action
- Resistance: $62,750 — the 4h Bollinger Band midline, a key mean-reversion level that has capped prior relief bounces
- Resistance: $64,412 — the daily EMA20, a significant structural hurdle that would need to be reclaimed to suggest any medium-term trend reversal
- Support: $61,279 — the 1h EMA20, current near-term floor; a close below here opens the door to accelerated selling
- Support: $59,000–$60,000 — psychological round number zone and the approximate lower Bollinger Band on the 1-hour, representing the next meaningful demand cluster
- Support: $57,500–$58,000 — a broader technical support area visible on the 4h chart, aligning with prior consolidation lows and a potential last line of defense before deeper retracement
Momentum & On-Chain Signals
The RSI readings paint a mixed but cautionary picture: the 1-hour RSI sits at 55.92, showing modest near-term recovery, while the 4-hour RSI at 43.88 remains below neutral — consistent with a weak bounce within a downtrend. Most critically, the daily RSI at 36.75 is approaching oversold territory but has not yet reached the sub-30 levels historically associated with meaningful bottoms. The MACD on both the 4h and daily timeframes shows bearish signal line positioning, with histograms still negative, indicating that downside momentum has not yet fully dissipated. The OBV on all three timeframes is in a clear declining trend, confirming sustained net distribution and an absence of meaningful buying volume on the recent drops. Funding rates at -0.0014% are marginally negative, suggesting slight short bias in the perpetual market — a condition that can occasionally precede short-squeeze recoveries but is not yet extreme enough to signal a forced unwind.
BTC Dominance & Market Sentiment
BTC dominance stands at 56.44%, a relatively elevated reading that signals ongoing capital rotation away from altcoins and into Bitcoin as a relative safe haven within the crypto asset class. USDT dominance at 8.42% reflects meaningful risk-off positioning, with a notable portion of market participants holding stablecoins — consistent with broader caution and potential dry powder on the sidelines. Together, these readings suggest the market is in a defensive posture, with no clear evidence of aggressive risk appetite returning in the near term.
Risk Scenarios
- Bullish case: A sustained reclaim of $62,750 on the 4-hour timeframe, accompanied by rising OBV and RSI moving back above 50 on the daily, would suggest a credible recovery attempt targeting the $64,400 EMA20 region and potentially $65,000–$66,000 on a momentum extension.
- Bearish case: A decisive hourly close below $61,279 (1h EMA20) with expanding volume would confirm the bounce has failed, opening a path toward the $59,000–$58,000 support zone; a breach of $58,000 on a daily closing basis would signal meaningful structural deterioration.
Outlook
The current setup leans cautiously bearish with a neutral-to-defensive near-term bias. Bitcoin is trading in a no-man’s land between thin intraday support around $61,279 and stacked overhead resistance beginning at $61,896 — a compressed range that typically resolves with a directional break. The most critical trigger to watch over the next 24–48 hours is whether price can sustain above $61,279 and begin reclaiming $62,750; failure to do so keeps the path of least resistance pointed toward the $59,000 area. Until the daily RSI recovers above 45 and OBV turns upward, any bounce should be treated as a relief rally within a broader downtrend rather than a confirmed reversal.
Disclaimer: This analysis is for informational purposes only and does not constitute financial advice. Cryptocurrency markets are highly volatile and unpredictable. All trading decisions should be made based on your own research and risk tolerance. Block Digest is not responsible for any financial losses incurred as a result of acting on this content.
Stay Ahead of the Market
Follow BlockDigest for crypto market intelligence, research and real-time updates.


