Weekly Market Overview
Bitcoin endured one of its most punishing monthly closes in recent memory, shedding approximately 20% through June before staging a tentative mid-week recovery. Price briefly touched a 652-day low near $57,950 before rebounding sharply through the July 4th holiday session, reclaiming the $63,000 handle on thin volume. The weekly candle structure reflects a classic capitulation wick — a deep lower shadow probing multi-year support with a close attempting recovery — though it remains too early to confirm a meaningful reversal. The broader weekly trend remains decisively bearish, with price printing consecutive lower highs and lower lows since the all-time high region above $109,000.
Higher Timeframe Structure
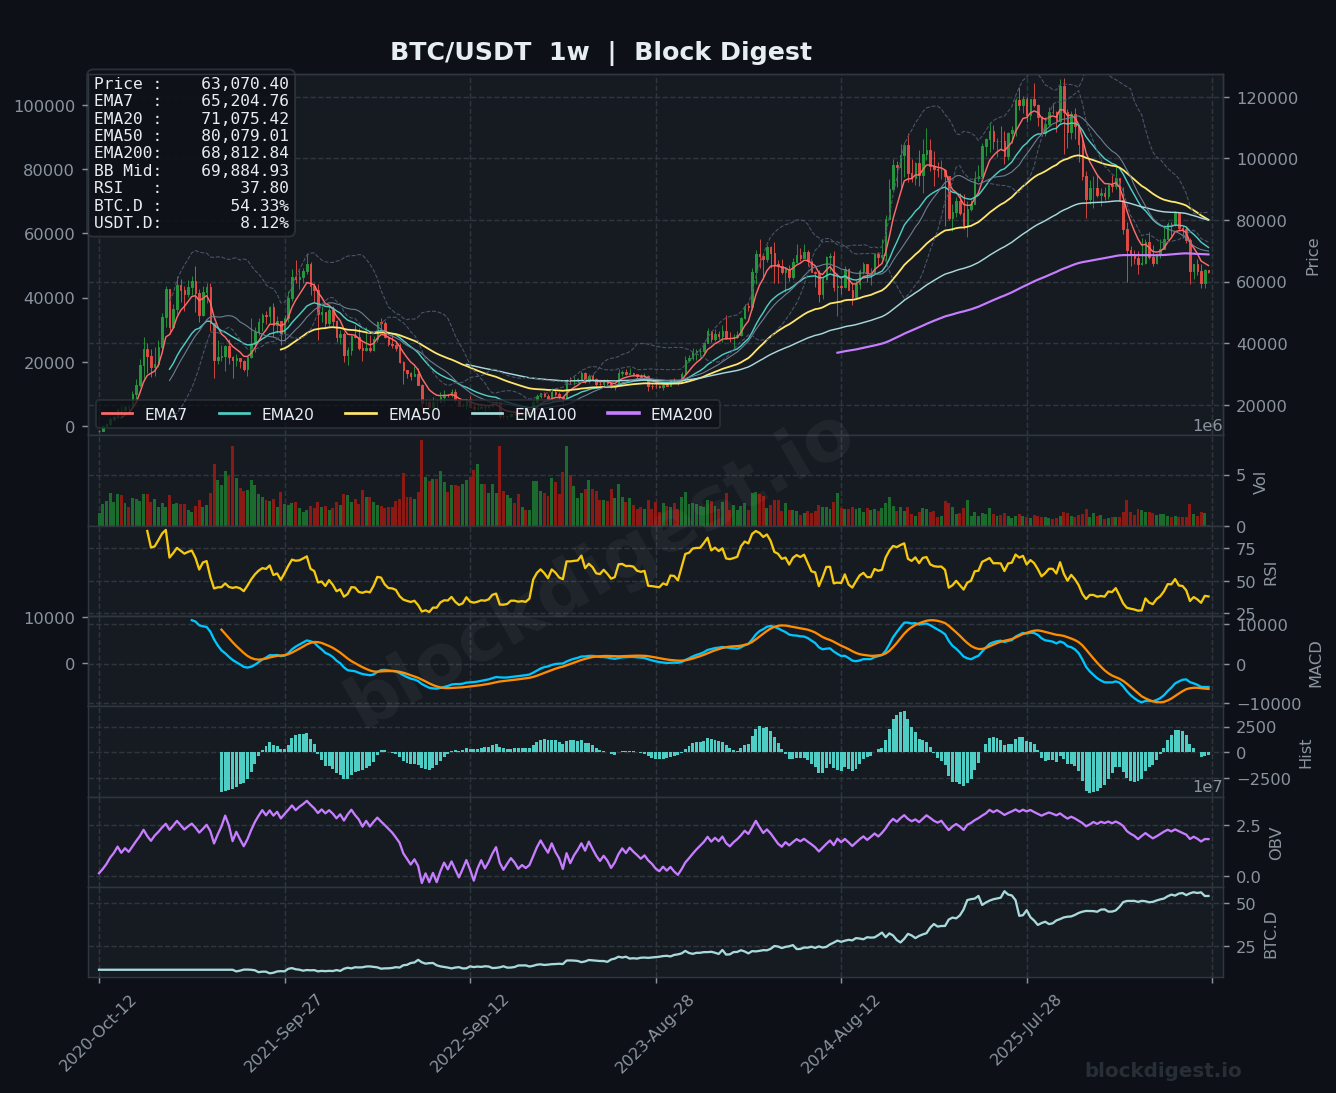
On the weekly chart, the EMA stack tells an unambiguous story: price at $63,070 sits firmly below all major exponential moving averages, with the EMA7 at $65,204, EMA20 at $71,075, EMA50 at $80,079, and EMA200 at $68,812 — a full bearish alignment that has been in force since the post-ATH rollover. The weekly Bollinger Band midline near $69,884 represents the first meaningful overhead barrier before any meaningful recovery attempt can be validated. Critically, recent weekly closes have tested and broken below the 200-week moving average — the first such violation since 2023 — marking a structural inflection point that historically separates cyclical corrections from more prolonged bear markets. The weekly RSI sitting at 37.80 remains in bearish territory, approaching but not yet printing classic oversold readings that preceded prior macro reversals.
Multi-Timeframe Confluence
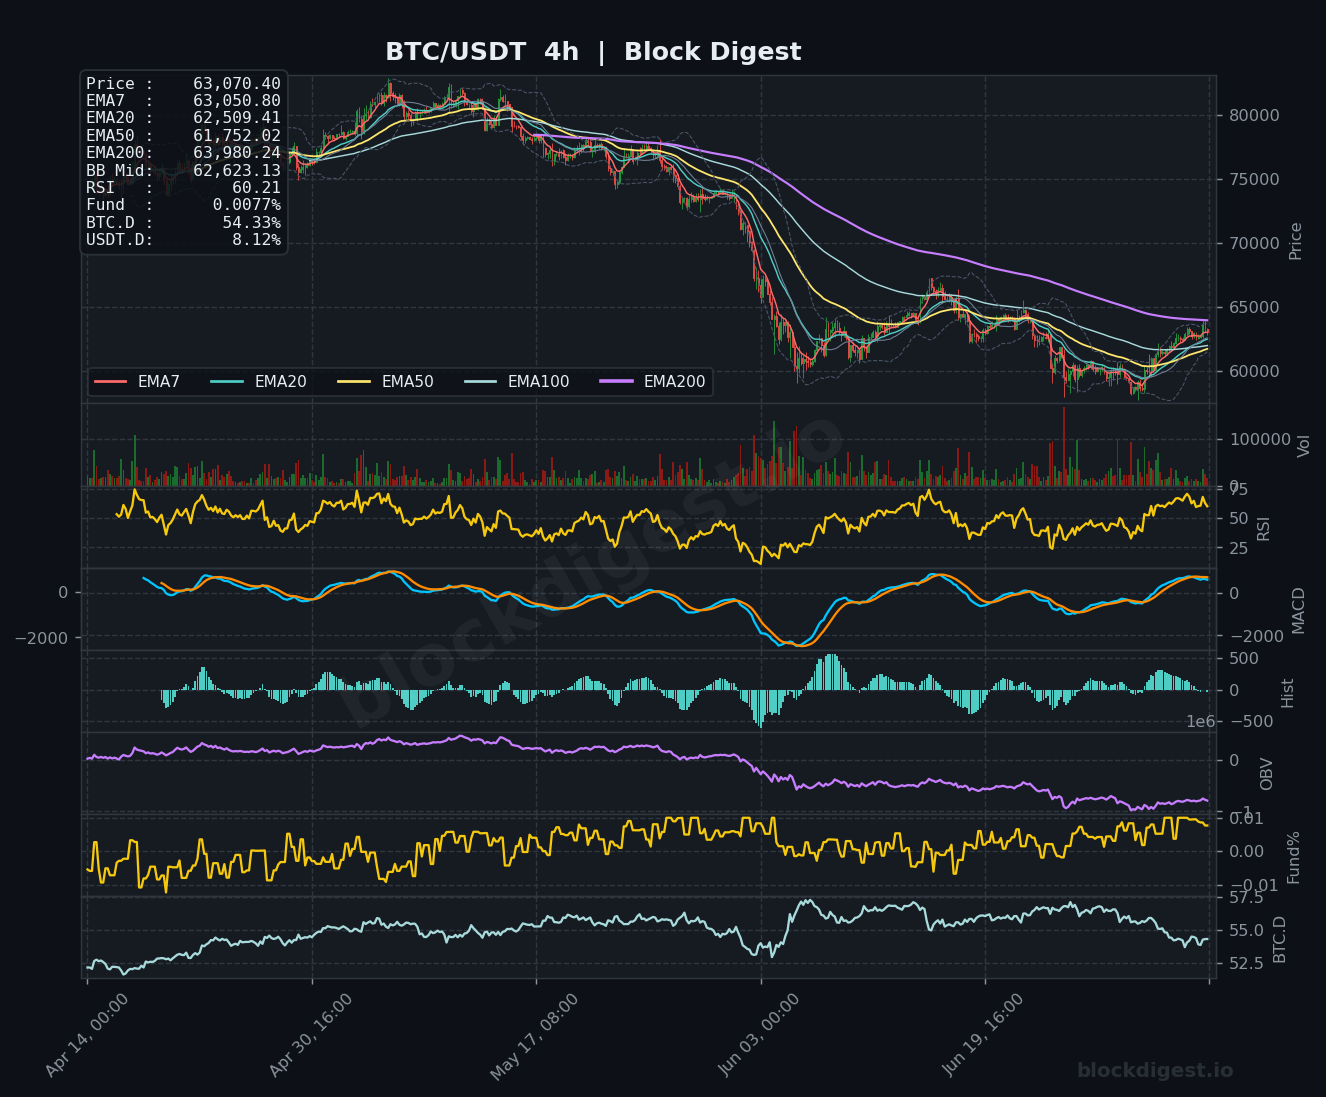
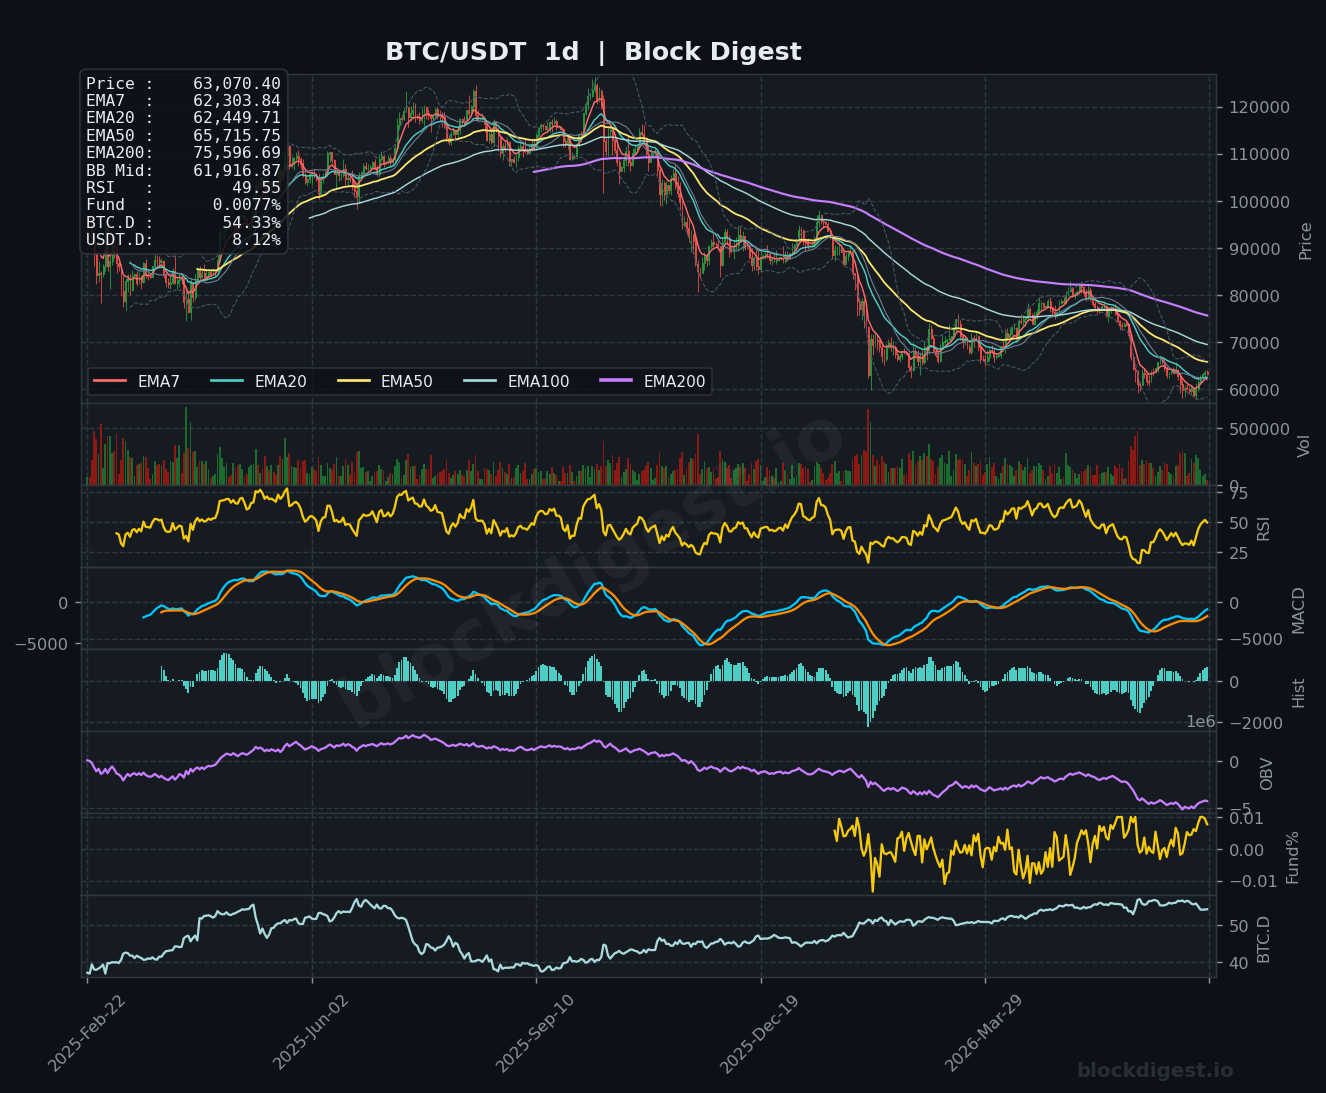
Across timeframes, the picture is uniformly bearish at the macro level but shows early-stage stabilization on the shorter intervals. The 4-hour chart shows price reclaiming its EMA7 ($63,050) and EMA20 ($62,509), with a bullish short-term EMA cross developing after the capitulation low — a constructive sign for near-term price action. However, the daily chart reveals that the EMA50 at $65,715 and the daily EMA200 at $75,596 remain distant overhead obstacles, and price has only recently bounced off deeply oversold daily RSI levels near 25 toward the current neutral reading of 49.55. The 4-hour RSI at 60.21 confirms the bounce has momentum intraweek, but this strength will need to overcome confluent resistance between $64,000 and $66,000 to change the daily and weekly narrative.
Key Weekly Levels
- Weekly Resistance: $65,200 (weekly EMA7 and immediate overhead supply); $68,800–$69,900 (weekly EMA200 and Bollinger Band midline confluence zone); $71,000–$71,100 (weekly EMA20, a level not reclaimed since the breakdown accelerated)
- Weekly Support: $60,000 (critical psychological and structural level; first weekly close below 200-week MA since 2023); $57,950 (current cycle low established during the capitulation wick); $55,000–$56,000 (next significant demand zone and historical consolidation region from the 2024 bull run base)
Momentum & Volume Analysis
The weekly MACD remains deeply negative, with the signal line continuing to slope downward and histogram bars only beginning to compress — consistent with a market in the late stages of bearish momentum rather than confirmed reversal. On the daily timeframe, MACD is attempting a bullish crossover from deeply negative territory, with histogram bars turning green over the last several sessions, which aligns with the intraweek price recovery. The weekly OBV tells a cautionary tale: it has been declining steadily since the ATH and shows no sign of accumulation at the macro level, though 4-hour OBV has begun to tick upward, reflecting the short-term buying interest. The funding rate at a near-neutral +0.0077% is notably subdued, indicating the market is not overleveraged to the long side — a healthy condition for a sustained bounce, as any recovery won’t immediately face a cascade of long liquidations.
BTC Dominance & Altcoin Implications
BTC dominance at 54.33% remains elevated and has been in a multi-month uptrend since early 2025, suggesting capital continues to concentrate in Bitcoin relative to altcoins even as the broader market sells off. USDT dominance at 8.12% reflects persistent risk-off positioning, with investors still holding meaningful dry powder on the sidelines — this could serve as jet fuel for a recovery rally if sentiment shifts. Until BTC.D shows a clear rollover and USDT.D begins declining, altcoins are unlikely to mount any sustainable independent recovery, and BTC will continue to dictate the pace and direction of broader crypto market structure.
Risk Scenarios
- Bull case: A decisive weekly close above $65,200 reclaiming the weekly EMA7 would signal that the capitulation wick near $57,950 marked a meaningful cycle low. Sustained follow-through targeting the $68,800–$71,000 resistance cluster becomes achievable if spot ETF outflows reverse and whale accumulation — reported at over 270,000 BTC in two weeks — translates into reduced sell-side pressure, with an extended target near $75,000–$76,000.
- Bear case: Failure to hold $60,000 on a weekly closing basis reactivates the breakdown scenario, with the next structural support sitting near $55,000–$56,000. A continuation of record ETF outflows combined with macro risk-off rotation into AI equities could see price test the $52,000–$54,000 range, representing a full retracement to pre-2024 bull market breakout levels.
Weekly Outlook
The directional bias for the week ahead is cautiously neutral-to-bullish on a short-term basis, but the macro weekly structure demands respect — this remains a countertrend bounce within a well-established downtrend until proven otherwise. The $64,000–$65,200 zone is the immediate litmus test: bulls need to convert this former support-turned-resistance back into a floor to build any credible case for recovery. Key catalysts to monitor include U.S. macroeconomic data (CPI, labor market prints) that could influence risk appetite, any shift in spot ETF flow data from sustained outflows to net inflows, and whether on-chain whale accumulation continues to build. The Fear & Greed Index at extreme fear (22) historically marks zones where patient buyers are rewarded, but timing the exact low in a market facing structural headwinds — from regulatory uncertainty to AI capital rotation — remains treacherous. Risk management is paramount: the $60,000 level must hold on a weekly close basis for any bullish scenario to remain viable.
Disclaimer: This analysis is for informational purposes only and does not constitute financial advice. Cryptocurrency markets are highly volatile and unpredictable. All trading decisions should be made based on your own research and risk tolerance. Block Digest is not responsible for any financial losses incurred as a result of acting on this content.
Stay Ahead of the Market
Follow BlockDigest for crypto market intelligence, research and real-time updates.