
Market Context
Bitcoin dominance sits at 54.31% — elevated but showing a gradual downtrend on the shorter timeframes — while USDT dominance at 8.18% signals that a meaningful portion of capital remains on the sidelines, tempering the enthusiasm behind this week’s altcoin bounce. The Digital Asset Market CLARITY Act clearing the Senate Banking Committee has provided a regulatory tailwind, giving XRP and DOGE in particular a short-term bid, yet broader structural weakness persists: ETF outflows across BTC, ETH, SOL, and XRP have totalled $4.4 billion over 13 sessions, and monthly active users have fallen to two-year lows. The net result is a selective, news-driven recovery rather than a broad-based altcoin rotation, with risk appetite remaining cautious beneath the surface.
Solana (SOL)
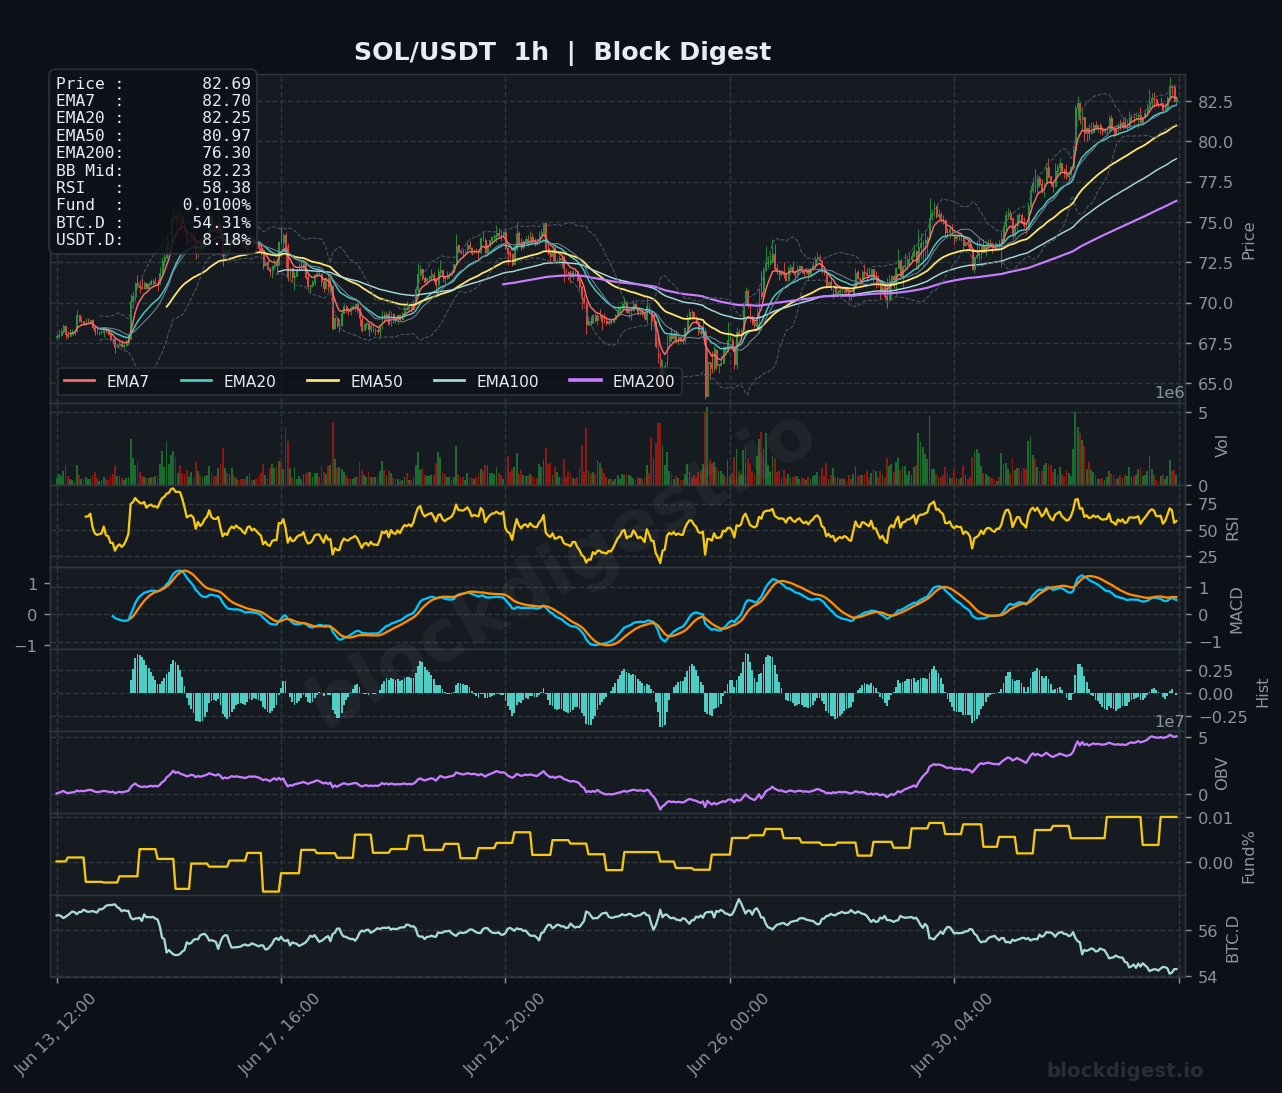
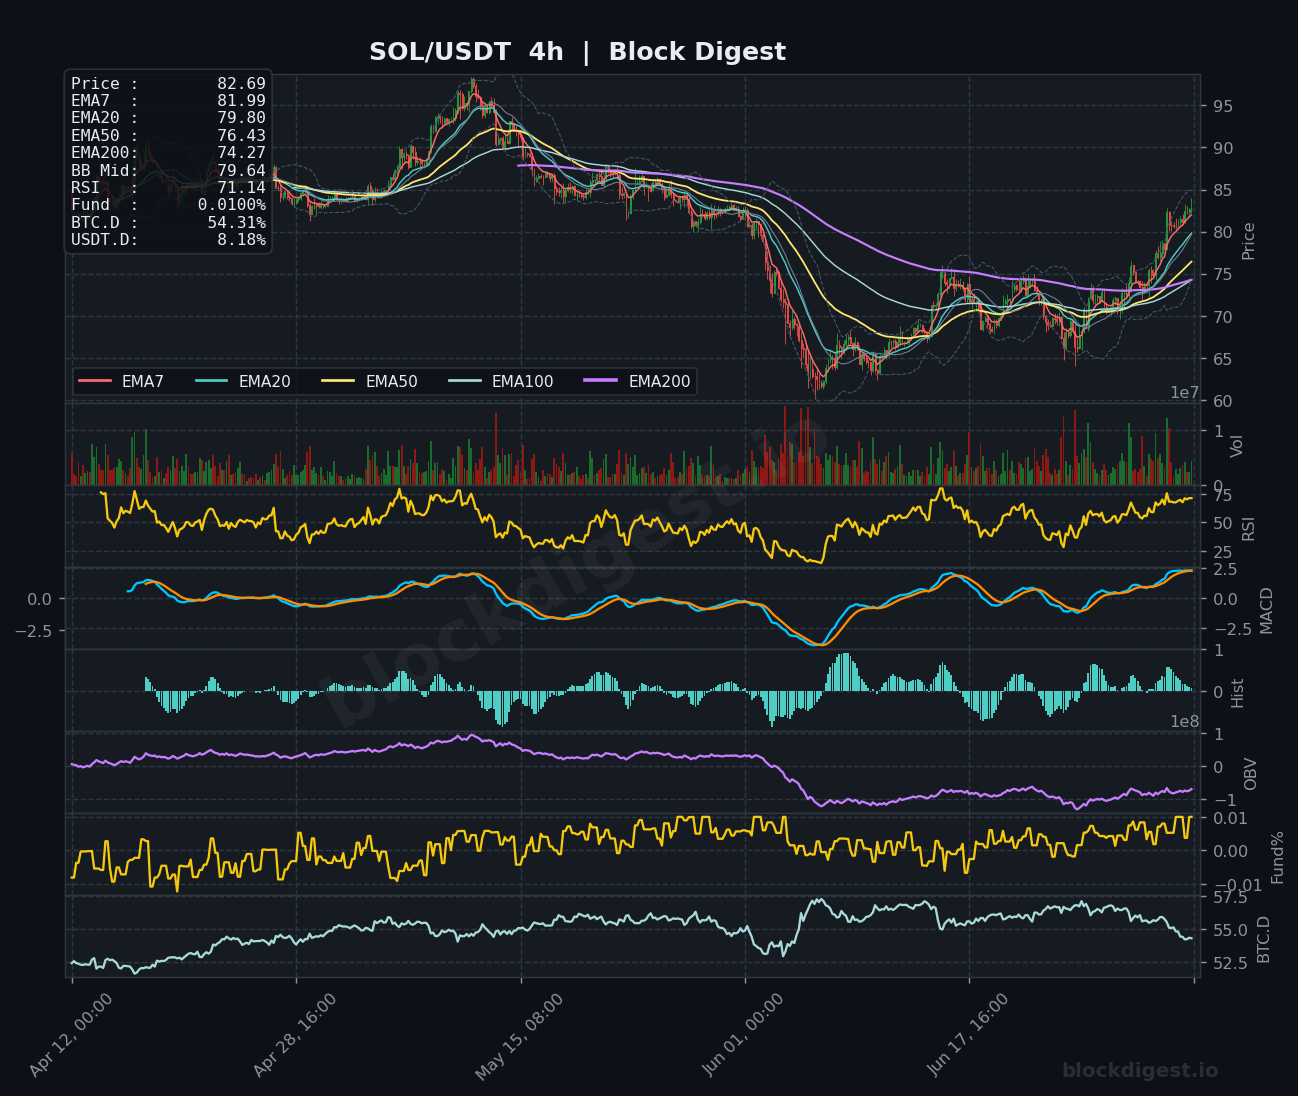
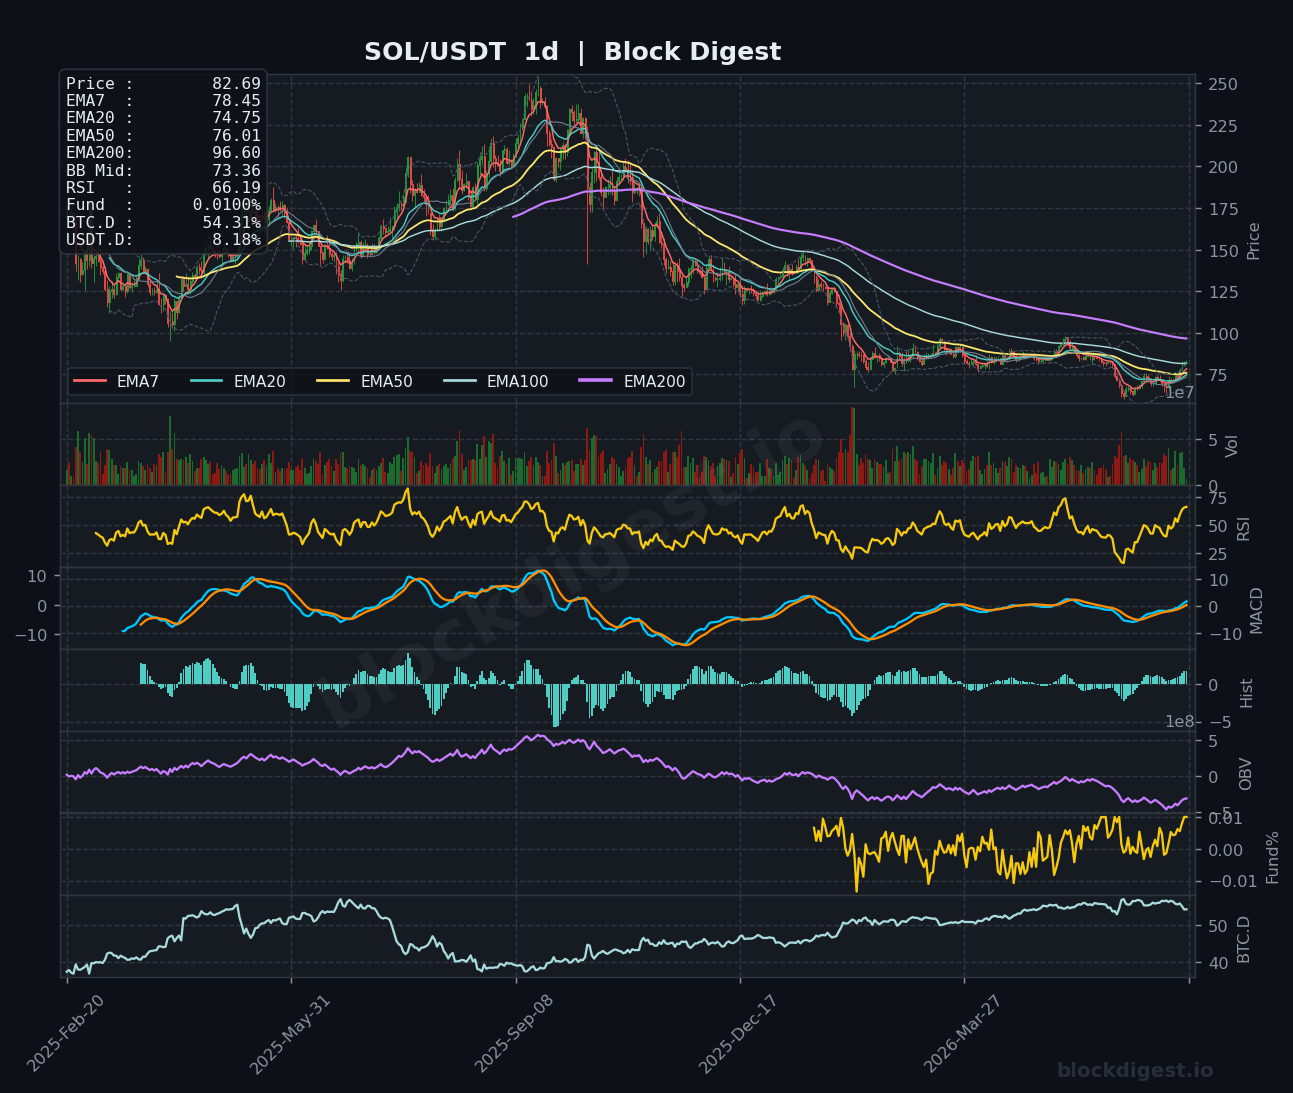
SOL is trading at $82.69, having staged an impressive recovery from lows near $65 on the 4h chart, with price now trading cleanly above the EMA7 ($82.70), EMA20 ($82.25), and EMA50 ($80.97) on the 1h — a bullish short-term stack. The 4h RSI has pushed to 71.14, approaching overbought territory, while the MACD continues its bullish crossover with a rising signal line, and the 1h OBV is trending sharply higher, confirming genuine buying pressure behind the move. On the daily, however, SOL remains well below its EMA200 ($96.60) and the EMA50 ($76.01) is still declining, meaning the macro trend remains damaged; the $84–$85 zone, where the 4h upper Bollinger Band converges, is the immediate resistance to clear. Bias is cautiously bullish short-term, bolstered by Solana’s dominant 95% share of tokenized equity trading volume and Morgan Stanley’s ETF filing, but a rejection at $84–$85 would put $79–$80 back in play.
XRP (XRP)
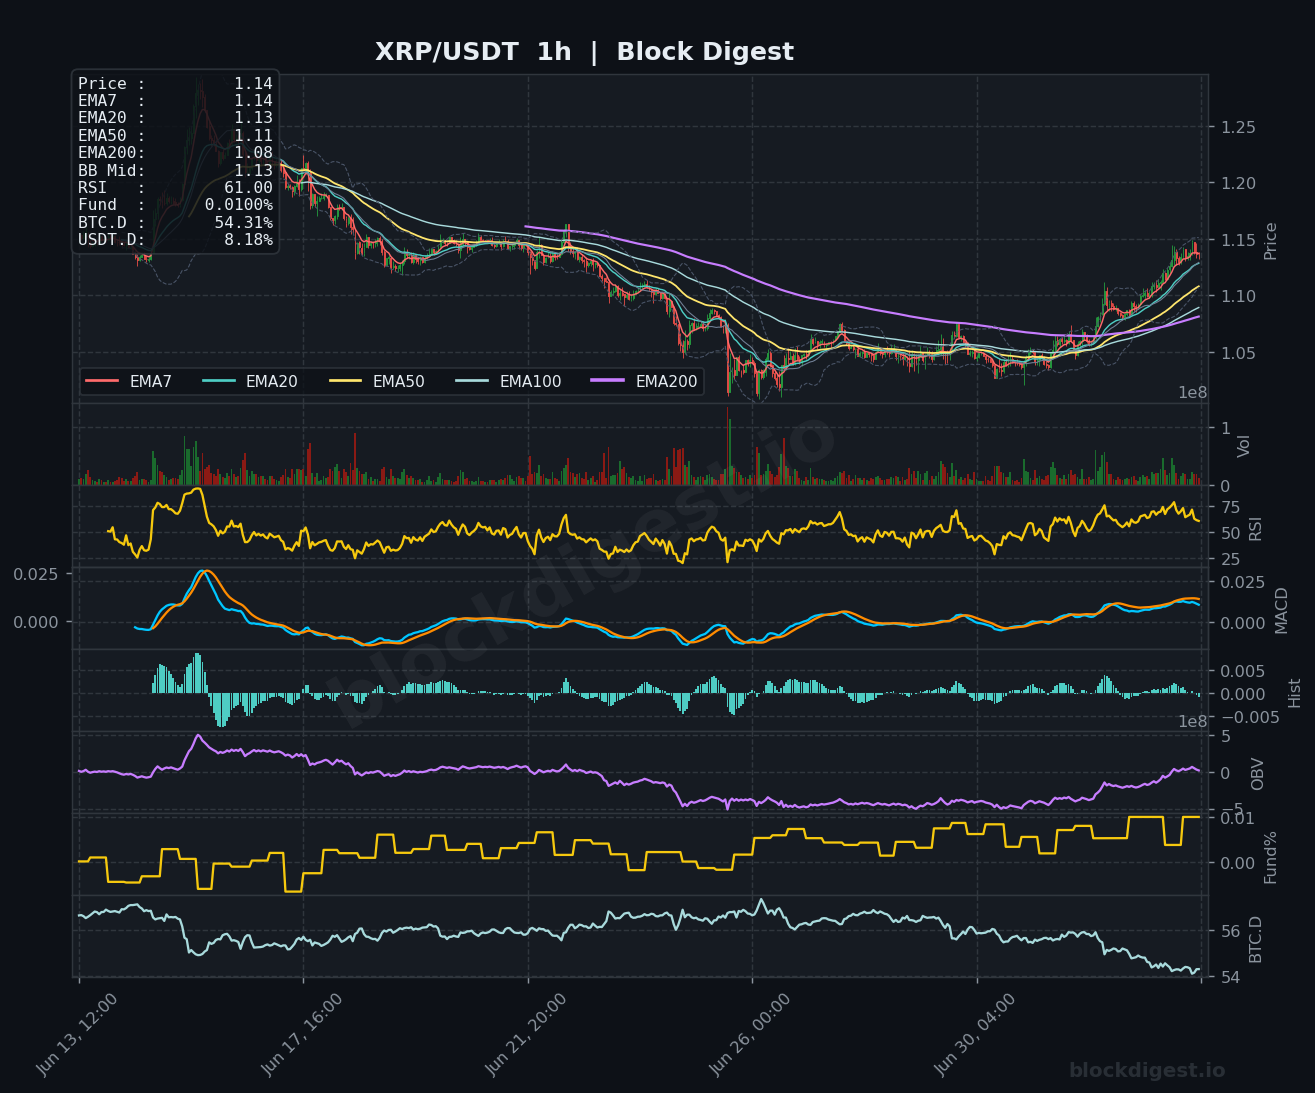
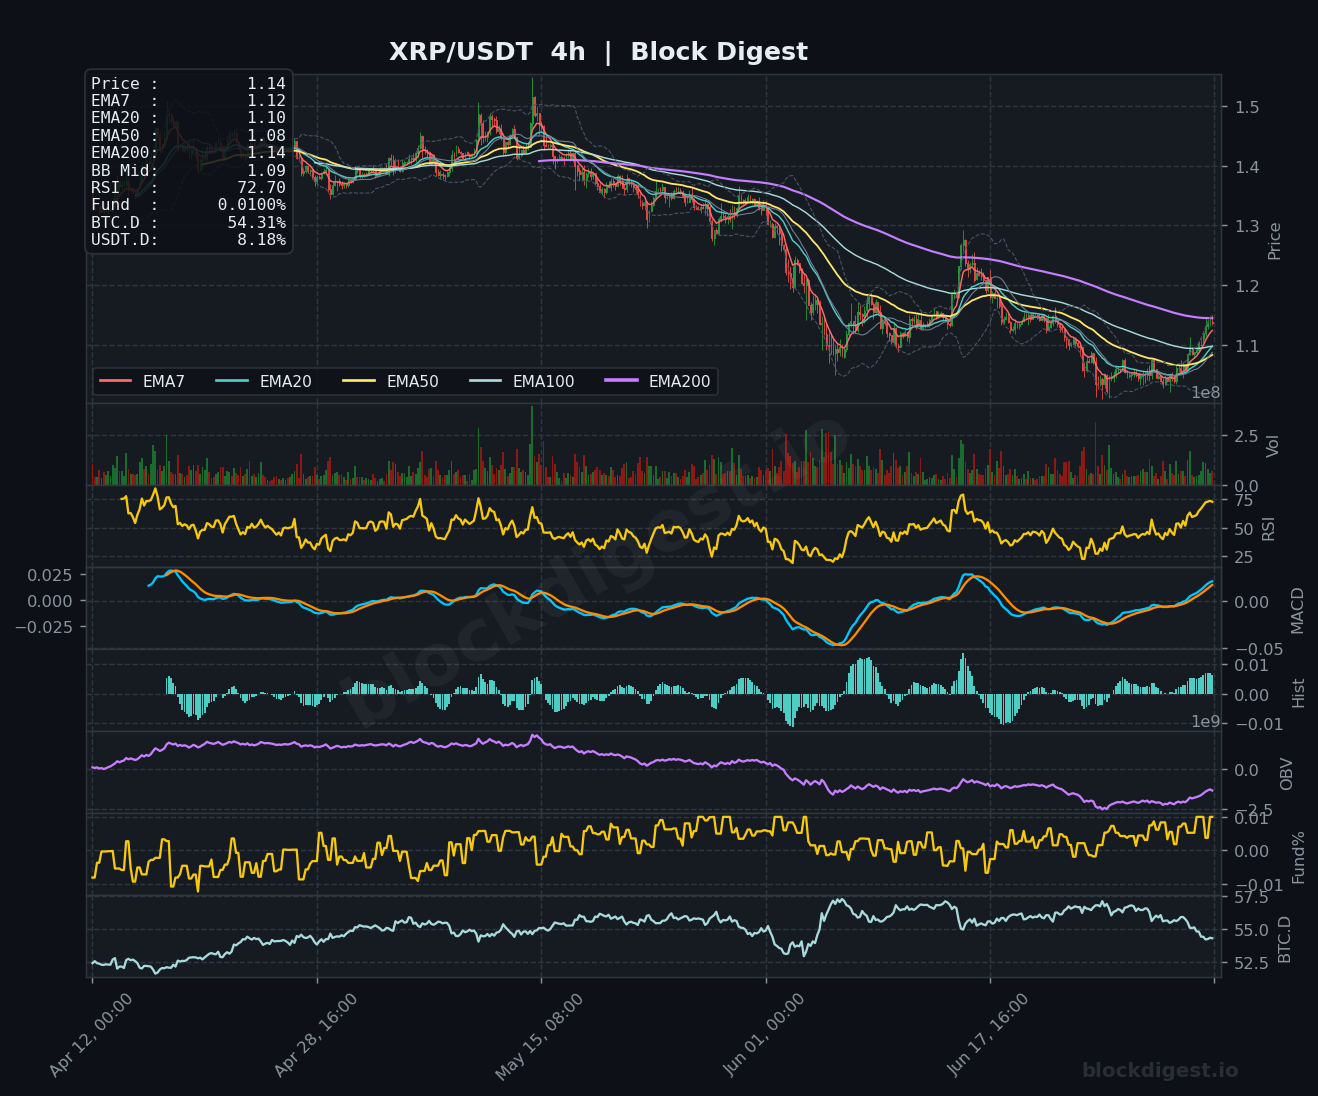
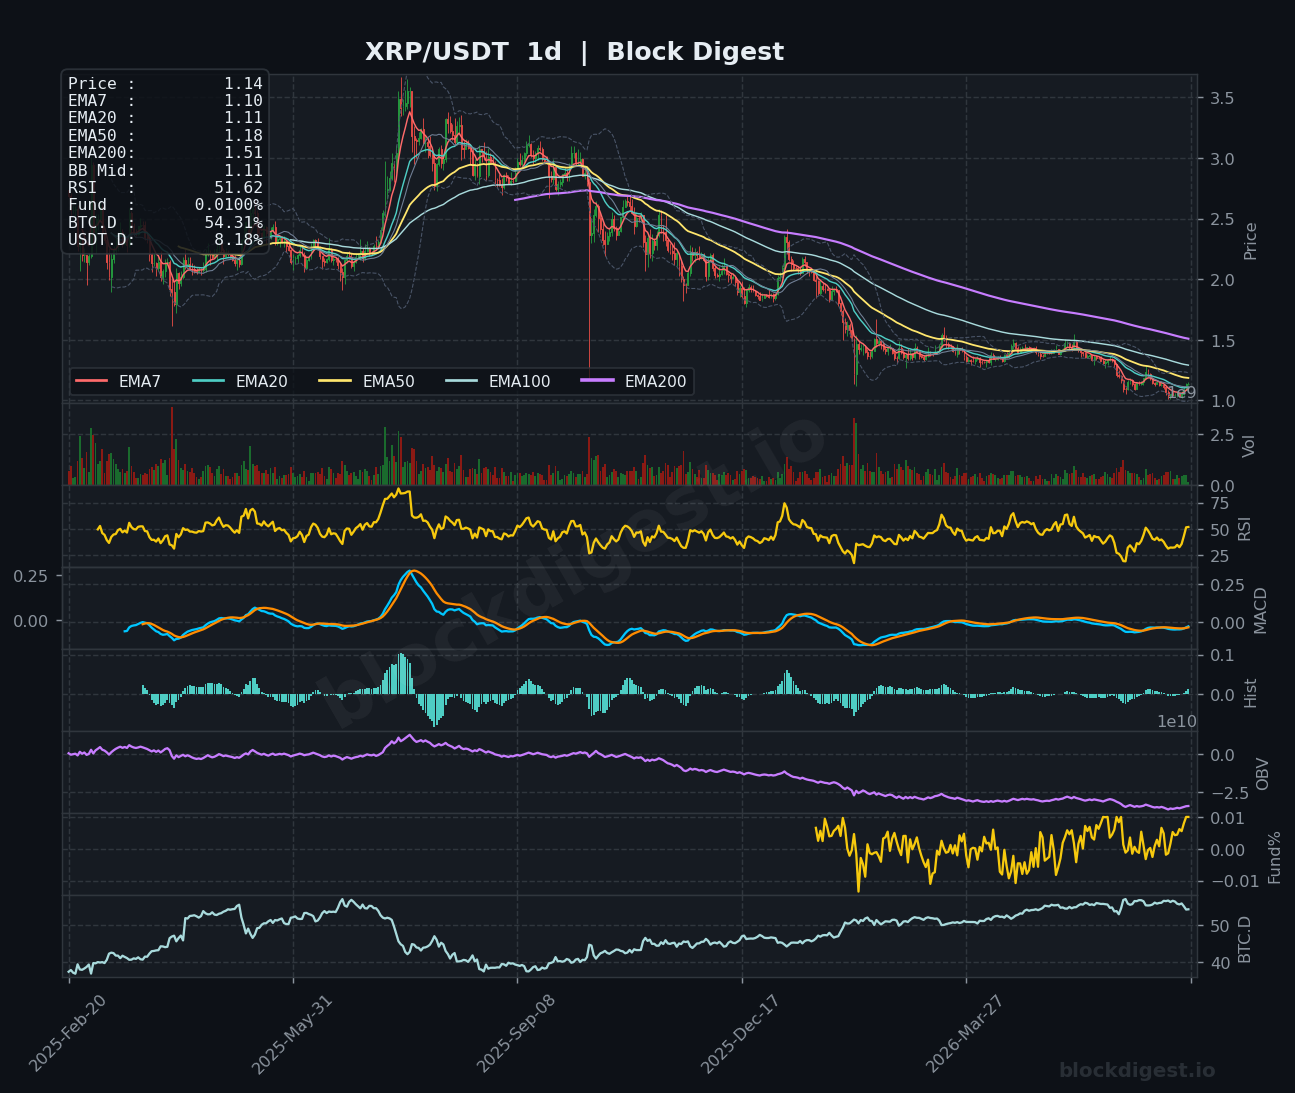
XRP is trading at $1.14, breaking sharply above the EMA200 ($1.08) on the 1h chart and reclaiming the BB midline at $1.13, with all short-term EMAs now stacked bullishly for the first time in weeks. The 4h RSI has surged to 72.70 — the highest overbought reading among all six coins in this review — while the MACD on the 4h is in a clear bullish crossover, though the histogram is showing early signs of momentum compression as the move extends. On the daily chart, RSI sits at a more moderate 51.62 and the daily MACD remains essentially flat, reflecting that this move is still largely a short-term technical and news-driven event rather than a confirmed macro trend reversal; the EMA50 at $1.18 and the daily EMA200 at $1.51 represent formidable overhead resistance. The CLARITY Act catalyst is a genuine fundamental driver, but with the 4h RSI already stretched above 72, short-term traders should watch for a pullback toward $1.08–$1.10 before the next leg higher.
BNB (BNB)
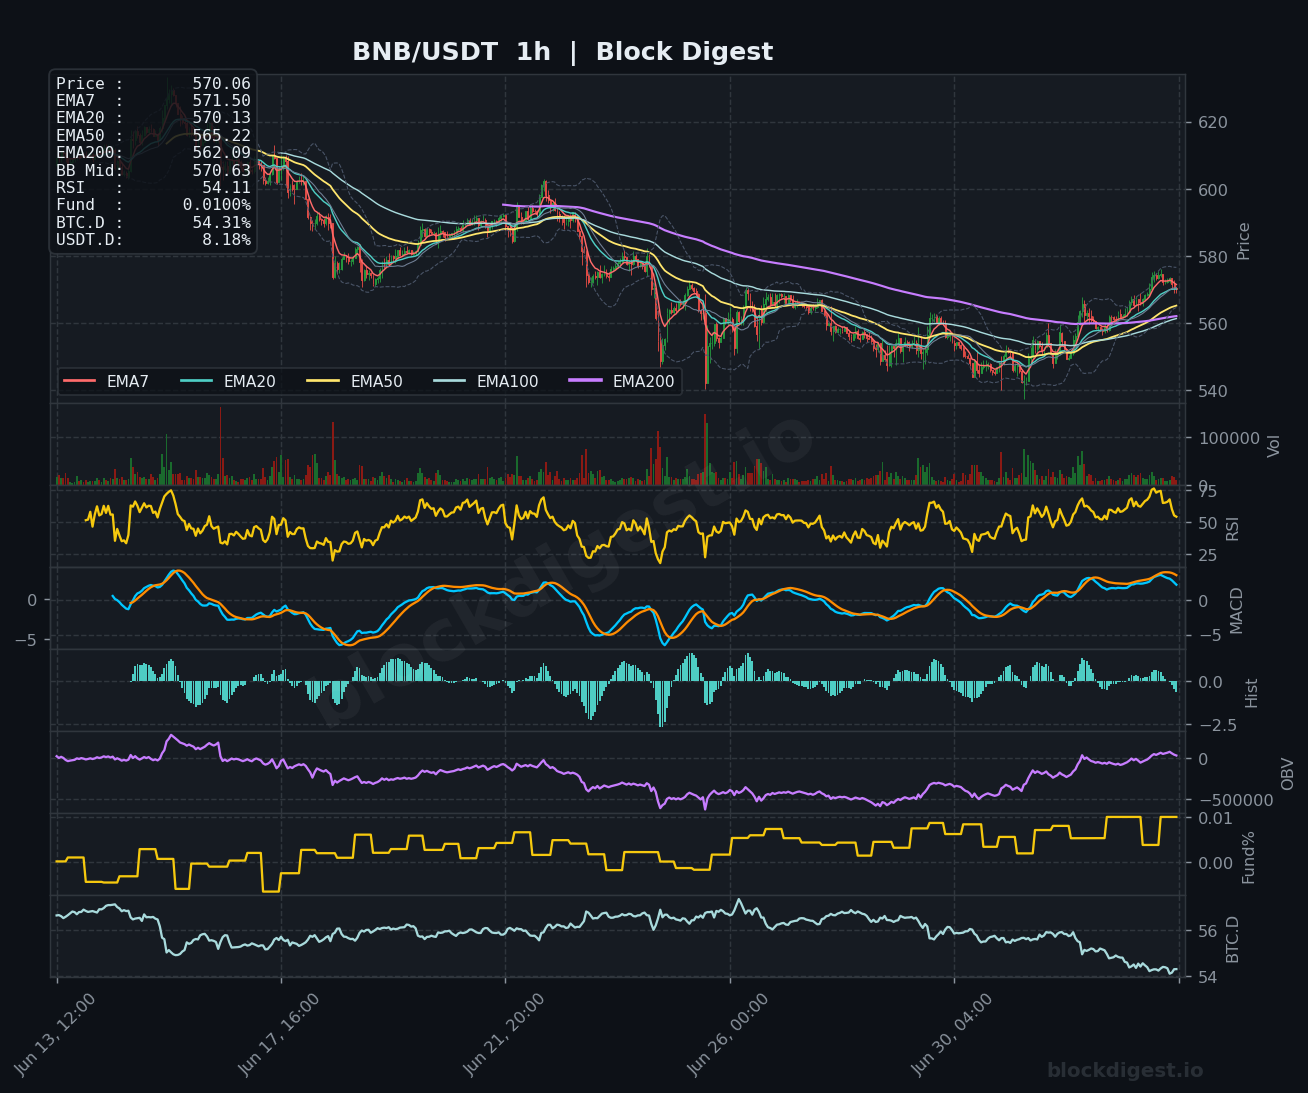
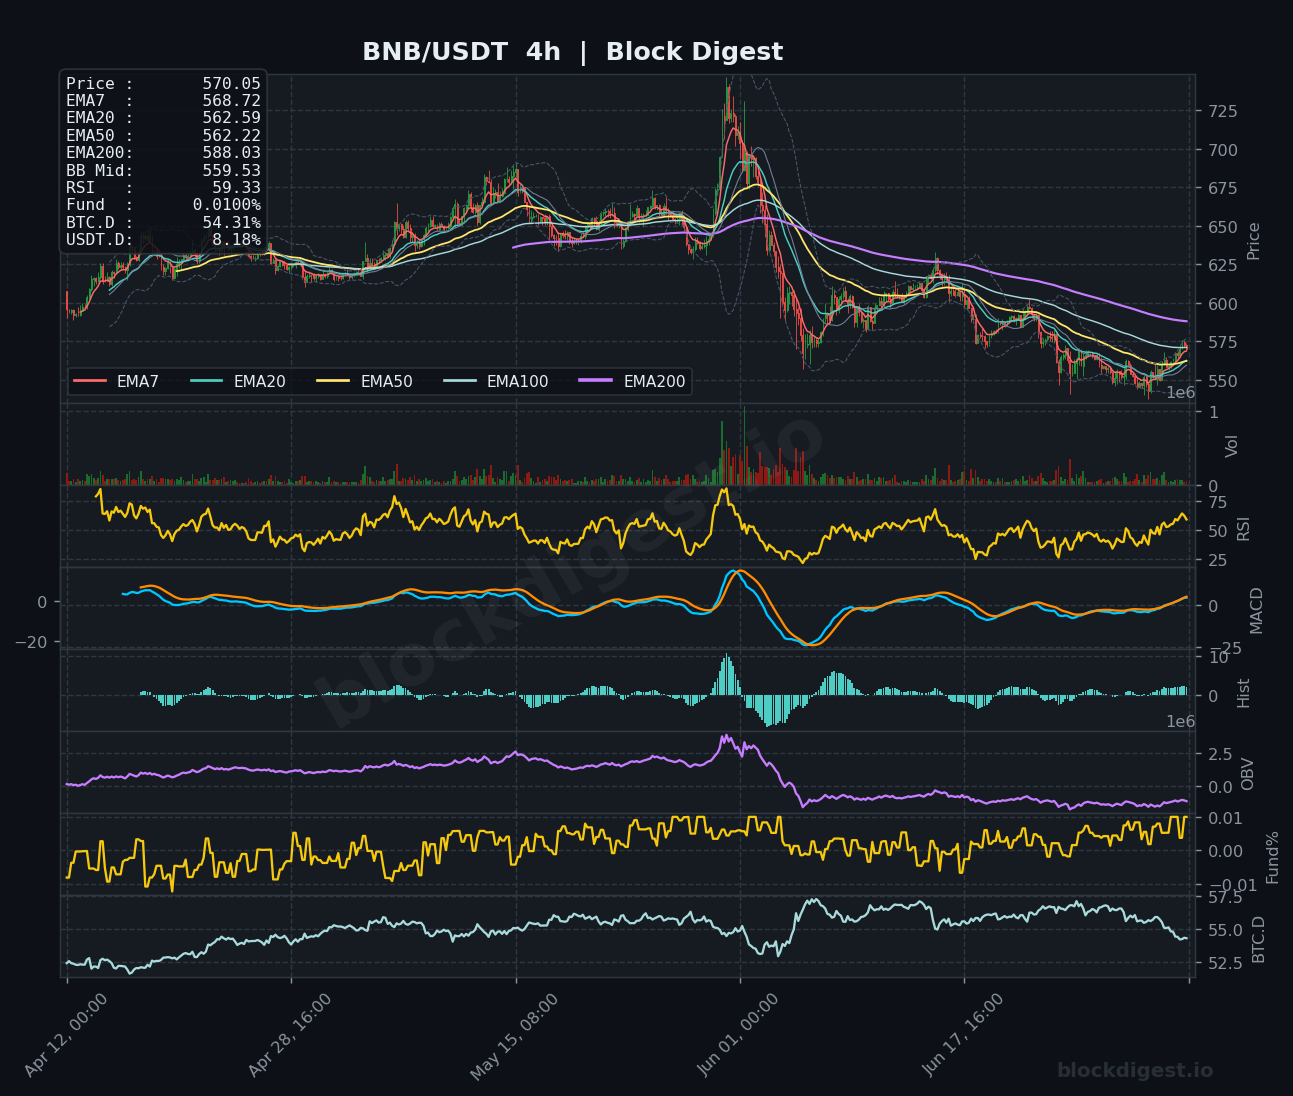
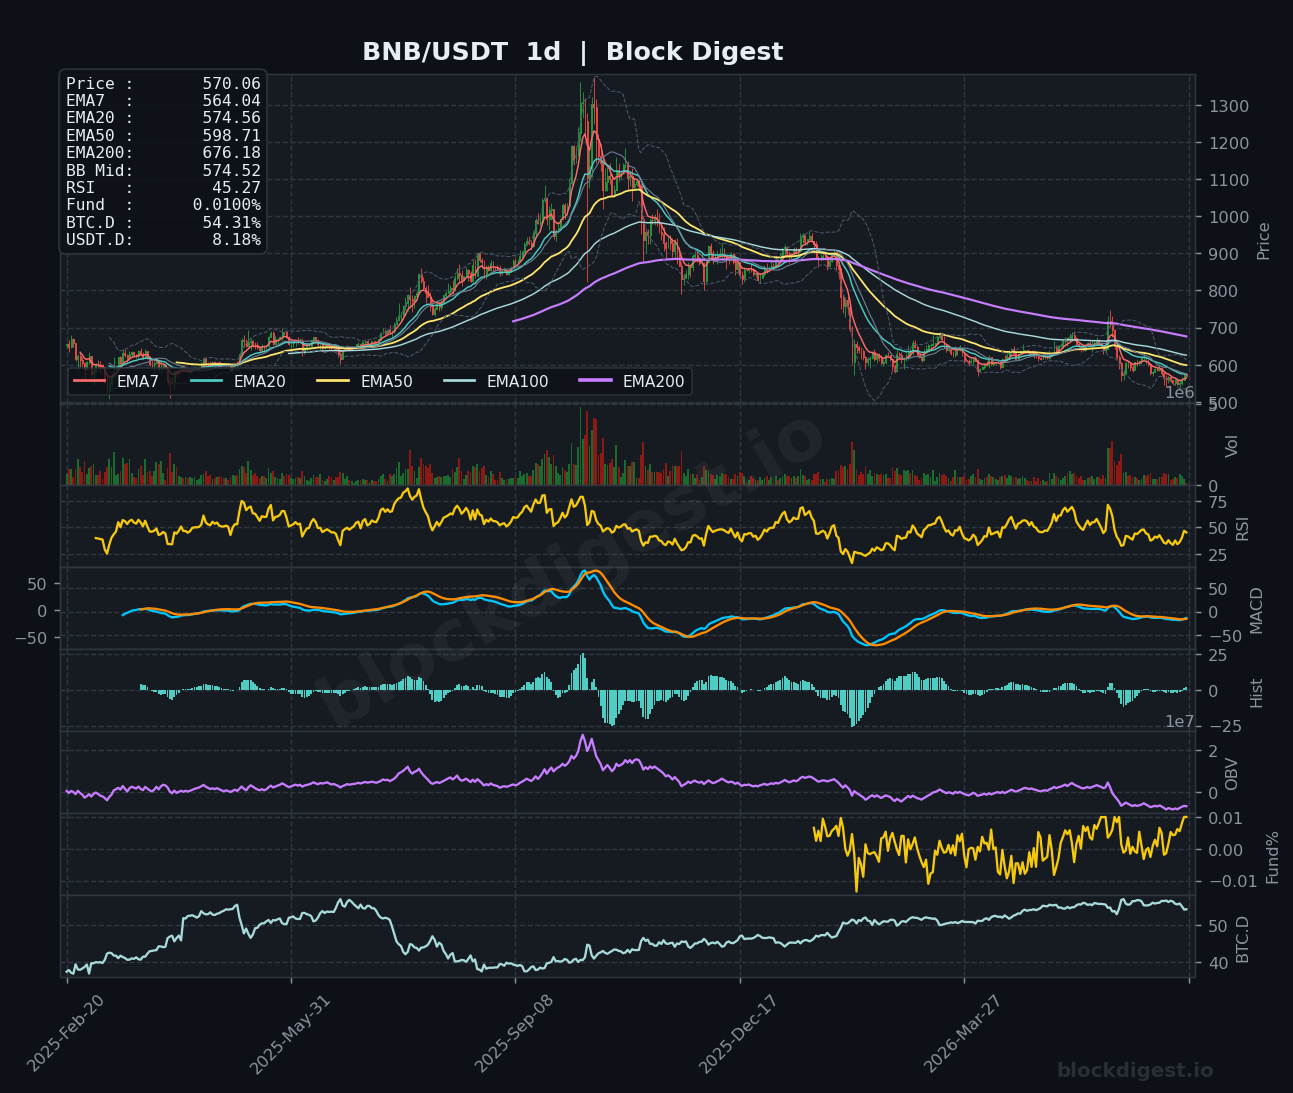
BNB is trading at $570.06, hovering just above the tightly clustered EMA7 ($571.50), EMA20 ($570.13), and EMA50 ($565.22) on the 1h, with the RSI neutral at 54.11, suggesting price is at an inflection point rather than in a trending impulse. The 4h chart tells a more constructive story: the MACD has staged a bullish crossover and RSI is at 59.33, while price has recovered from post-spike lows near $545 and is reconsolidating above the $560–$562 support cluster (4h EMA20 and EMA50). The daily chart remains structurally bearish — price sits well beneath the EMA50 ($598.71), EMA100, and the EMA200 at $676.18 — and daily RSI at 45.27 confirms the broader trend has not turned. The VanEck VBNB ETF launch in late May provides an institutional narrative, and the $560–$562 zone is credible support, but bulls need a clean break above $580–$585 to indicate a genuine recovery is underway.
Dogecoin (DOGE)
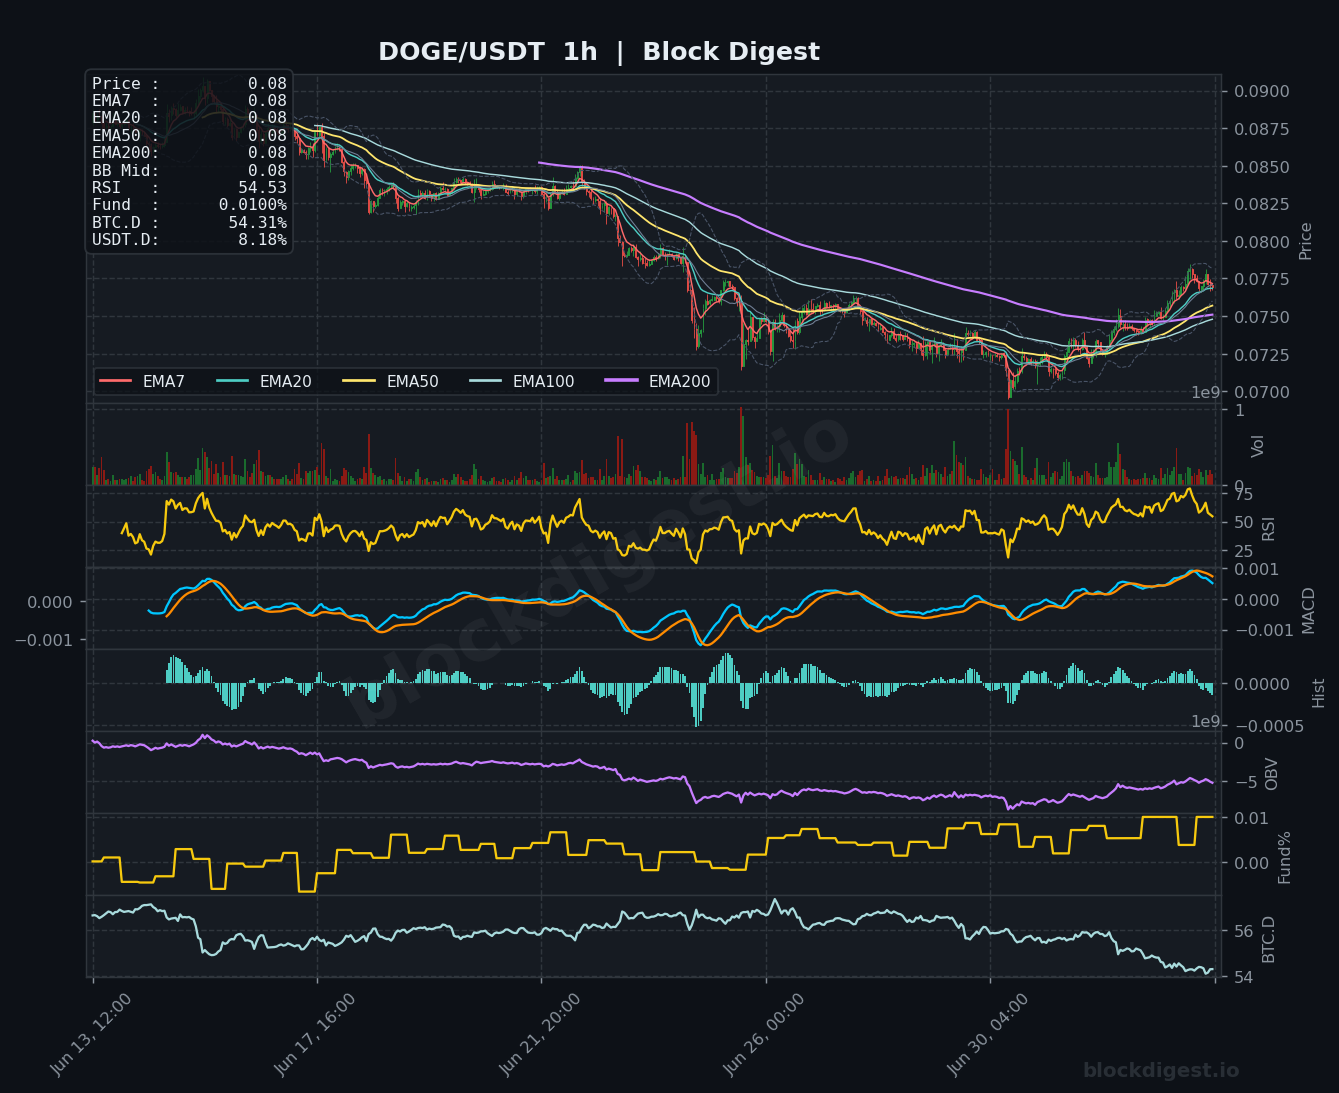
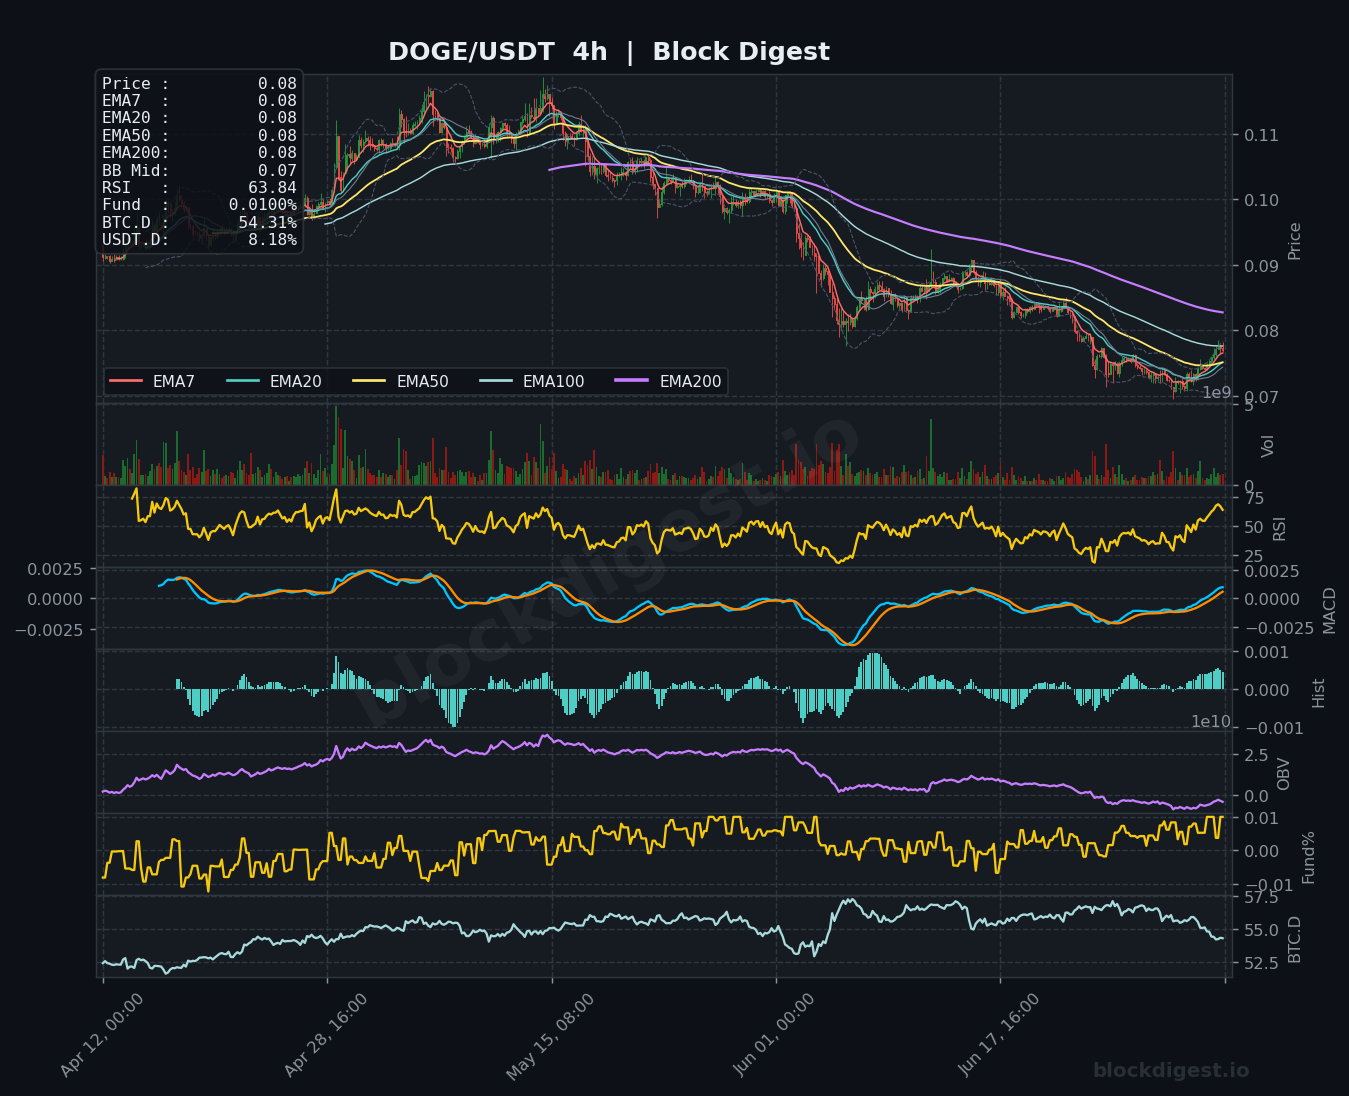
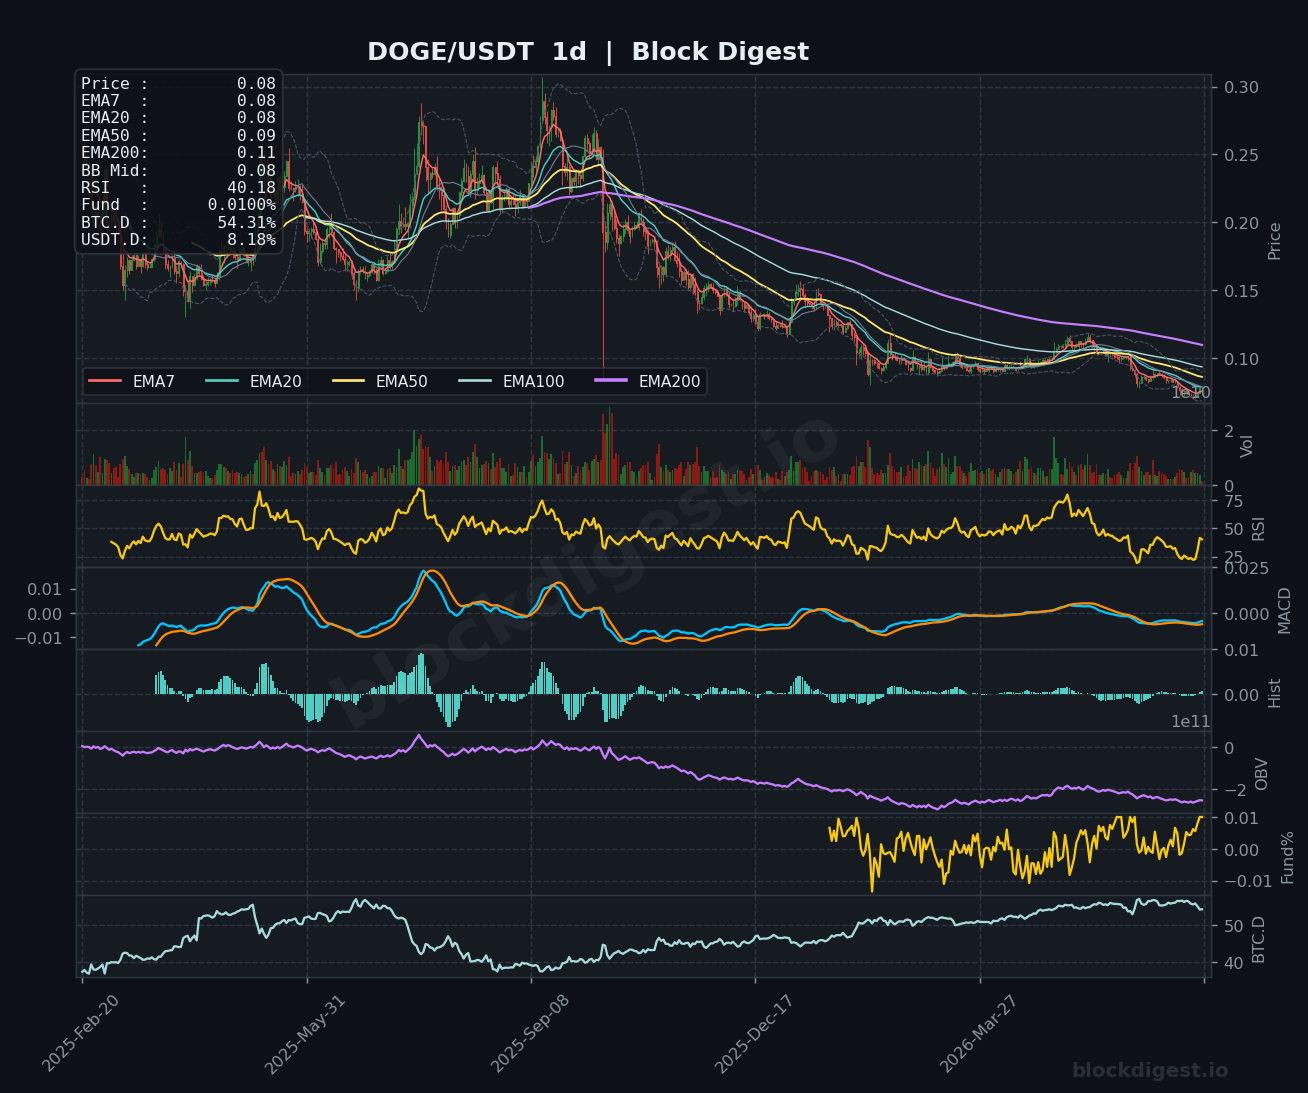
DOGE is trading at $0.0767, recovering from a multi-week slide that brought price from $0.085 to a low near $0.0700 as visible on the 1h chart, with EMAs now beginning to curl upward in a tentative bullish alignment. The 4h RSI at 63.84 shows recovering momentum, and the MACD on the 4h is crossing back into positive territory with growing histogram bars, suggesting the recent bounce has some substance. However, the daily chart paints a sobering picture: RSI is at just 40.18 — approaching oversold — while all major daily EMAs remain in a bearish descending stack, and the OBV continues its prolonged downtrend, indicating sustained distribution rather than accumulation. DOGE needs to reclaim and hold above $0.0800 to shift the near-term narrative; failure to do so risks a retest of the $0.0700 area, while the regulatory tailwind from the CLARITY Act may provide only a temporary floor.
Litecoin (LTC)
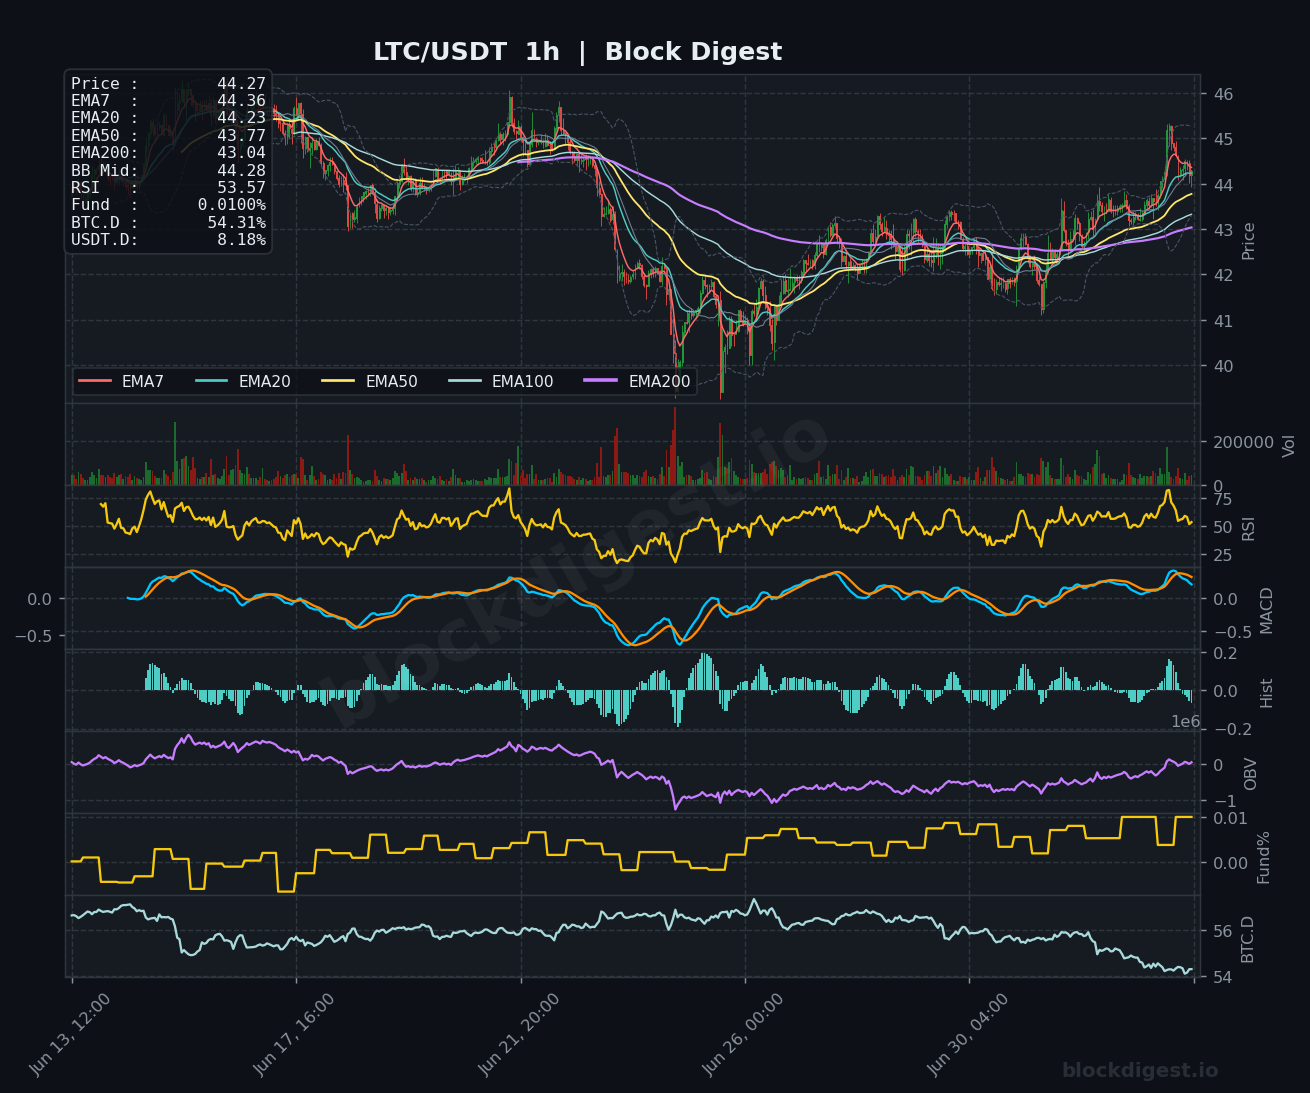
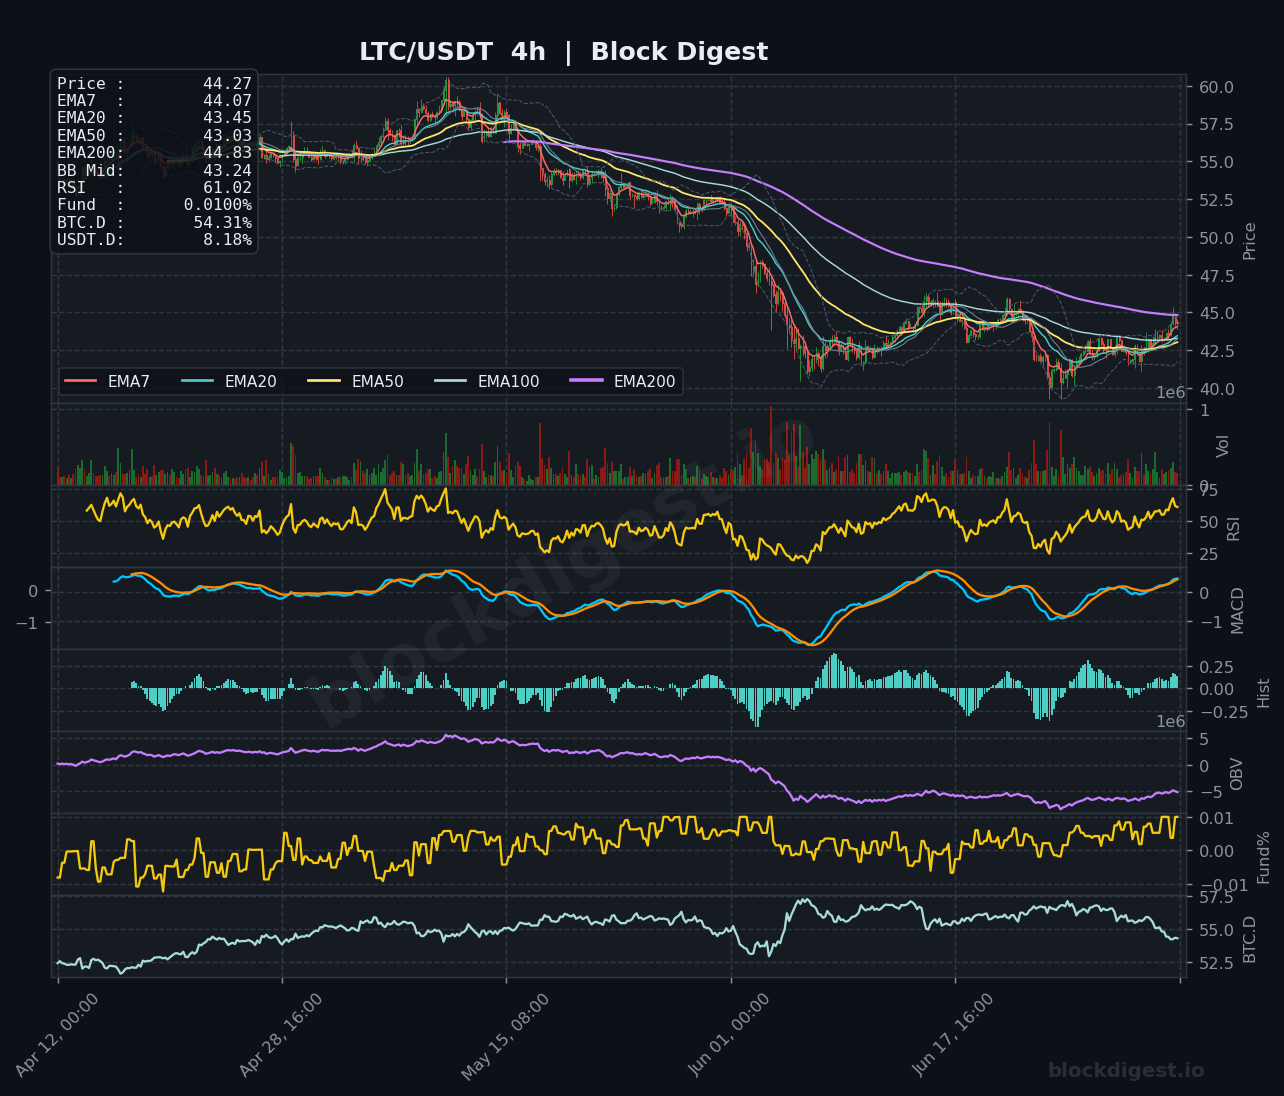
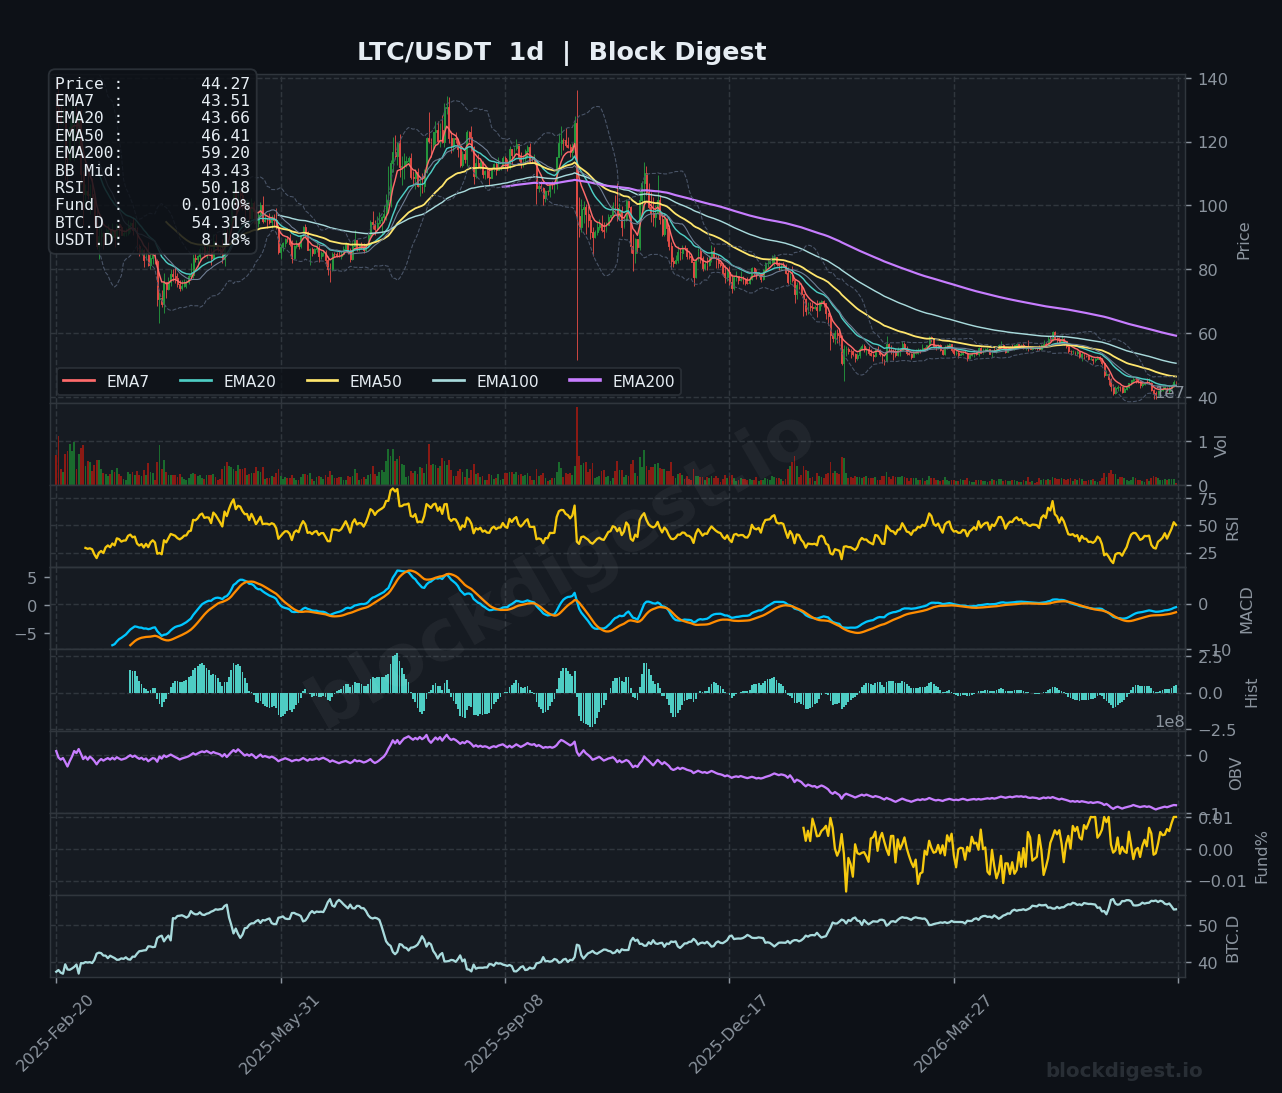
LTC is trading at $44.27, posting one of the stronger near-term recoveries in this cohort after bouncing from a low near $40.50 on the 4h chart, with the 1h EMA stack now bullishly aligned and price pushing toward the upper Bollinger Band around $45–$46. The 4h RSI at 61.02 is healthy without being overbought, and the MACD on the 4h has completed a bullish crossover with the histogram in positive expansion — a constructive setup for continuation. That said, the daily chart remains firmly bearish: LTC is trading below the EMA50 ($46.41), EMA100, and EMA200 ($59.20) in a classic bear market alignment, and daily RSI at 50.18 is pinned at the neutral line with no clear directional conviction. Immediate resistance sits at $45.50–$46.50 (the 4h Bollinger Band upper and daily EMA50), and a failure to clear this zone would suggest the broader downtrend remains intact.
TRON (TRX)
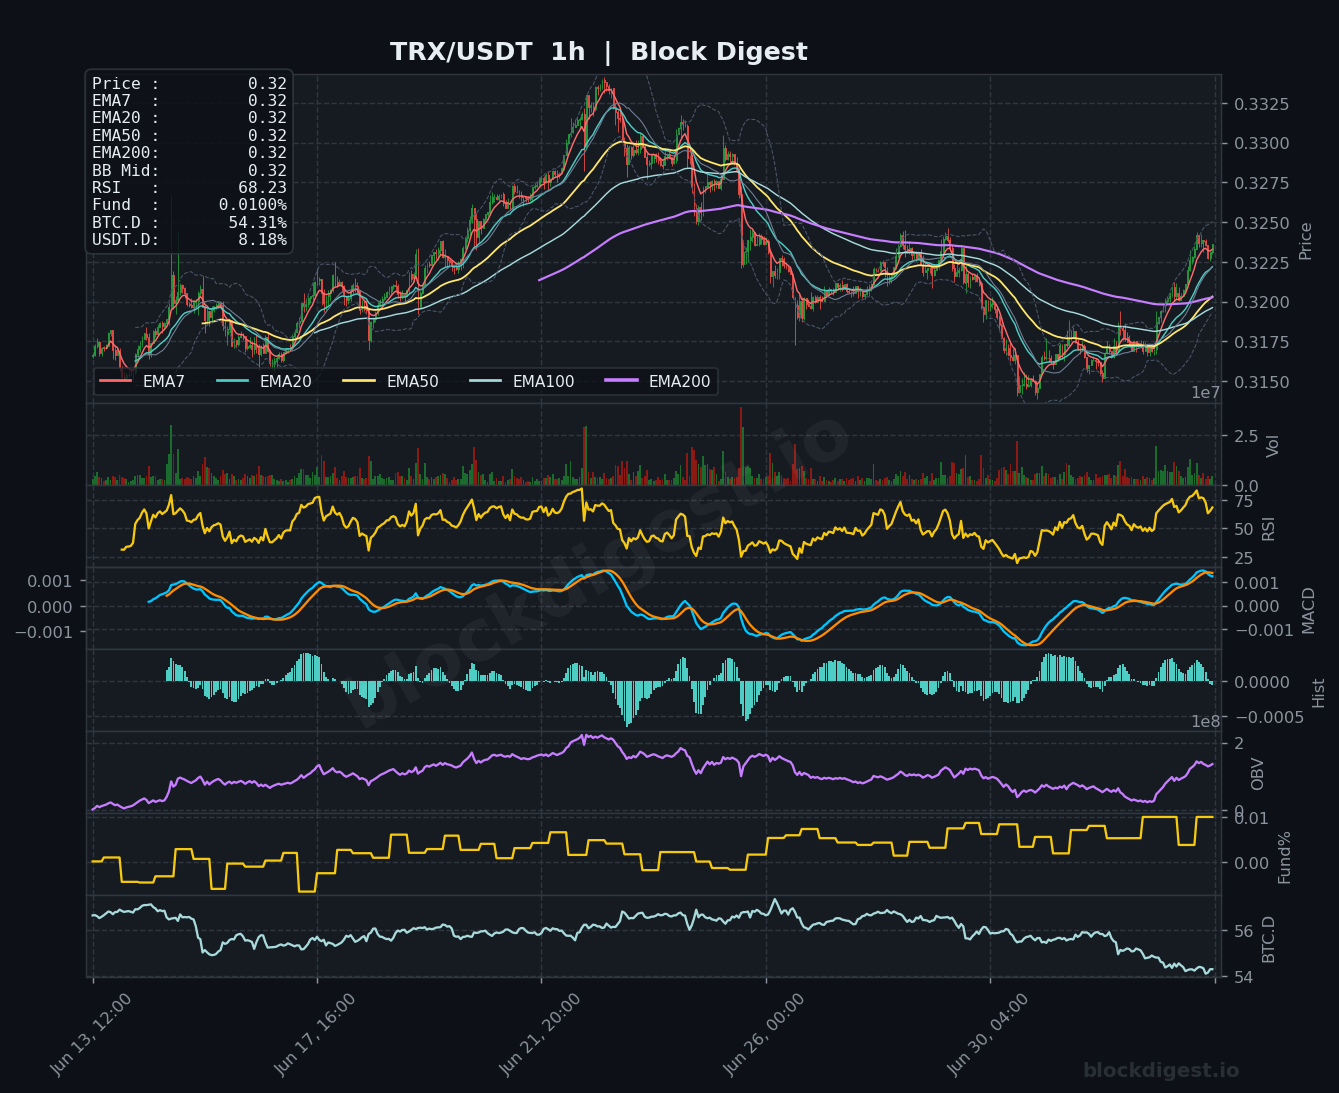
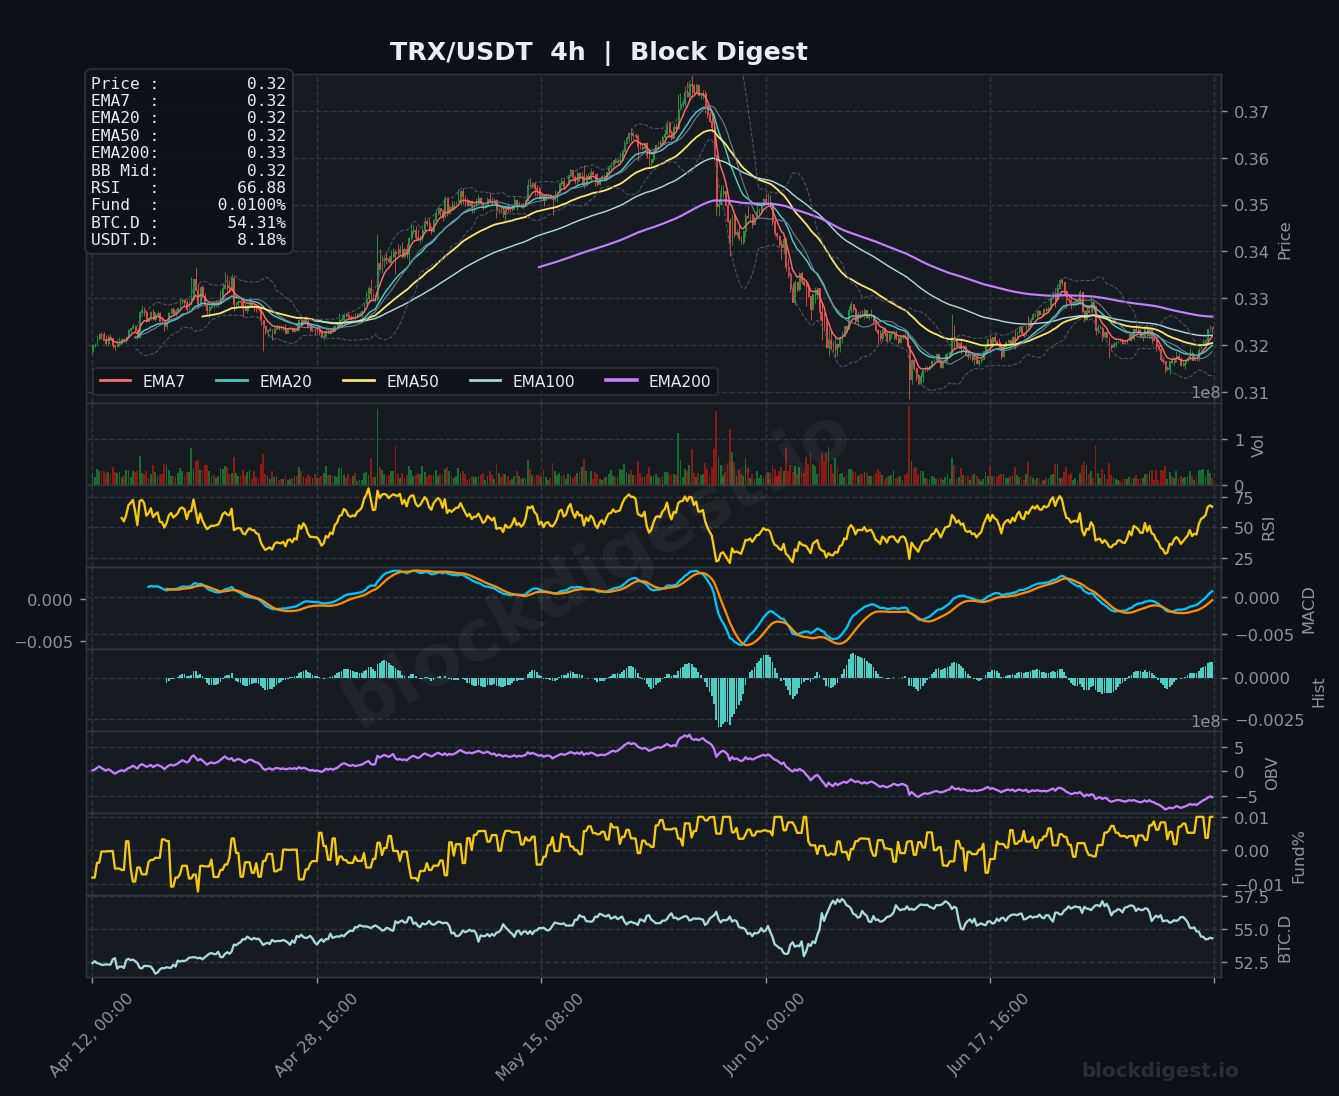
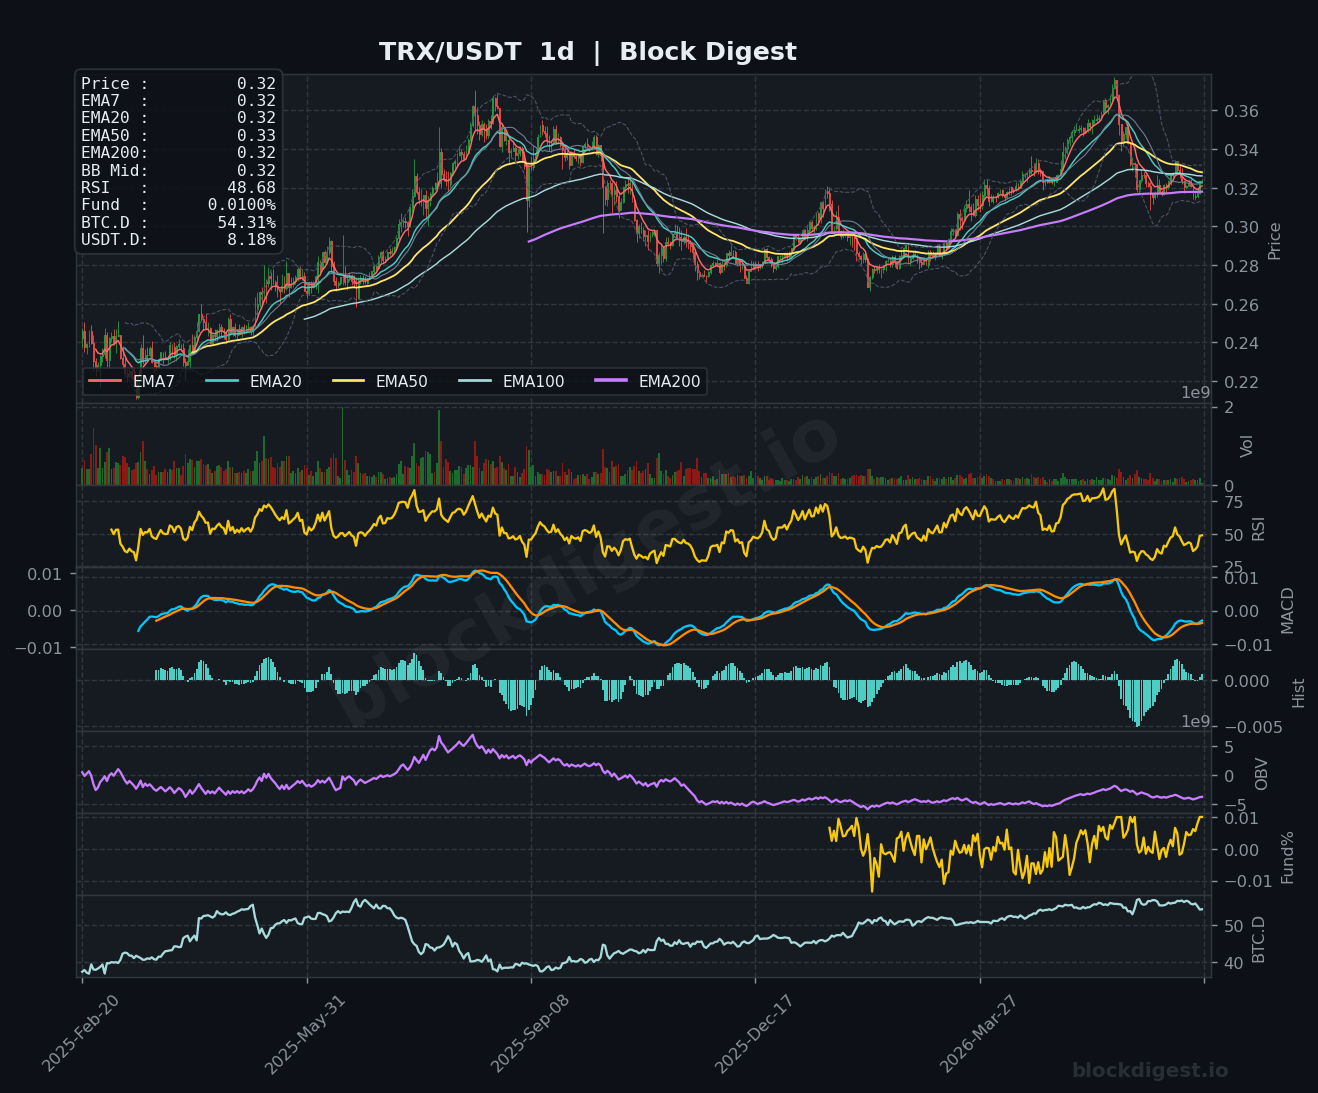
TRX is trading at $0.3225, showing the most relative strength on the daily chart among this group: daily EMA7 ($0.32) and EMA200 ($0.32) are tightly compressed, indicating price has held key structural support better than its peers through the recent market weakness. The 1h RSI at 68.23 and the 4h RSI at 66.88 are both in the upper range without yet being overbought, while the MACD on both timeframes shows a clean bullish crossover with positive and expanding histograms — momentum is clearly building to the upside. On the daily, RSI sits at 48.68 and the MACD signal lines are beginning to converge after a bearish period, with the EMA50 at $0.33 acting as the immediate overhead test; OBV on the daily has stabilized after months of decline. TRX remains the most technically intact of the six coins reviewed today, with the $0.315 level as key near-term support and $0.33–$0.335 as the critical resistance level to reclaim.
Altcoin Outlook
The overall altcoin setup as of July 4, 2026 is one of selective short-term recovery within a structurally challenged macro environment: the majority of coins reviewed are bouncing on news catalysts and short-term momentum but remain well beneath their key daily EMAs, with broken OBV trends and persistent ETF outflows limiting sustained upside. TRX presents the strongest technical setup with the most contained drawdown, healthiest RSI readings across timeframes, and building MACD momentum, while XRP offers the sharpest news-driven catalyst though its 4h RSI is already stretched at 72.70, making timing any new entry difficult. DOGE and LTC show the weakest daily structures, with DOGE’s daily RSI hovering near oversold and LTC unable to reclaim major moving averages. The key conditions to watch across the altcoin space are whether BTC dominance continues its near-term pullback below 54%, whether
Disclaimer: This analysis is for informational purposes only and does not constitute financial advice. Cryptocurrency markets are highly volatile and unpredictable. All trading decisions should be made based on your own research and risk tolerance. Block Digest is not responsible for any financial losses incurred as a result of acting on this content.
Stay Ahead of the Market
Follow BlockDigest for crypto market intelligence, research and real-time updates.


