
trading
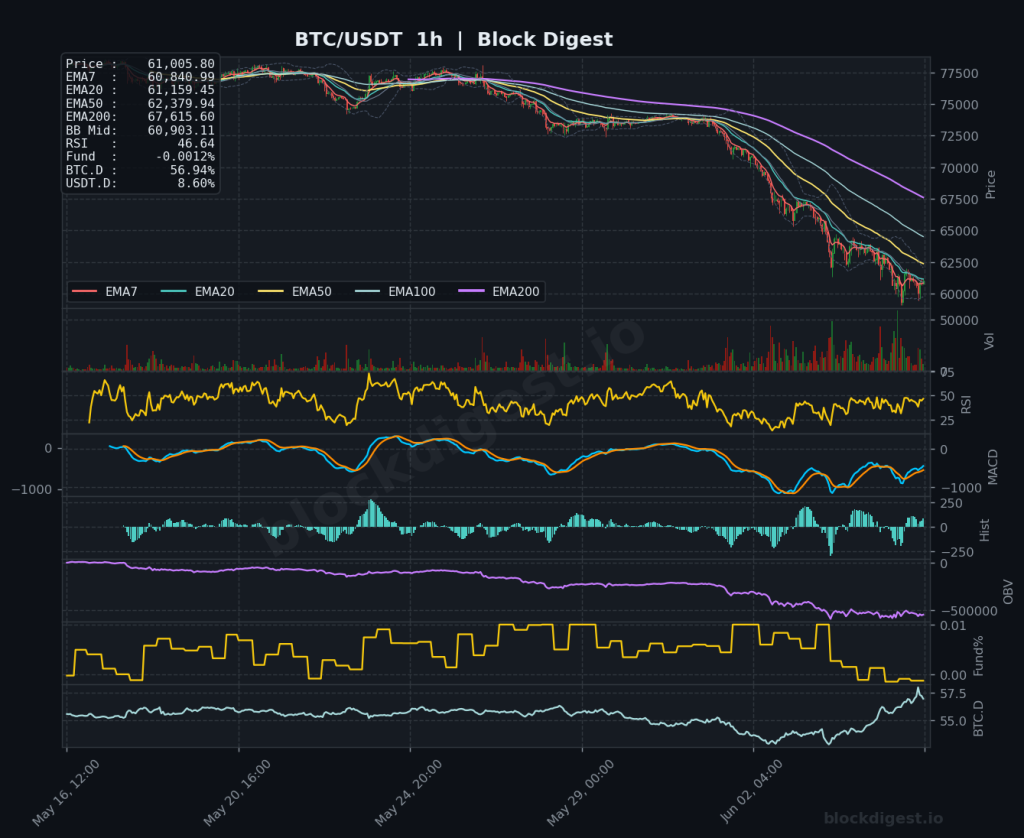
Bitcoin Daily Analysis: Bitcoin at $61K, Below All Major EMAs
Market Overview Bitcoin is trading at approximately $61,005 after suffering a sharp multi-week decline from its recent highs above $73,000, representing a loss of roughly 16% over the past week alone — well off its all-time high of $126,210 set last October. On the daily timeframe, price is trading significantly below all major EMAs: the...
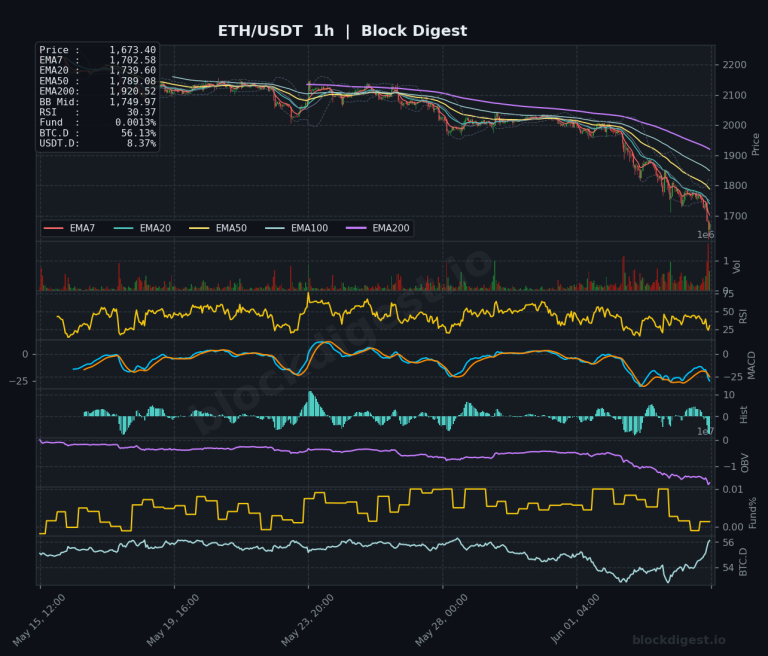
Ethereum Daily Analysis: ETH Plunges Below All Major EMAs at $1,673
Market Overview ETH/USDT is trading at $1,673.76, deep in bearish territory and printing multi-month lows as sellers maintain full control across all timeframes. Price is trading well below every major EMA on the daily chart — the EMA7 at $1,843.04, EMA20 at $1,991.49, EMA50 at $2,113.49, and the EMA200 at $2,466.58 — confirming a sustained...
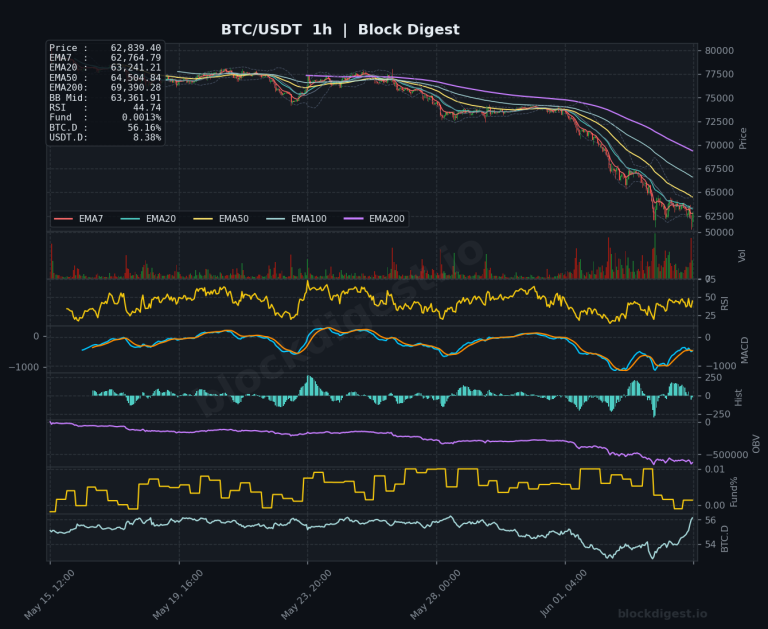
Bitcoin Daily Analysis: Bearish EMA Stack Confirmed Below $62,835
Market Overview Bitcoin is trading at approximately $62,835 as of June 5, 2026, deep in bearish territory following a sharp multi-week selloff that erased gains accumulated since early 2026. Price is trading well below all major EMAs on the daily timeframe — the EMA7 at $67,055, EMA20 at $71,897, EMA50 at $74,271, and the EMA200...
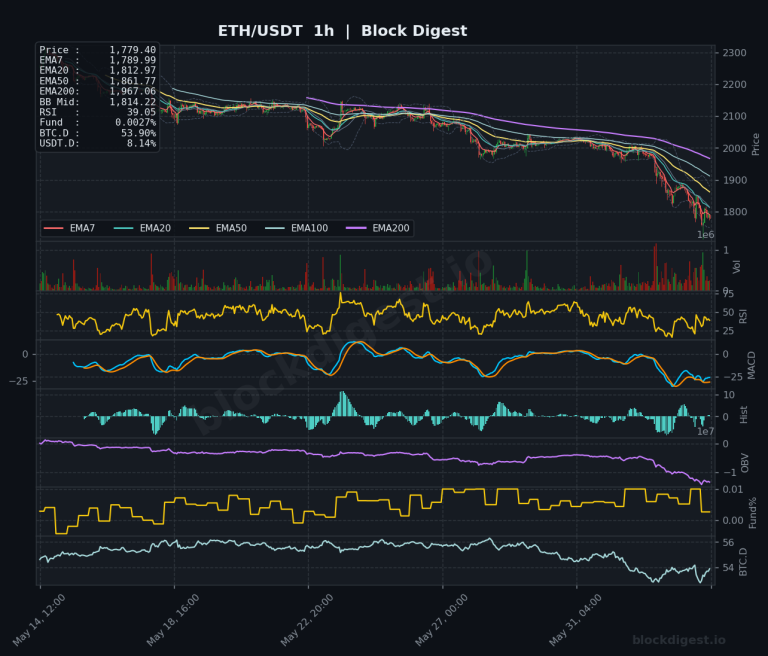
Ethereum Daily Analysis: Ethereum Drops 12% Below EMA7 at $1,778
Market Overview Ethereum is trading at approximately $1,778–$1,779 as of June 4, 2026, extending a sharp multi-week decline that has pushed price well below all key daily EMAs. The daily chart paints a distinctly bearish macro picture: ETH sits approximately 12% below the EMA7 ($1,901.66), 14% below the EMA20 ($2,025.77), and an alarming 28% below...
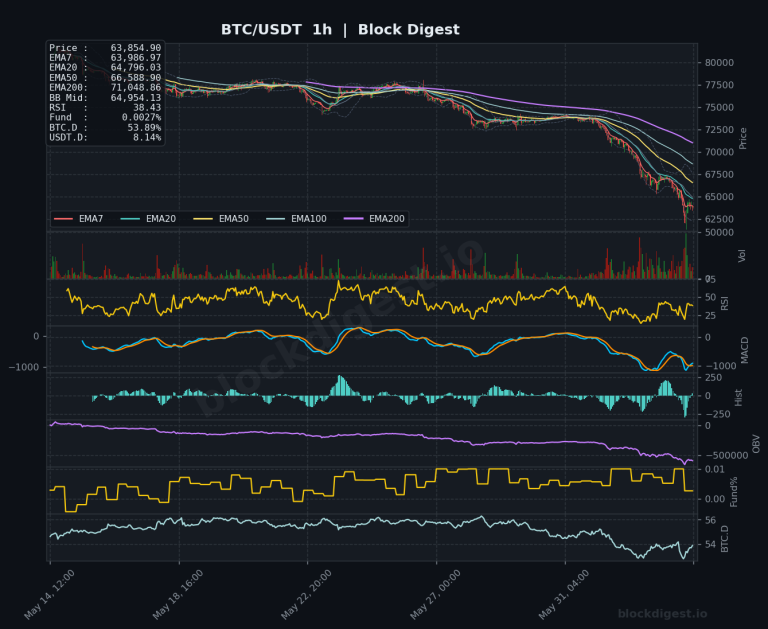
Bitcoin Daily Analysis: BTC at $63.8K, Below All Major EMAs
Market Overview Bitcoin is trading at approximately $63,835–$63,855 across timeframes, having suffered a sharp multi-week decline from highs near $82,000. Price is currently trading well below all major EMAs on every timeframe — a textbook bearish alignment. On the daily chart, BTC sits beneath the EMA7 ($68,457), EMA20 ($72,849), EMA50 ($74,737), and EMA200 ($80,640), with...

Ethereum Daily Analysis: ETH Falls Below Key EMAs at $1,878
Market Overview ETH/USDT is trading at $1,878.84–$1,878.95 as of June 3, 2026, extending a sharp multi-week decline that has pushed price well below all major exponential moving averages on every timeframe. On the daily chart, ETH sits beneath the EMA7 ($1,959.26), EMA20 ($2,058.10), EMA50 ($2,148.80), and the EMA200 ($2,482.58), confirming a deeply bearish macro structure....
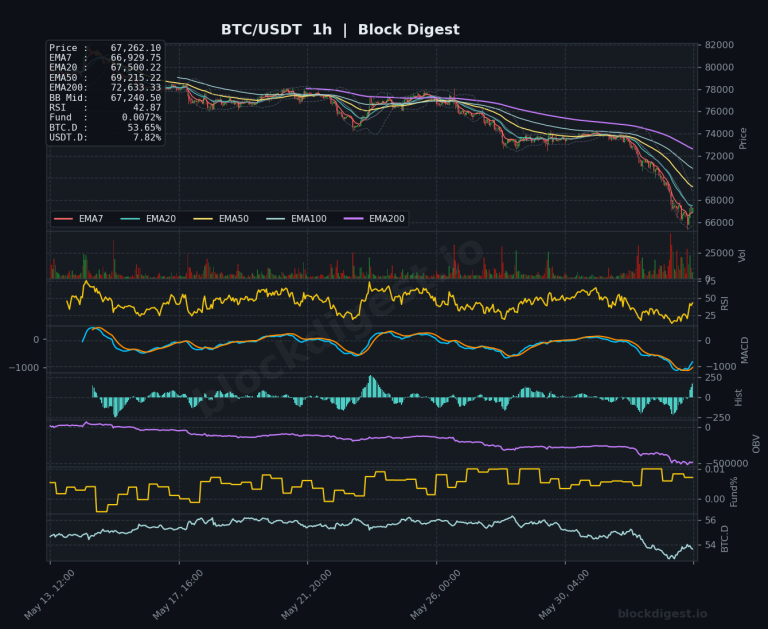
Bitcoin Daily Analysis: Bitcoin Breaks Below Key EMAs at $67,262
Market Overview Bitcoin is trading at approximately $67,262 as of June 3, 2026, down roughly 7% over the past 24 hours and sitting well below all key exponential moving averages across the daily timeframe. On the 1D chart, price has broken decisively beneath the EMA7 ($70,785), EMA20 ($74,098), EMA50 ($75,305), and EMA200 ($80,814), confirming a...
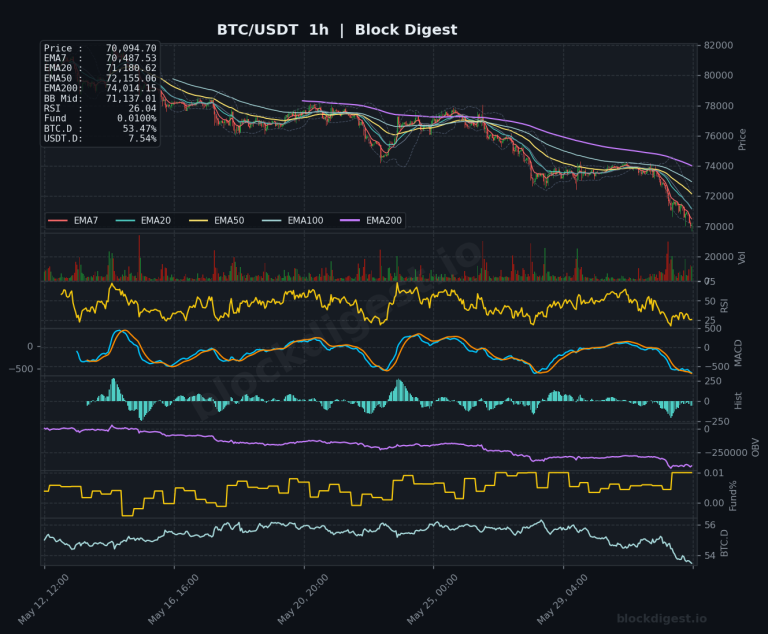
Bitcoin Daily Analysis: Support at $70K as EMAs Break Bearish
Market Overview Bitcoin is trading at approximately $70,094–$70,102, pressing against a critical psychological support zone as sellers maintain firm control of price action. On the daily timeframe, BTC has broken decisively below all major EMAs — with the EMA7 at $72,801, EMA20 at $75,138, EMA50 at $75,766, and the EMA200 sitting far above at $80,978...
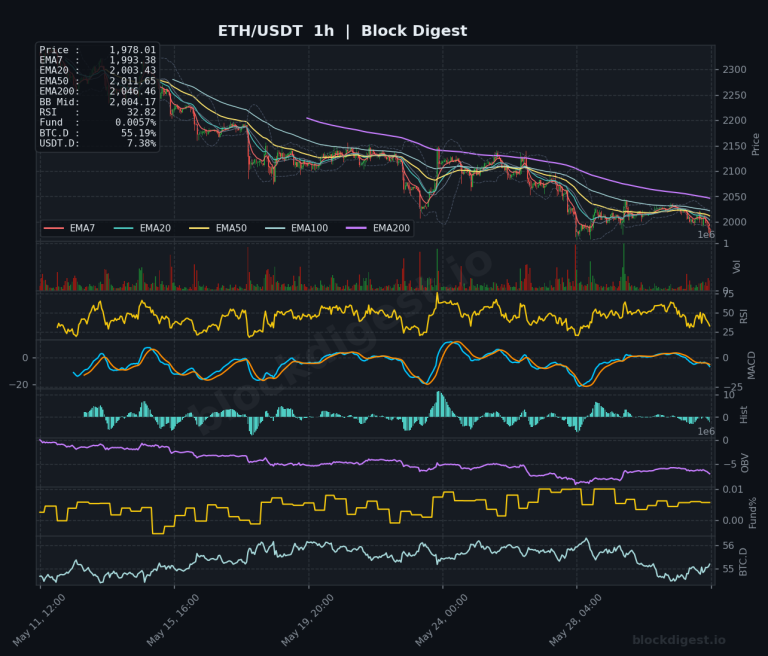
Ethereum Daily Analysis: ETH Tests $2,000 Level Below EMA Stack
Market Overview ETH/USDT is trading at $1,977.80–$1,978.01, sitting firmly below all major EMAs across every timeframe — a structurally bearish configuration. On the daily chart, price has been in a pronounced downtrend since the highs above $4,000, and is currently testing the psychologically significant $2,000 level from below, with the Bollinger Band midline at $2,104.56...
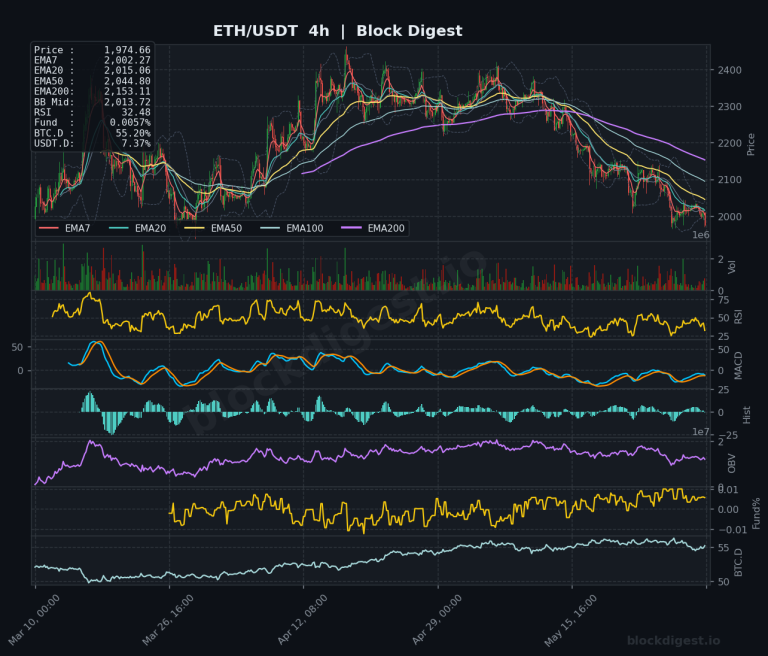
Ethereum Weekly Analysis: Ethereum Breaks Below $2,000 Resistance Level
Weekly Market Overview Ethereum closed the week trading just below the psychologically critical $2,000 level, with price printing at approximately $1,975 on the weekly chart — a level that has served as a pivotal macro reference point across multiple market cycles. The weekly candle reflects continued distribution pressure, extending a downtrend that began following the...
Bitcoin Weekly Analysis: Bitcoin Tests Critical Zone Below $75K
Weekly Market Overview Bitcoin enters the first week of June 2026 in a notably vulnerable technical position, with price trading at approximately $72,783 — well below the key psychological $75,000 level and sitting beneath all major short-term EMAs on the weekly chart. The weekly candle structure reflects continued distribution pressure following a prolonged decline from...
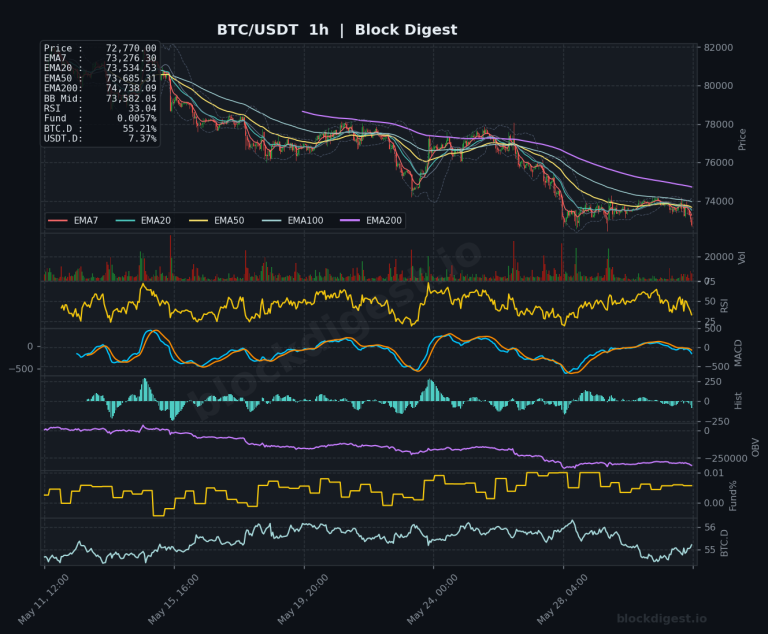
Bitcoin Daily Analysis: Bitcoin Below All EMAs at $72,770
Market Overview Bitcoin is currently trading at approximately $72,770, sitting beneath every major EMA across all timeframes — a structurally bearish configuration that has persisted for several weeks. On the daily chart, price is printing below the EMA7 ($74,045), EMA20 ($75,800), EMA50 ($76,051), and the EMA200 ($81,123), confirming a well-established downtrend from the October 2025...