Bitcoin Daily Analysis: Bitcoin Breaks Below Key EMAs at $67,262
Market Overview
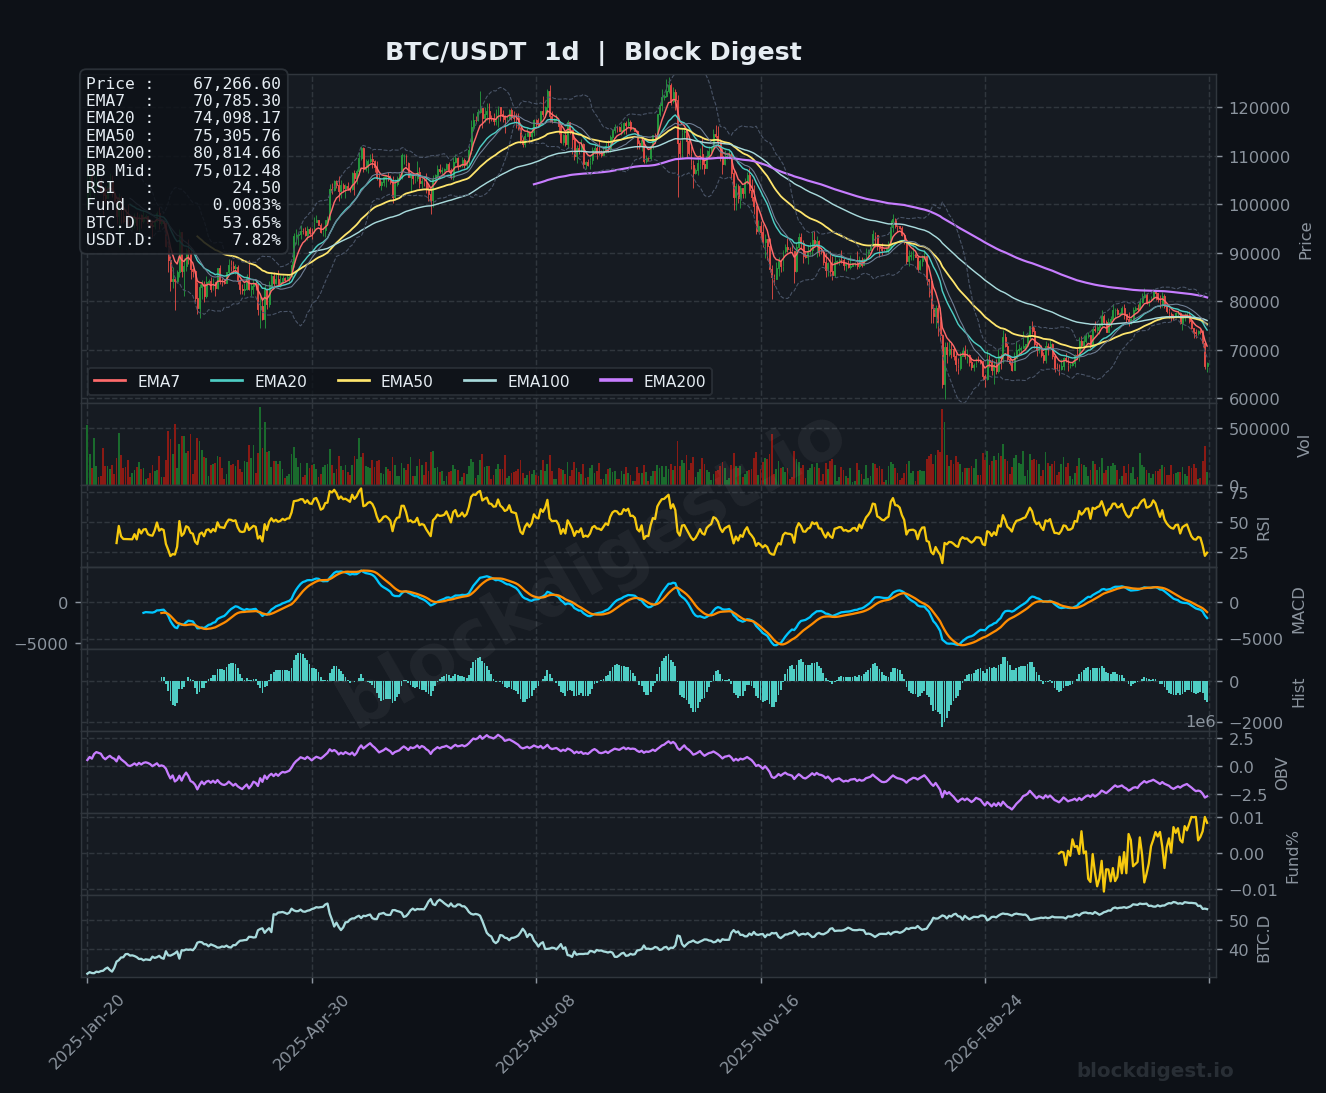
Bitcoin is trading at approximately $67,262 as of June 3, 2026, down roughly 7% over the past 24 hours and sitting well below all key exponential moving averages across the daily timeframe. On the 1D chart, price has broken decisively beneath the EMA7 ($70,785), EMA20 ($74,098), EMA50 ($75,305), and EMA200 ($80,814), confirming a bearish structure not seen since the mid-2025 correction phase. The Bollinger Band midline on the daily sits at $75,012 — nearly $8,000 above current price — indicating price is pressing hard into the lower band and the trend is firmly downward. This sell-off represents a roughly 47% drawdown from the October 2025 all-time high of $126,210, a magnitude that warrants close attention to macro support zones.
Multi-Timeframe Confluence
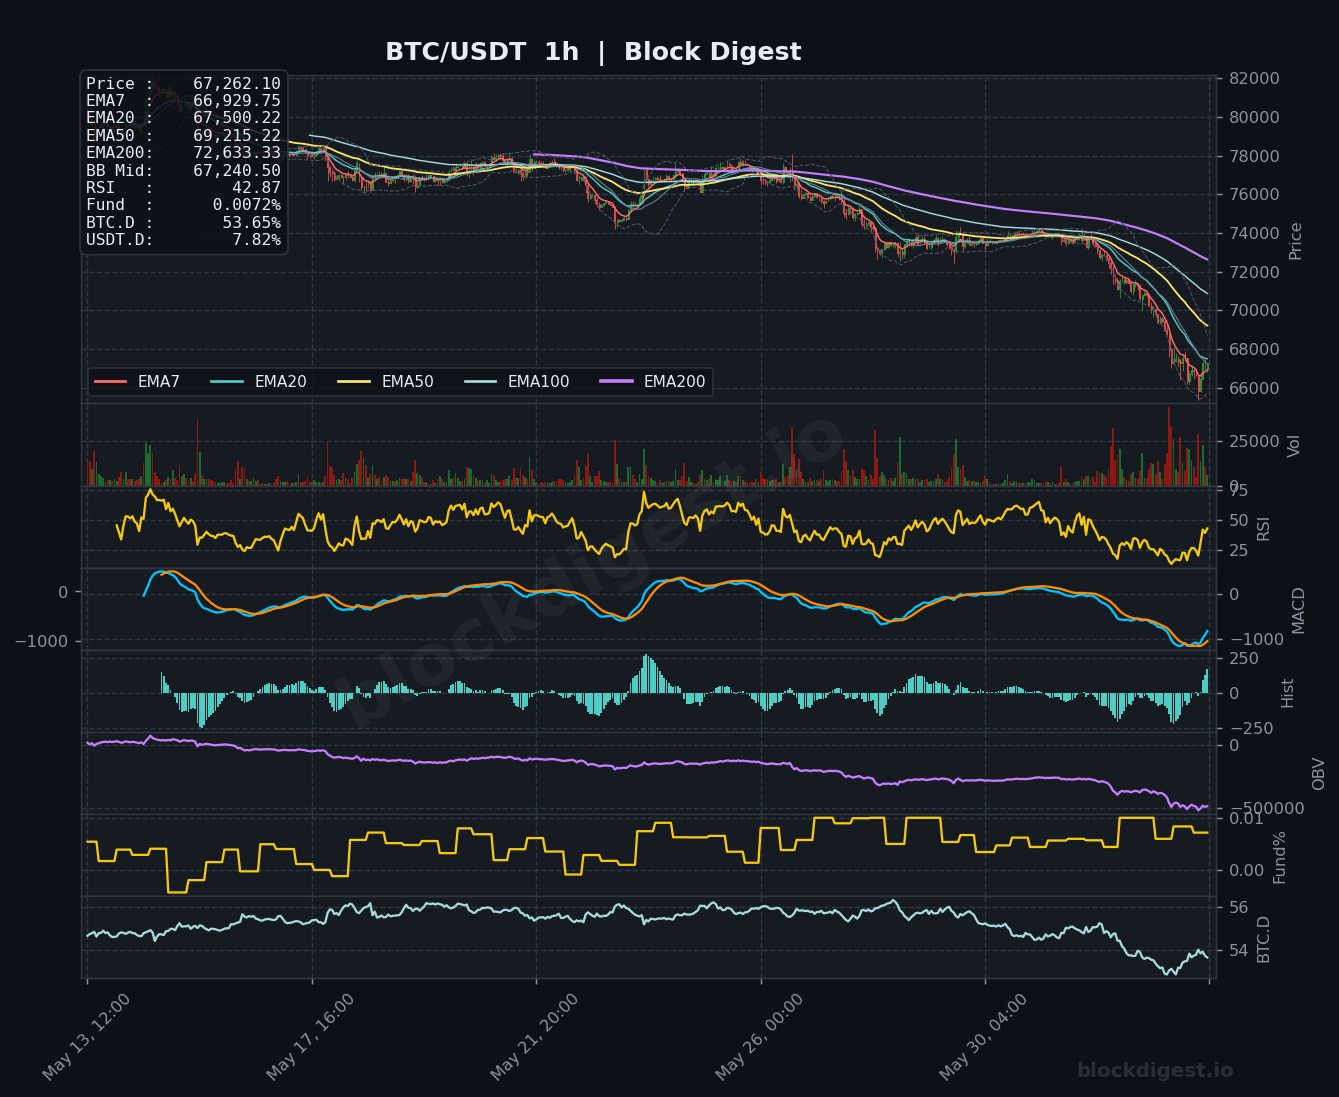
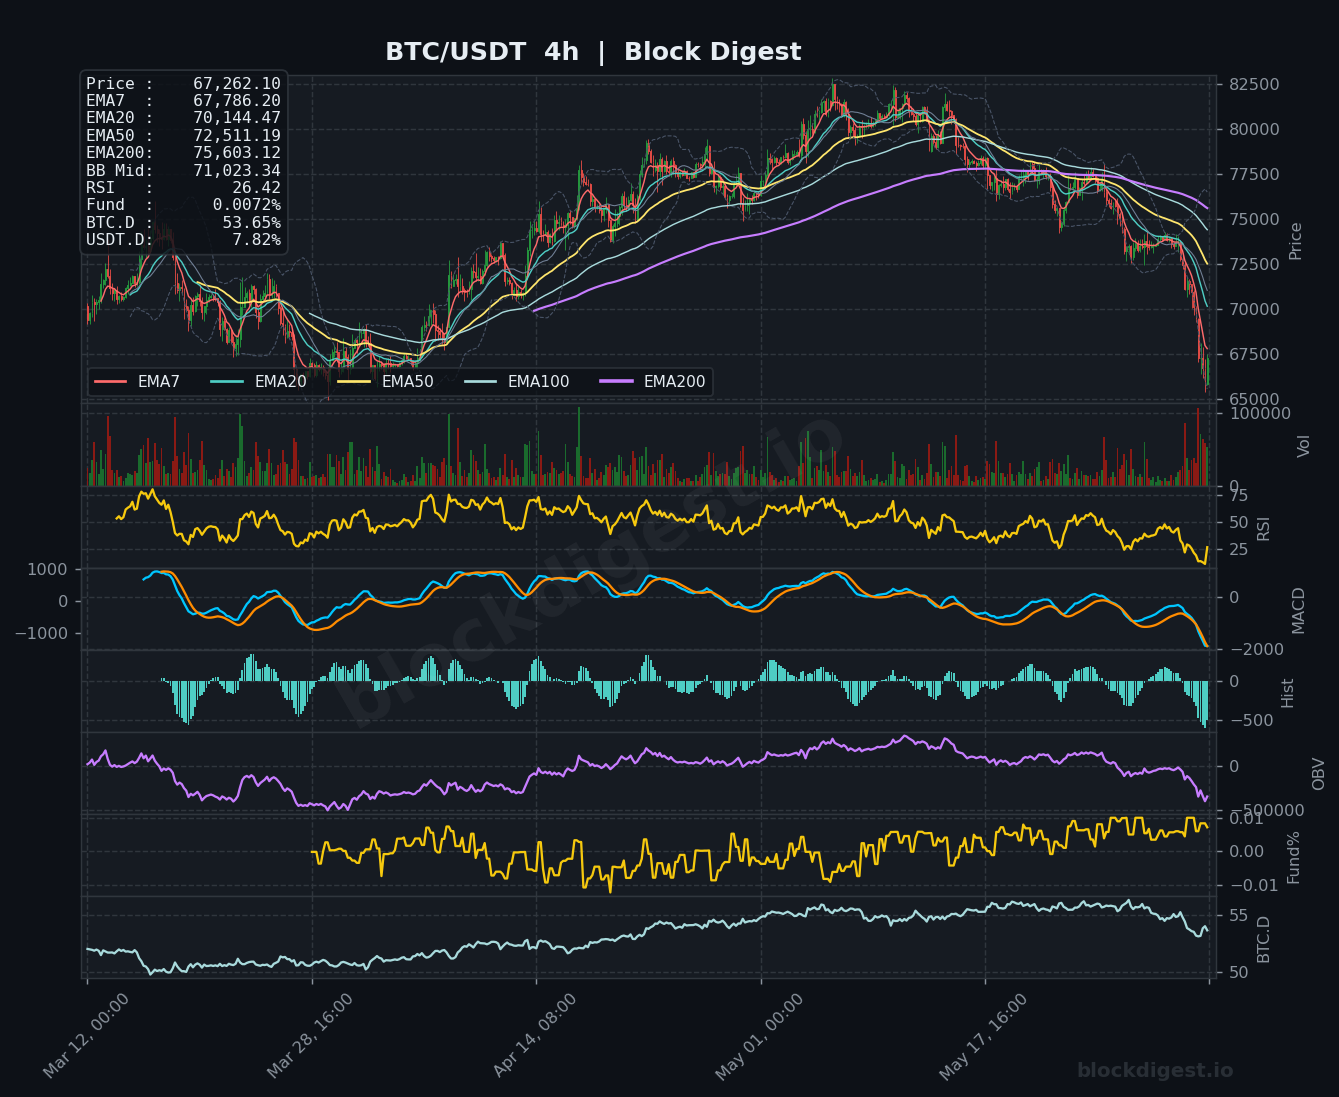
All three timeframes are in strong bearish alignment, with price trading below every major EMA on the 1h, 4h, and 1d charts simultaneously — a rare and significant confluence of downside pressure. On the 4h chart, price has sliced through the EMA200 ($75,603) and the BB midline ($71,023), with the EMA7 ($67,786) now acting as dynamic overhead resistance just above current price. The 1h chart shows a slight potential stabilization with price hovering near its BB midline ($67,240), but short-term EMAs remain in a bearish stack with EMA50 ($69,215) and EMA200 ($72,633) both capping any recovery attempts. There is no meaningful bullish divergence across timeframes to suggest a structural reversal is imminent.
Key Levels to Watch
- Resistance: $69,215 — the 1h EMA50, which previously acted as support and now serves as the first significant overhead barrier for any bounce attempt
- Resistance: $70,144 — the 4h EMA20, a dynamic level aligned with recent consolidation that failed in early June
- Resistance: $72,511 — the 4h EMA50 and a confluent region that aligns with prior distribution before the recent breakdown
- Support: $66,654 — the current spot price cluster noted in broader market data, representing near-term intraday lows and a psychological level
- Support: ~$65,000 — a key round-number level and chart gap zone visible on the 4h structure that could attract buyer interest on a deeper flush
- Support: ~$62,000–$63,000 — a macro demand zone visible on the daily chart corresponding to the consolidation base from early 2026
Momentum & On-Chain Signals
RSI readings are deeply oversold across all timeframes: 42.87 on the 1h (approaching oversold), 26.42 on the 4h (firmly oversold), and 24.50 on the 1d (critically oversold, near levels last seen during major capitulation events). The daily MACD remains in a deep bearish cross with both the MACD line and signal line well below zero and the histogram printing expanding red bars, confirming sustained selling pressure with no imminent reversal signal. OBV on both the 4h and 1d charts is trending sharply lower, indicating active distribution rather than accumulation at these levels — a bearish divergence from the price recoveries seen in February and March 2026. On-chain data does add one nuance: BTC accumulated in late 2025 has crossed the 155-day long-term holder threshold, suggesting a cohort of conviction holders is unlikely to capitulate at current prices.
BTC Dominance & Market Sentiment
BTC dominance is currently at 53.65%, a notable decline from the elevated readings seen earlier in the cycle, suggesting capital may be rotating — though not necessarily into altcoins given the broad market weakness. USDT dominance at 7.82% reflects a moderate degree of risk-off positioning, with investors moving toward stablecoins, consistent with the recent 7% daily drop and negative weekly performance. K33 Research’s characterization of a “choppy summer” appears well-supported by current dominance dynamics and the AI-driven equity narrative drawing capital away from crypto.
Risk Scenarios
- Bullish case: A decisive reclaim of $69,215 (1h EMA50) on elevated volume, followed by consolidation above $70,000, would signal a short-term relief rally with an initial target toward $72,500–$73,000; confirmation would require the 4h RSI recovering above 35 and MACD histogram narrowing.
- Bearish case: A sustained close below $66,000 on the daily would open the door to the $62,000–$63,000 macro support zone, with a deeper flush toward $58,000–$60,000 possible if long-term holders begin to show signs of distribution or macro risk-off accelerates.
Outlook
The overall bias remains firmly bearish across all timeframes as of June 3, 2026, with price trading in a confirmed downtrend, below all major EMAs, and momentum indicators at or near historically oversold extremes. While the depth of the oversold RSI readings on the 4h and daily charts could trigger a technical relief bounce in the near term, oversold conditions alone are not sufficient to call a bottom in a strong trend. The critical trigger to watch in the next 24–48 hours is whether price can defend the $65,000–$66,000 zone with meaningful volume support; failure to hold this area materially increases downside risk toward $62,000. Until price can reclaim the $70,000 level and establish it as support, any bounce should be treated as a counter-trend opportunity rather than a trend reversal.
Disclaimer: This analysis is for informational purposes only and does not constitute financial advice. Cryptocurrency markets are highly volatile and unpredictable. All trading decisions should be made based on your own research and risk tolerance. Block Digest is not responsible for any financial losses incurred as a result of acting on this content.