Ethereum Daily Analysis: ETH Plunges Below All Major EMAs at $1,673
Market Overview
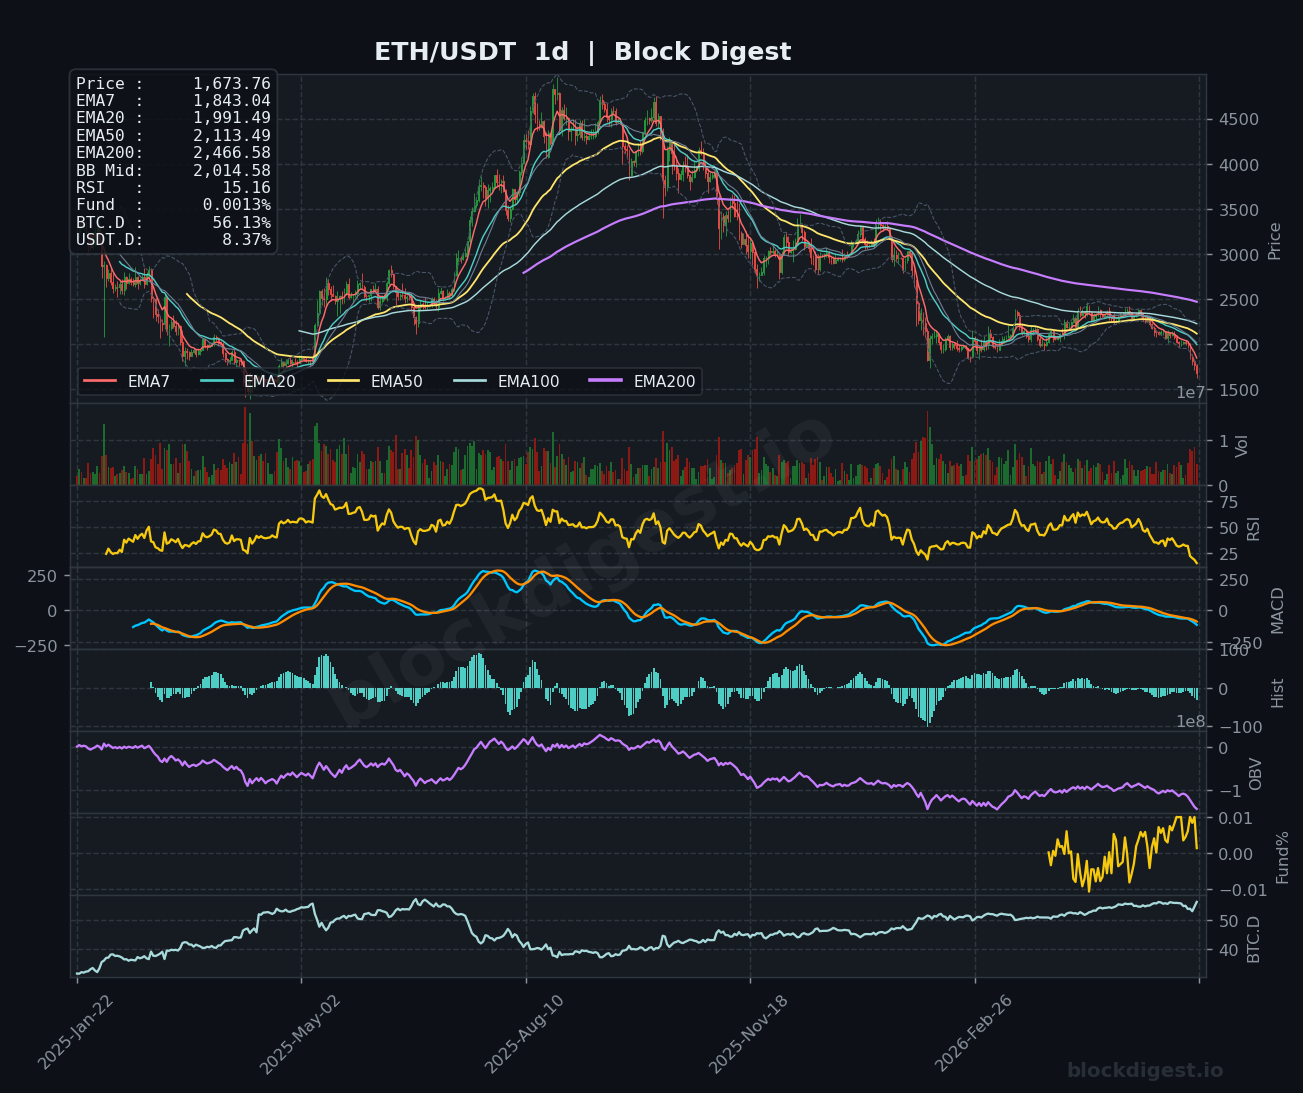
ETH/USDT is trading at $1,673.76, deep in bearish territory and printing multi-month lows as sellers maintain full control across all timeframes. Price is trading well below every major EMA on the daily chart — the EMA7 at $1,843.04, EMA20 at $1,991.49, EMA50 at $2,113.49, and the EMA200 at $2,466.58 — confirming a sustained macro downtrend with no immediate structural support overhead. The daily Bollinger Band midline sits at $2,014.58, now acting as distant resistance, while price has broken through the lower band, signaling extreme selling pressure. This type of full EMA stack rejection, where price falls beneath all moving averages in sequence, is one of the most bearish structural configurations visible on higher timeframe charts.
Multi-Timeframe Confluence
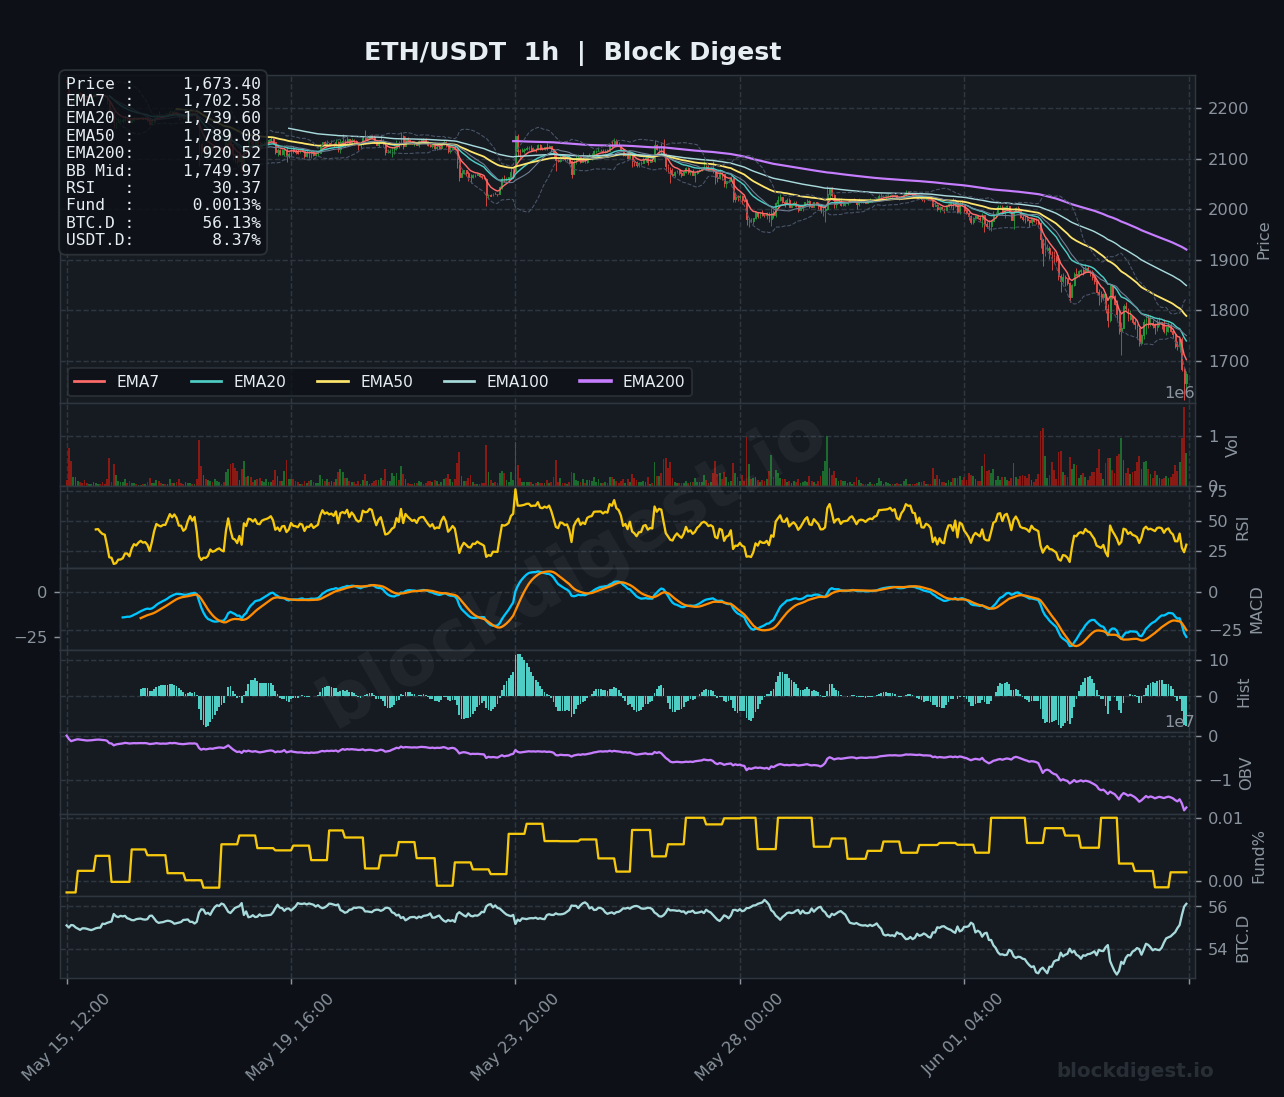
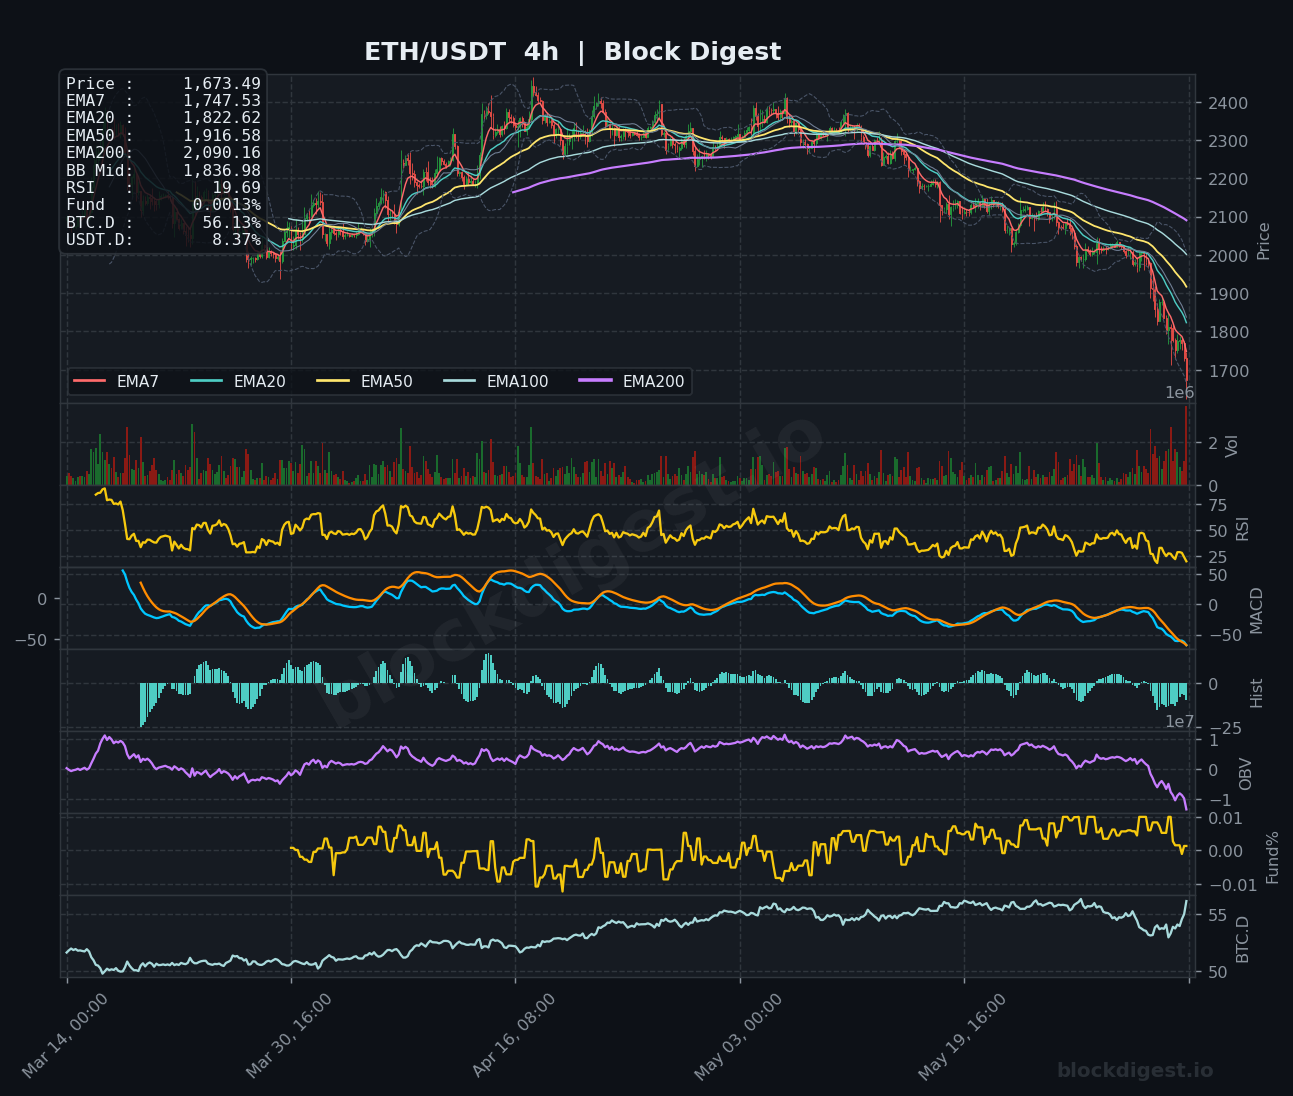
All three timeframes are in complete bearish alignment, offering no conflicting signals whatsoever — a rare and significant confluence of downside momentum. On the 1-hour chart, price sits below all EMAs with the EMA7 at $1,702.58 and EMA200 at $1,920.52 acting as stacked overhead resistance, while RSI reads an oversold 30.37. The 4-hour chart paints an even more extended deterioration, with the EMA200 at $2,090.16 now separated from price by over $400, and RSI collapsing to an extreme 19.69 — a level rarely seen outside of capitulation events. The daily timeframe confirms the macro picture: ETH has been in a structured decline since its all-time high of $4,953.73 in August 2025, and the current flush accelerates that trend with no meaningful base yet established.
Key Levels to Watch
- Resistance: $1,749.97 — the 1-hour Bollinger Band midline, which also coincides with a cluster of short-term EMAs and represents the nearest overhead obstacle for any relief bounce
- Resistance: $1,822.62 — the 4-hour EMA20, the first meaningful dynamic resistance that would need to be reclaimed to signal any credible short-term trend reversal
- Resistance: $1,916.58 — the 4-hour EMA50, a critical structural level that capped price during the broader decline and would represent a significant hurdle for bulls
- Support: $1,650–$1,620 — the immediate demand zone based on current lower Bollinger Band extension on the 1-hour and 4-hour charts; a breakdown here opens deeper downside
- Support: $1,550 — a psychological and historical reference level that previously acted as consolidation in early 2025, potentially the next meaningful floor if current lows fail
- Support: $1,480–$1,500 — deeper macro support corresponding to the lower range of the 2025 accumulation zone, representing a worst-case capitulation target
Momentum & On-Chain Signals
RSI readings across timeframes tell a consistent and alarming story: 30.37 on the 1-hour, 19.69 on the 4-hour, and 15.16 on the daily — all deeply oversold, with the daily reading among the most extreme seen in ETH’s recent history. While these levels can persist in true bear markets, they do raise the probability of a technical dead-cat bounce in the near term. The MACD on both 4-hour and daily charts shows deeply negative divergence with both signal line and histogram accelerating lower, indicating no imminent momentum reversal. OBV across all three timeframes is in steep decline, confirming that this selloff is volume-backed distribution rather than a liquidity vacuum — institutional selling appears to be driving the move, consistent with the reported ETF outflows.
BTC Dominance & Market Sentiment
BTC dominance sits at 56.13%, continuing its upward trajectory visible on the 1-hour BTC.D panel, which confirms that capital is rotating out of altcoins and into Bitcoin as a relative safe haven within the crypto ecosystem. USDT dominance at 8.37% reflects meaningful stablecoin accumulation, suggesting investors are de-risking rather than rotating into ETH or alts. This macro dynamic is particularly damaging for ETH, as rising BTC.D historically correlates with ETH underperformance, and the ETH/BTC ratio likely remains under sustained pressure.
Risk Scenarios
- Bullish case: A reclaim of the $1,750 Bollinger Band midline on the 1-hour with sustained volume and a 4-hour RSI recovery above 30 would signal a potential relief bounce toward $1,822–$1,916; this would require a broader crypto market stabilization and a halt in ETF outflows.
- Bearish case: Failure to hold the $1,650 level on a daily close would expose ETH to a slide toward $1,550 and potentially the $1,480–$1,500 macro support zone, particularly if BTC.D continues rising and macro headwinds from AI sector fears and geopolitical uncertainty persist.
Outlook
The directional bias is firmly bearish across all timeframes, with ETH exhibiting one of the most technically deteriorated setups in recent memory — a full EMA stack below price, near-record-low RSI on the daily, declining OBV, and a macro backdrop of ETF outflows and risk-off sentiment. In the next 24–48 hours, the critical trigger to watch is whether ETH can form any stabilization structure above $1,650; a bounce from extreme oversold conditions is statistically plausible but would likely be corrective rather than trend-reversing without a fundamental catalyst. The $1,822 4-hour EMA20 remains the minimum level bulls must reclaim to shift even short-term sentiment, while a daily close below $1,620 would be a strong signal that price discovery lower is still underway. Until macro conditions stabilize — particularly regarding AI sector spillover fears and ETF flow dynamics — any relief rally should be treated with caution.
Disclaimer: This analysis is for informational purposes only and does not constitute financial advice. Cryptocurrency markets are highly volatile and unpredictable. All trading decisions should be made based on your own research and risk tolerance. Block Digest is not responsible for any financial losses incurred as a result of acting on this content.