
trading
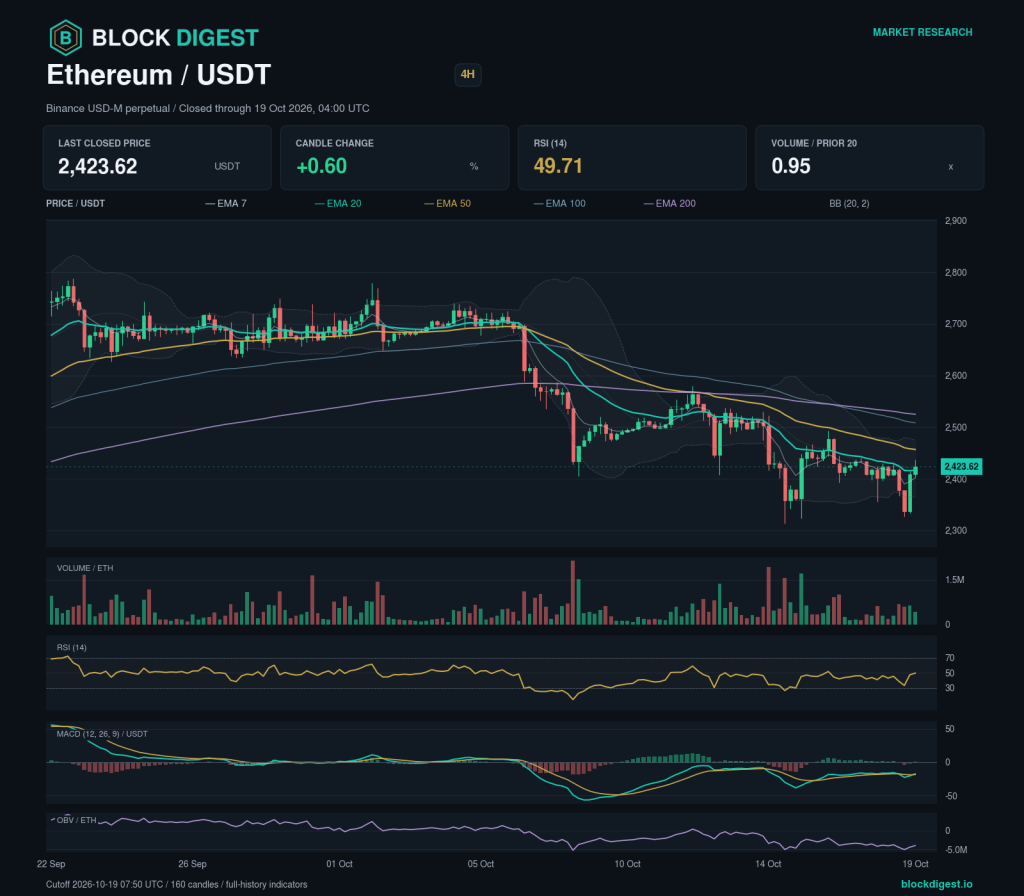
Ethereum Weekly: Daily and Weekly Structures Diverge
Weekly Market Overview Ethereum’s daily chart still shows lower confirmed highs and lows, even as weekly swings point higher. That disagreement limits conviction in the daily trend. Ethereum’s latest completed four-hour candle closed at 2,423.62 USDT, for the period ending 2026-10-19 04:00 UTC. The last daily close rose 0.31% from the previous close. The next...
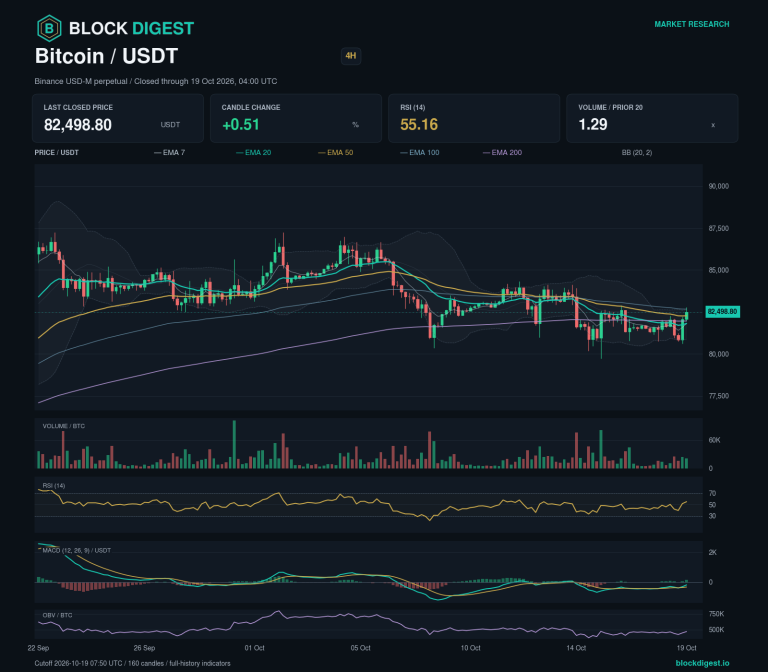
Bitcoin Weekly: Daily and Weekly Structures Diverge
Weekly Market Overview Bitcoin’s daily chart still shows lower confirmed highs and lows, even as weekly swings point higher. That disagreement limits conviction in the daily trend. Bitcoin’s latest completed four-hour candle closed at 82,498.80 USDT, for the period ending 2026-10-19 04:00 UTC. The last daily close rose 0.76% from the previous close. The next...
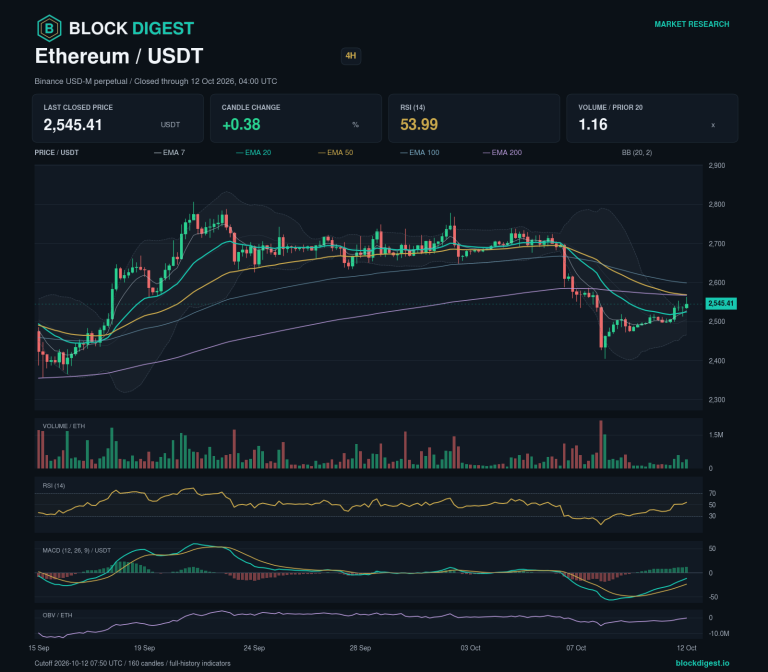
Ethereum Weekly: Key Levels Frame an Unsettled Structure
Weekly Market Overview Ethereum’s daily swing sequence offers no clear directional thesis. That puts the emphasis on the relevant support and resistance zones rather than a forecast of the next move. Ethereum’s latest completed four-hour candle closed at 2,545.41 USDT, for the period ending 2026-10-12 04:00 UTC. The last daily close rose 1.23% from the...
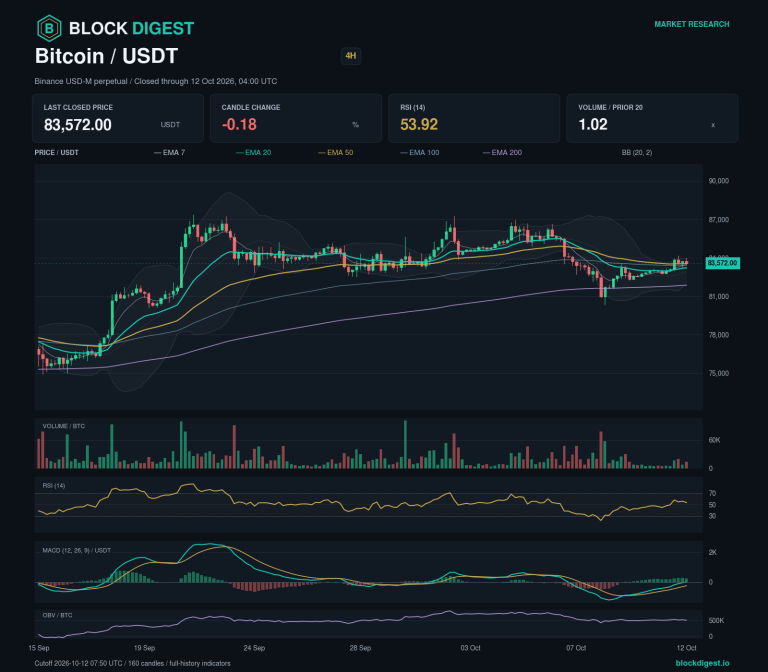
Bitcoin Weekly: Daily and Weekly Structures Diverge
Weekly Market Overview Bitcoin’s daily and weekly charts are giving different signals. With those signals in disagreement, the next structural confirmation matters more than a single directional headline. Bitcoin’s latest completed four-hour candle closed at 83,572.00 USDT, for the period ending 2026-10-12 04:00 UTC. The last daily close rose 0.94% from the previous close. BlockDigest’s...
Ethereum Weekly: Higher Swings Set the Weekly Framework
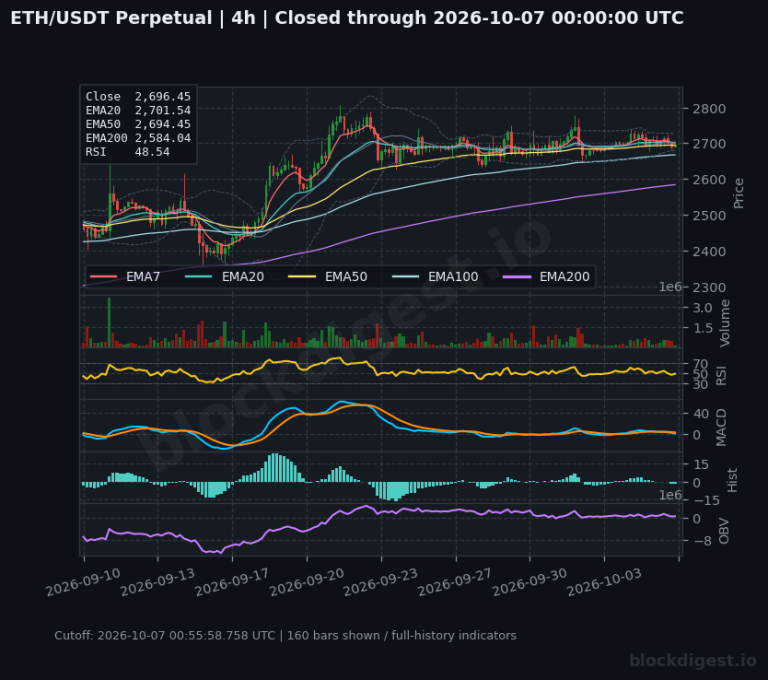
Weekly Market Overview Higher confirmed daily highs and lows underpin the weekly assessment, leaving Ethereum’s daily swing structure constructive. Ethereum’s latest completed four-hour candle closed at 2,696.45 USDT, for the period ending 2026-10-07 00:00 UTC. The last daily close fell 0.45% from the previous close. BlockDigest’s base assessment is bullish. The next upside checkpoint requires...
Bitcoin Weekly: Daily and Weekly Structures Diverge
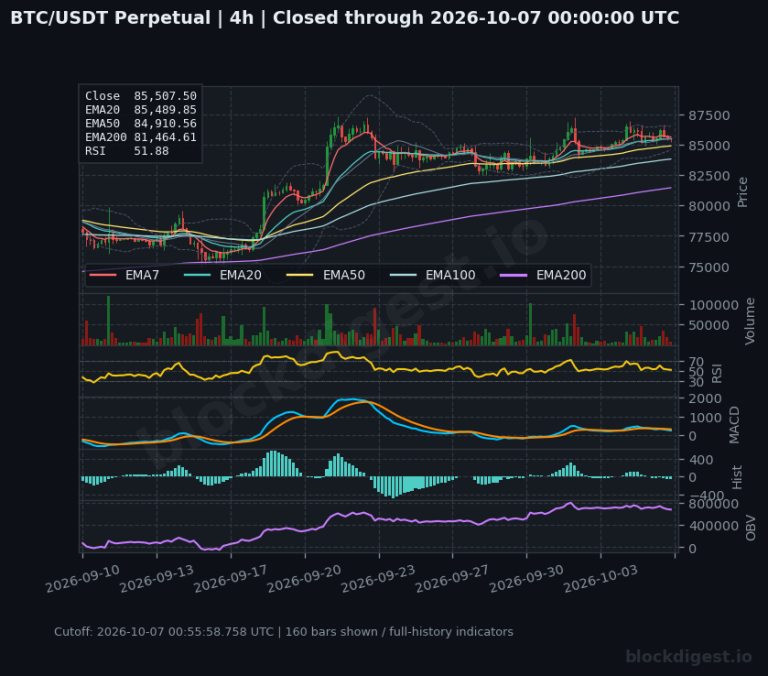
Weekly Market Overview Bitcoin’s daily and weekly charts are giving different signals. With those signals in disagreement, the next structural confirmation matters more than a single directional headline. Bitcoin’s latest completed four-hour candle closed at 85,507.50 USDT, for the period ending 2026-10-07 00:00 UTC. The last daily close fell 0.24% from the previous close. BlockDigest’s...

XRP Breaks Month-Long Triangle as Bulls Eye $1.35 Target
XRP has broken out of a month-long symmetrical triangle formation and is now testing key resistance levels, with early momentum suggesting a potential recovery toward $1.35 as traders watch for confirmation of a broader bullish reversal. The altcoin gained 4% over the past 24 hours to reach $1.13, marking its strongest daily performance in weeks...
Ethereum Weekly Analysis: Ethereum at $1,862 amid inflation and geopolitical tensions
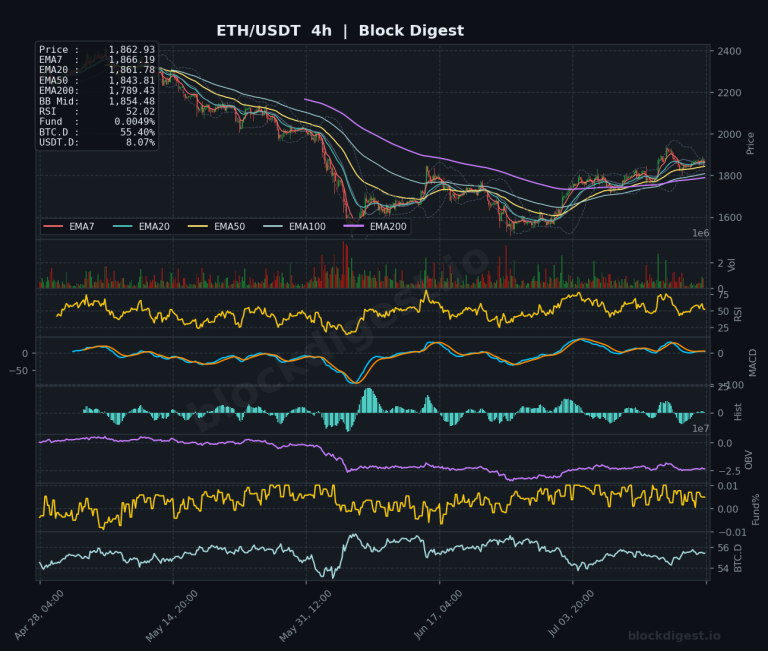
Weekly Market Overview Ethereum enters the week of July 20, 2026 trading at approximately $1,862, clinging to a tentative recovery structure after what has been a prolonged and punishing bear trend from the 2025 highs above $4,000. The week’s price action has been shaped by competing forces: a softer-than-expected U.S. inflation print briefly propelled ETH...

Bitcoin Weekly Analysis: Bitcoin Recovery at $64K Amid Soft CPI Data
Weekly Market Overview Bitcoin enters the week of July 20, 2026 in a fragile recovery posture, trading around $64,233 after clawing back from lows closer to $60,000 recorded in late June and early July. The weekly candle structure reflects a cautious bounce rather than a decisive reversal, with price attempting to stabilize above the $63,000–$64,000...
Ethereum Daily Analysis: Ethereum consolidates at $1,863 near Bollinger midline
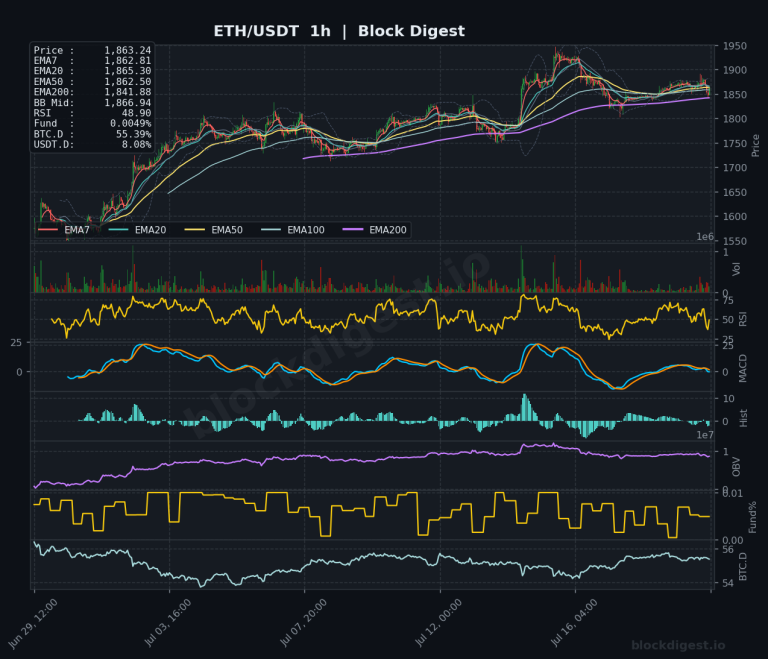
Market Overview Ethereum is trading at $1,863.63 as of July 20, 2026, consolidating just below the Bollinger Band midline on the daily chart ($1,798.10 BB Mid) after a meaningful recovery from lows near $1,550 seen earlier this quarter. Price has reclaimed all short-term EMAs on the daily timeframe — the EMA7 ($1,855.02), EMA20 ($1,806.24), and...
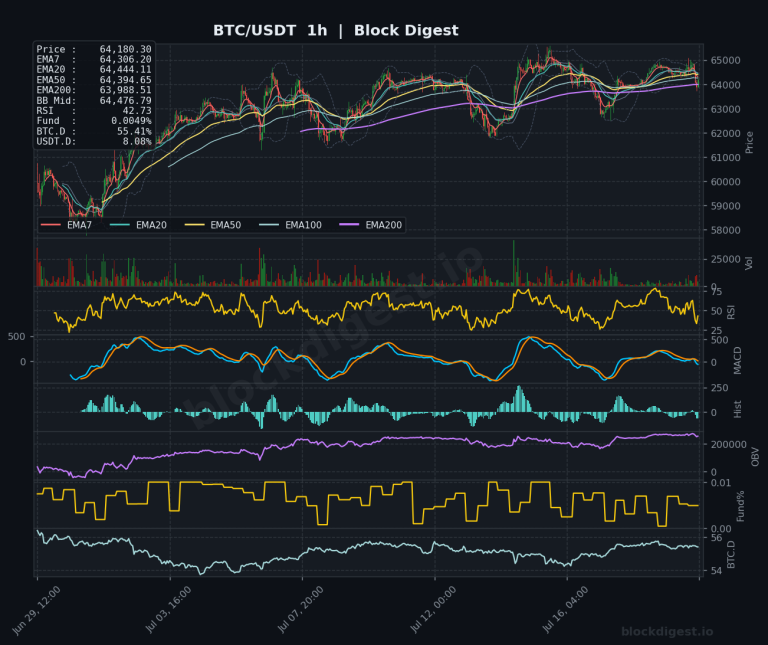
Bitcoin Daily Analysis: Bitcoin stabilizes below EMA50 after multi-month decline
Market Overview Bitcoin is trading at $64,180 as of July 20, 2026, navigating a structurally delicate zone as it attempts to stabilize following a prolonged multi-month downtrend from highs above $100,000. On the daily timeframe, price sits just below the EMA50 ($64,970) while holding marginally above the EMA7 ($64,232) and EMA20 ($63,668), suggesting the market...
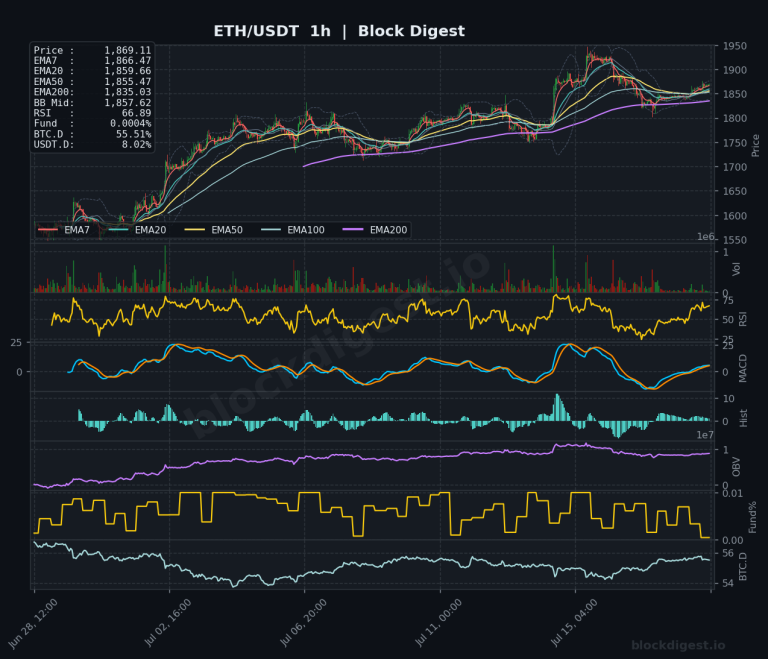
Ethereum Daily Analysis: ETH Holds $1,869 Above Key Moving Averages
Market Overview ETH/USDT is currently trading at $1,869.00, holding above its key short-term EMAs on the daily timeframe after a prolonged downtrend that saw price shed over 60% from its 2025 highs near $4,500. The daily chart shows price has reclaimed the EMA7 ($1,851.53) and is pressing above the EMA20 ($1,799.96) and EMA50 ($1,814.60) —...