
trading
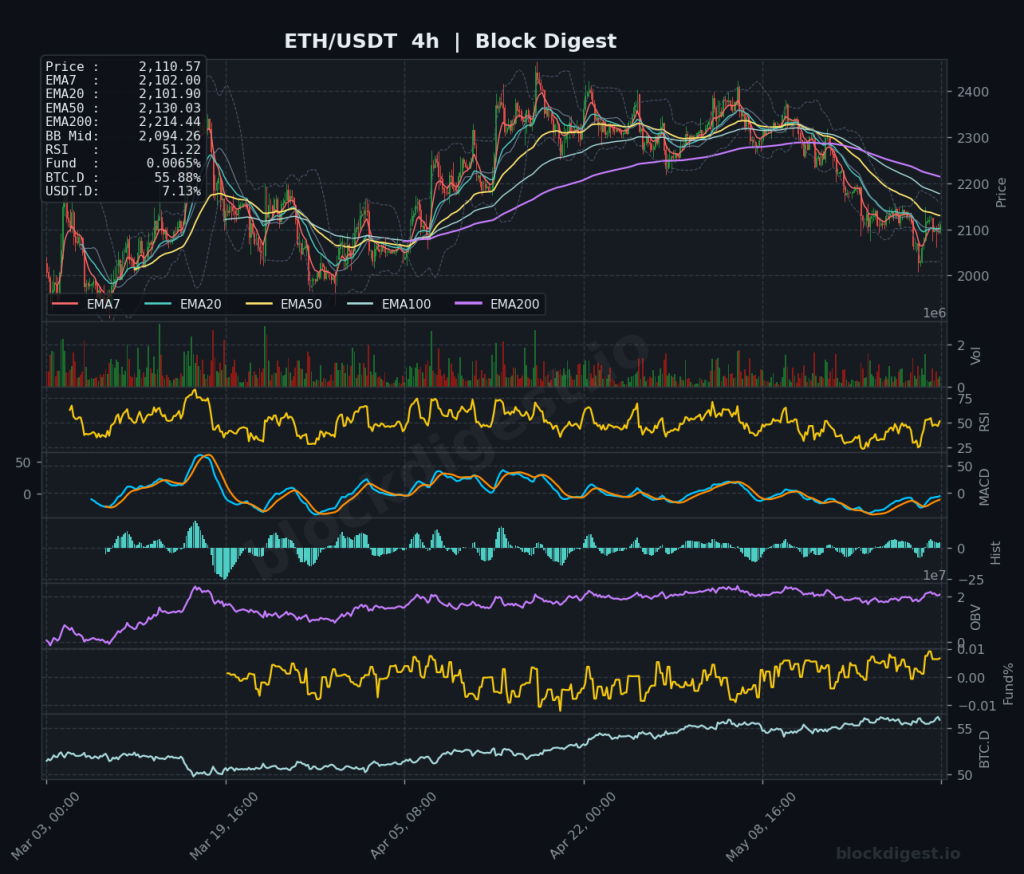
Ethereum Weekly Analysis: ETH Falls to $2,110 Amid 50% Decline From Highs
Weekly Market Overview ETH/USDT closed the week around $2,110, extending a prolonged downtrend that has seen price shed roughly 50% from its 2025 highs near $4,500. The current weekly candle is printing in deeply bearish territory, with price trading well below all major moving averages on both the weekly and daily timeframes. The recent macro...
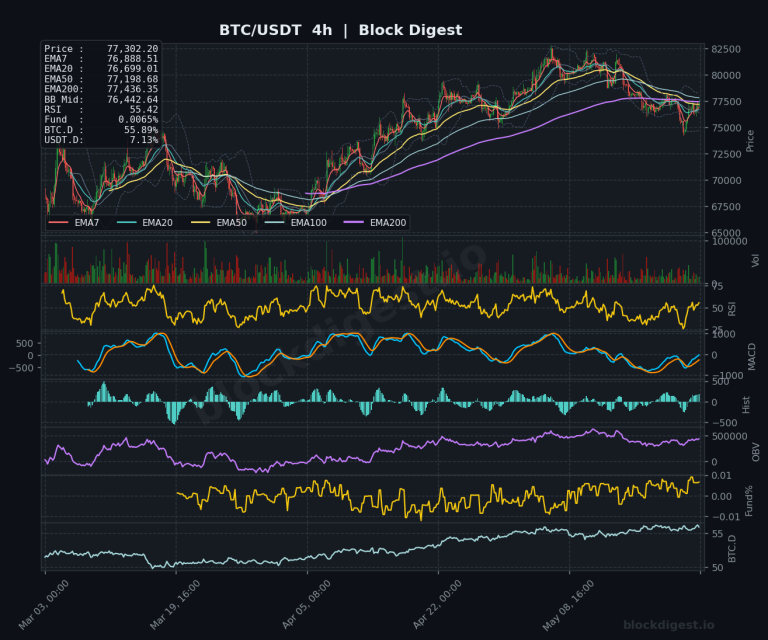
Bitcoin Weekly Analysis: Bitcoin Consolidates Below $126K All-Time High
Weekly Market Overview Bitcoin enters the final week of May 2026 trading at approximately $77,302, caught in a compressed consolidation range following its sharp rejection from the all-time high of $126,198 set in late 2025. The weekly candle structure reflects indecision, with price oscillating in a relatively tight band between $75,000 and $82,000 over recent...
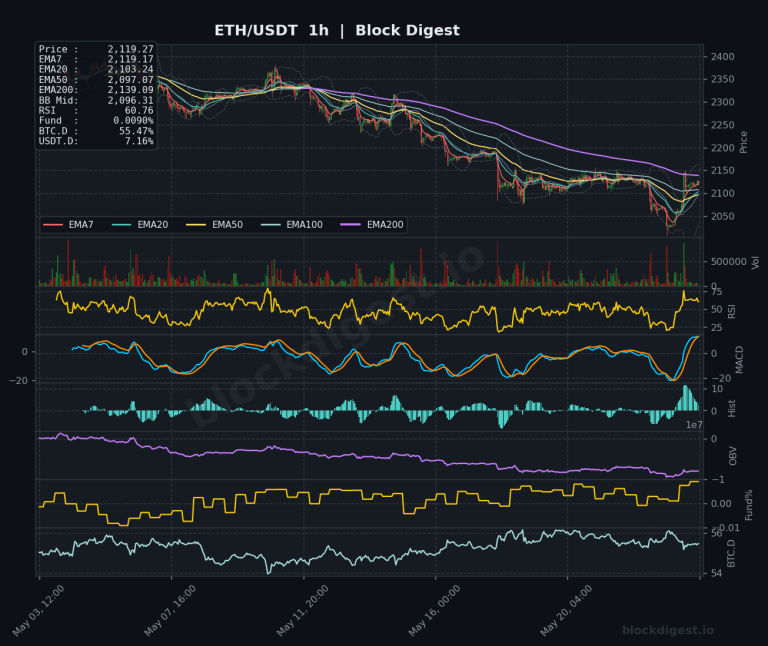
Ethereum Daily Analysis: ETH at $2,119 Below Key EMA Levels
Market Overview ETH/USDT is currently trading at $2,119.27, caught in a structurally weak position on the daily timeframe following a prolonged decline from highs above $4,000. Price sits below all major daily EMAs — the EMA20 at $2,191.55, EMA50 at $2,226.32, and the EMA200 at $2,533.59 — confirming a bearish macro structure. The daily Bollinger...
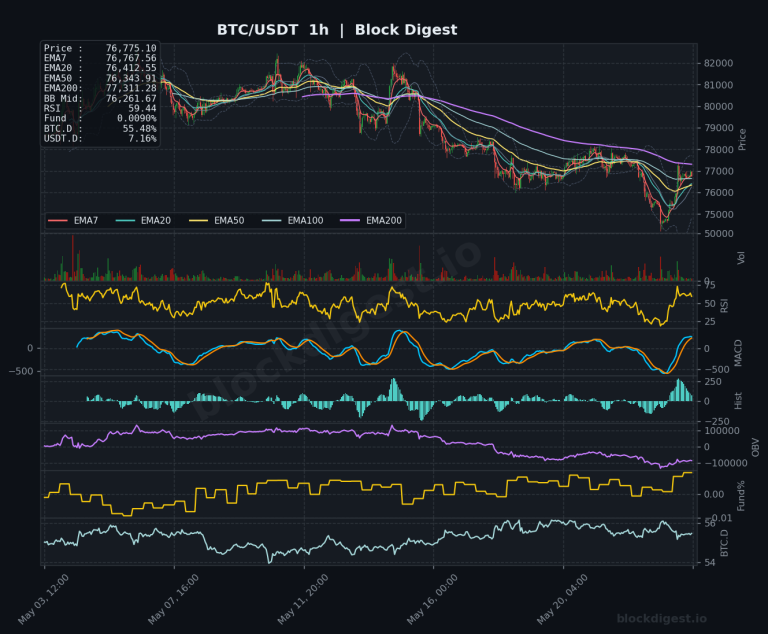
Bitcoin Daily Analysis: Bitcoin at $76,775 Below Major EMAs
Market Overview Bitcoin is currently trading at $76,775, situated in a technically challenged position below all major daily EMAs except the EMA50 ($76,719), which it is barely clinging to. On the daily timeframe, price sits well beneath the EMA7 ($77,050), EMA20 ($77,863), and the formidable EMA200 ($81,615), painting a structurally bearish picture from the higher...

Ethereum Daily Analysis: ETH breaks below $2,100 as bearish structure deepens
Market Overview ETH/USDT is currently trading at approximately $2,022–2,023, having broken decisively below the psychologically significant $2,100 level. Price sits well beneath all key EMAs on the daily timeframe — EMA7 at $2,106, EMA20 at $2,190, EMA50 at $2,227, and the EMA200 at $2,536 — confirming a deeply bearish market structure. The Bollinger Band midline...

Bitcoin Daily Analysis: Bitcoin Below All EMAs, Long-Term Resistance at $81K
Market Overview Bitcoin is trading at approximately $74,964 as of May 23, 2026, sitting beneath all major EMAs across every timeframe — a structurally bearish configuration. On the daily chart, price has broken below the EMA7 ($76,709), EMA20 ($77,813), and EMA50 ($76,649), and remains a significant distance from the EMA200 at $81,632, which continues to...

Ethereum Daily Analysis: ETH Trapped Below All Major Daily EMAs
Market Overview ETH/USDT is currently trading at $2,129.61, sitting in a technically precarious position beneath all major daily EMAs — EMA7 ($2,150.30), EMA20 ($2,214.02), EMA50 ($2,237.88), and EMA200 ($2,543.04). The daily Bollinger Band midline at $2,249.22 sits well above current price, reinforcing the bearish market structure that has dominated since the mid-2025 highs above $4,000....

Bitcoin Daily Analysis: Below EMA200 at $81,734 Near $77K Support
Market Overview Bitcoin is currently trading at $77,416.40, sitting in a technically precarious position as price consolidates beneath a cluster of short-term EMAs on the daily timeframe. The daily chart reveals a market in recovery mode following a prolonged sell-off from the all-time highs above $122,000, with price now attempting to stabilize near the $77,000–$78,000...
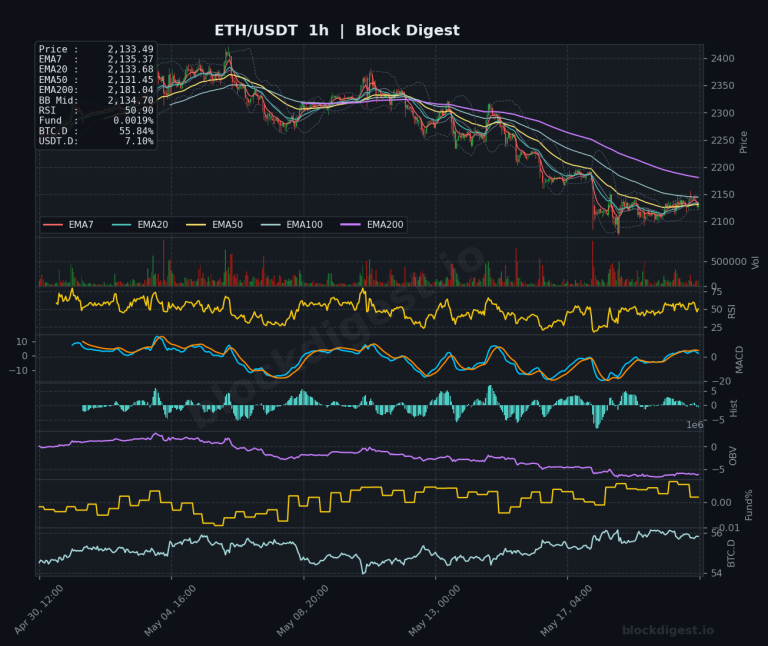
Ethereum Daily Analysis: ETH Below All EMAs, Eyes $2,133
Market Overview ETH/USDT is currently trading at $2,133.49, sitting in a structurally weak position on the daily timeframe after a sustained decline from highs above $4,000 recorded mid-2025. Price is trading well below all major daily EMAs — EMA7 at $2,157.37, EMA20 at $2,222.97, EMA50 at $2,242.32, and the EMA200 at $2,547.57 — confirming that...

Bitcoin Daily Analysis: Stuck Below $80K and Declining EMAs
Market Overview Bitcoin is trading at approximately $77,767 as of May 21, 2026, remaining stubbornly below the psychologically significant $80,000 level and struggling to reclaim key overhead resistance. On the daily timeframe, price is sandwiched below a declining EMA20 ($78,401) and EMA200 ($81,793), while sitting just above the EMA50 ($76,774) — a structure that reflects...

ETH Daily Analysis — May 20, 2026
Market Overview Ethereum is trading at $2,128.15, positioned well below all major exponential moving averages across timeframes, signaling continued bearish pressure. The daily chart shows price trading beneath the EMA7 ($2,165), EMA20 ($2,232), EMA50 ($2,246), and significantly below the EMA200 ($2,553), confirming a firmly established downtrend. The Bollinger Bands on the 1-hour chart show price...
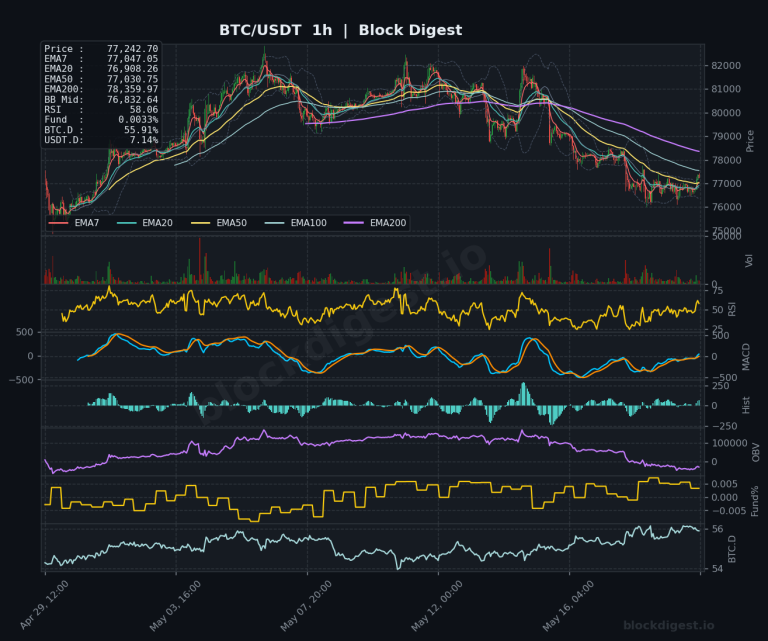
BTC Daily Analysis — May 20, 2026
Market Overview Bitcoin is trading at $77,240, exhibiting signs of consolidation after a significant retracement from recent highs above $120,000. Price is currently trading below all major EMAs on the 1-hour timeframe, with the EMA7 at $77,047 and EMA200 at $78,360 providing immediate overhead resistance. The Bollinger Band middle line sits at $76,833, with price...