Ethereum Daily Analysis: ETH Tests $2,000 Level Below EMA Stack
Market Overview
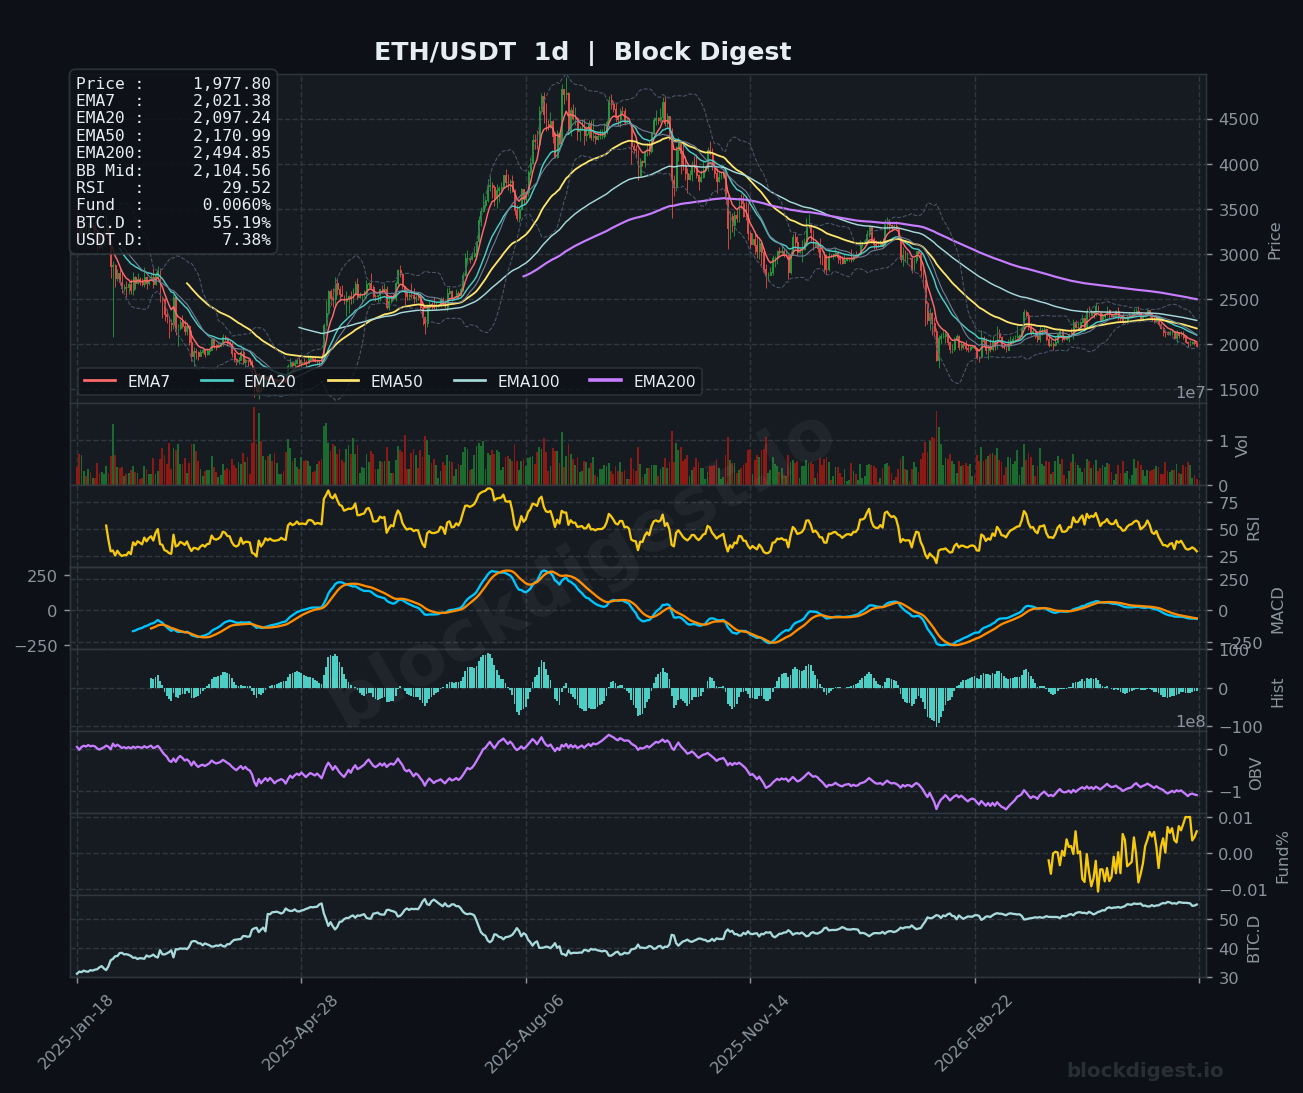
ETH/USDT is trading at $1,977.80–$1,978.01, sitting firmly below all major EMAs across every timeframe — a structurally bearish configuration. On the daily chart, price has been in a pronounced downtrend since the highs above $4,000, and is currently testing the psychologically significant $2,000 level from below, with the Bollinger Band midline at $2,104.56 acting as overhead resistance. The EMA stack on the daily (EMA7: $2,021, EMA20: $2,097, EMA50: $2,171, EMA200: $2,495) is fully bearish-ordered, confirming that sellers remain in control of the dominant trend. Price is hugging the lower Bollinger Band on the daily timeframe, which historically signals either exhaustion of a move or the beginning of a sustained compression phase.
Multi-Timeframe Confluence
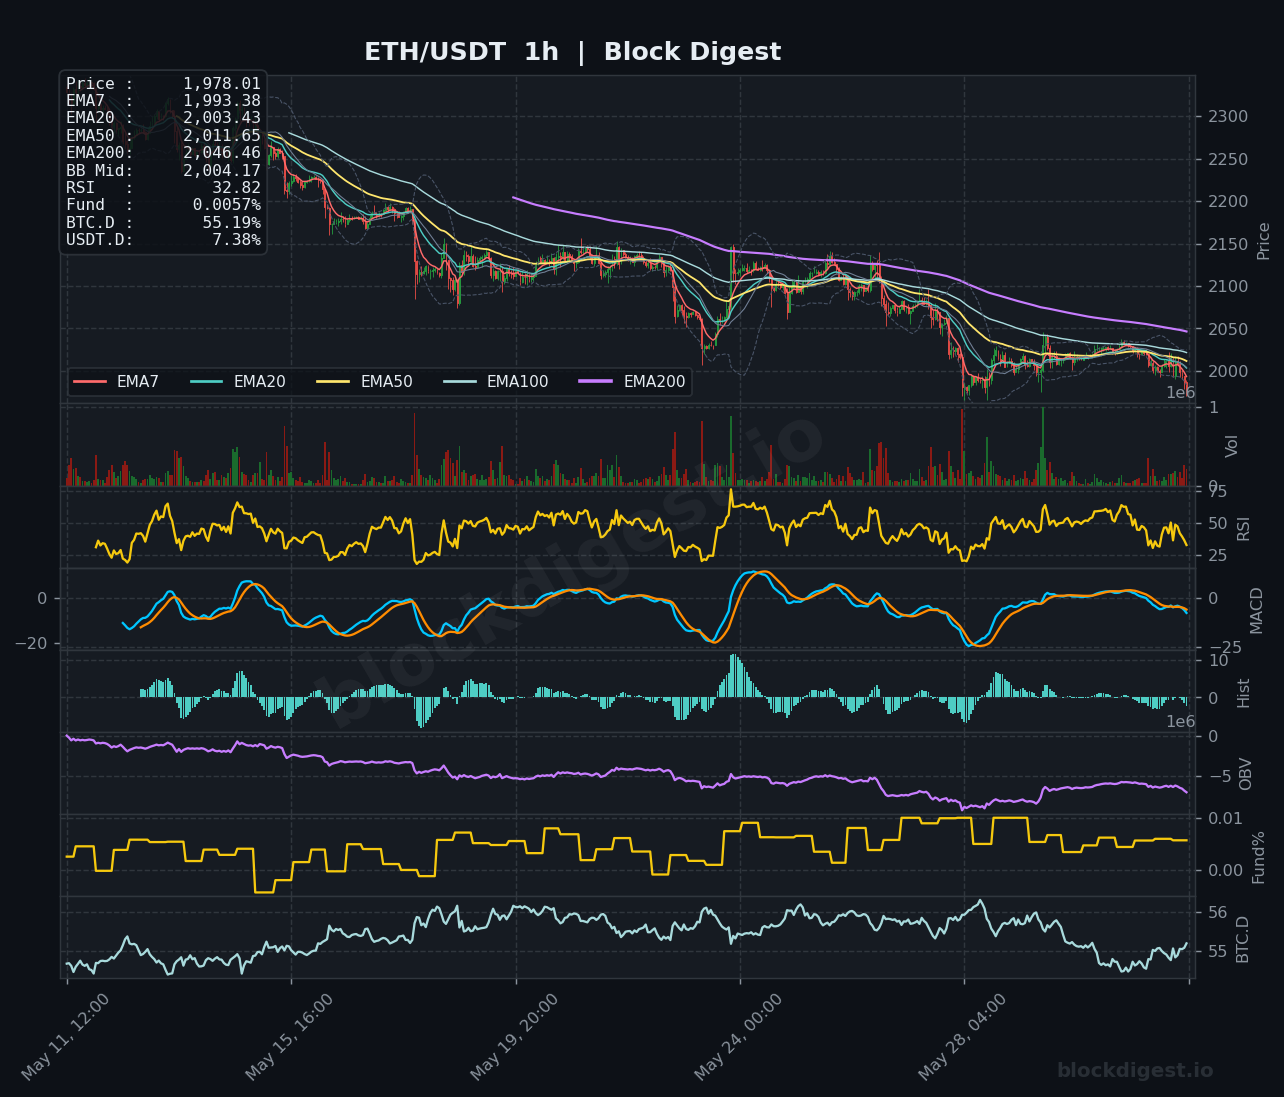
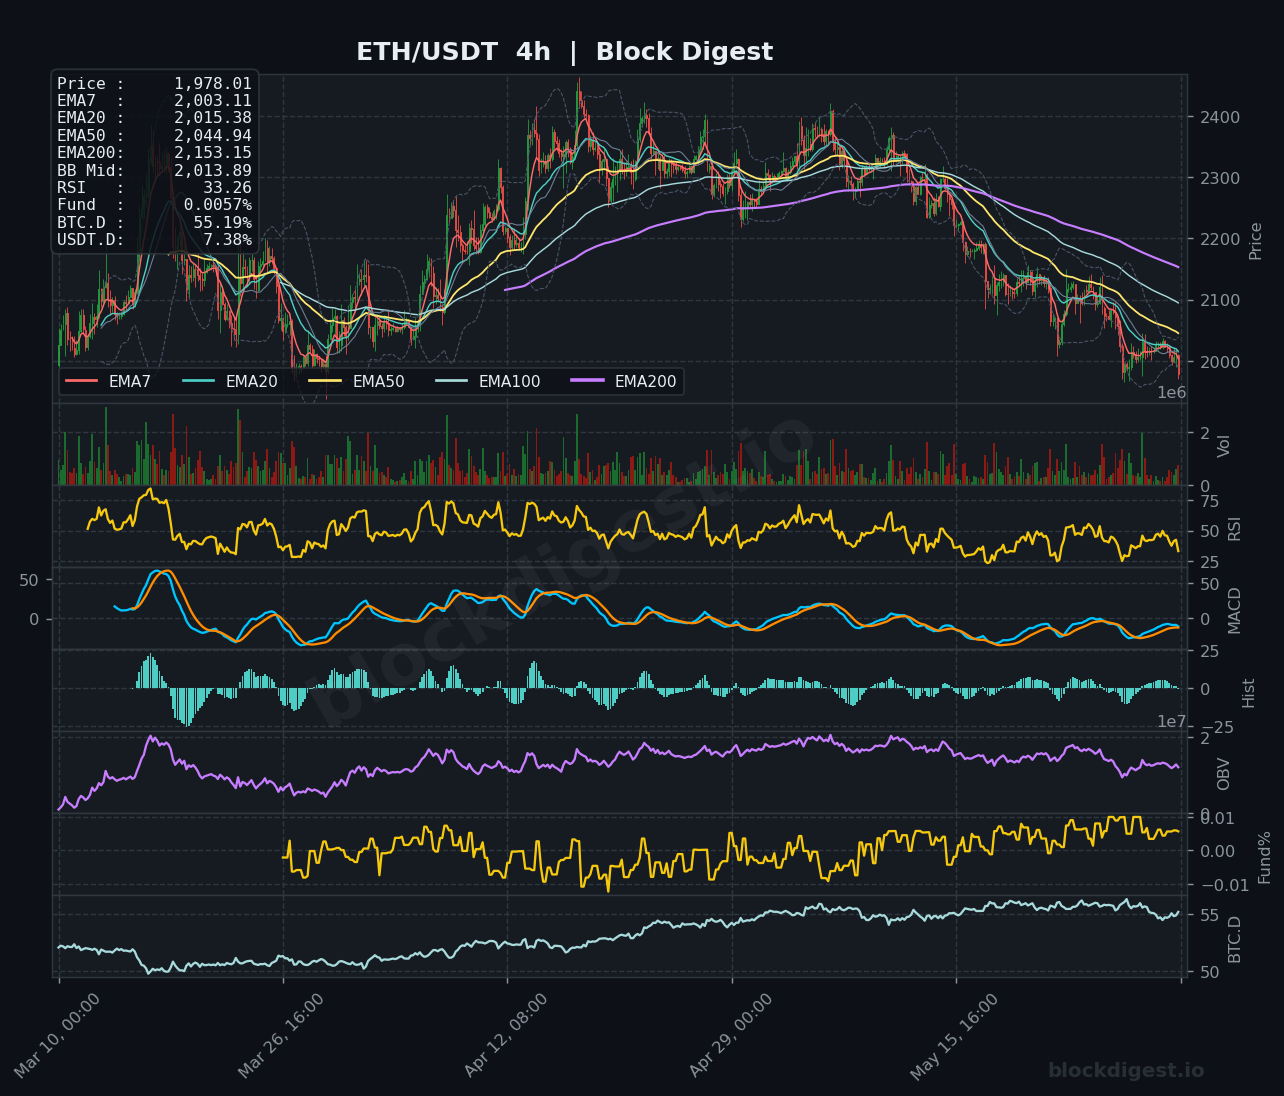
All three timeframes present a uniformly bearish picture, with no meaningful divergence between them. On the 1-hour chart, price sits below EMA7 ($1,993), EMA20 ($2,003), EMA50 ($2,012), and EMA200 ($2,046), with the short-term EMAs in tight bearish compression just above spot price. The 4-hour chart reinforces this view: EMA7 ($2,003), EMA20 ($2,015), and EMA50 ($2,045) are all stacked above price, and the EMA200 at $2,153 represents a significant overhead hurdle that has not been tested recently. The only potential near-term positive is that RSI across all timeframes is approaching or in oversold territory, which could trigger a technical bounce, but absent a catalyst, this alignment argues for continued downside pressure or, at best, a range-bound consolidation near $2,000.
Key Levels to Watch
- Resistance: $2,003–$2,012 — Confluence of the 1h EMA20, EMA50, and 4h EMA7; immediate ceiling that bulls must reclaim to shift short-term momentum
- Resistance: $2,044–$2,046 — 4h EMA50 and 1h EMA200 cluster; a recovery above this zone would mark a meaningful structural shift
- Resistance: $2,097–$2,104 — Daily EMA20 and Bollinger Band midline; reclaiming this area would suggest a potential trend reversal is underway
- Support: $1,978–$1,960 — Current price action zone; near-term demand area and psychological $2,000 round number; a decisive close below this risks accelerating sell pressure
- Support: $1,900–$1,920 — The next significant support zone, visible on the daily chart as a prior consolidation band; loss of $1,960 would likely target this area quickly
- Support: $1,800–$1,820 — Deeper structural support referenced on the daily; a worst-case scenario target if broader market conditions deteriorate further
Momentum & On-Chain Signals
RSI readings across all timeframes are deeply depressed: 32.82 on the 1-hour, 33.26 on the 4-hour, and 29.52 on the daily — with the daily RSI approaching levels that have historically preceded at least short-term relief bounces. The MACD on the 4-hour shows both lines compressed just below the zero line with a slightly positive histogram, suggesting selling momentum may be decelerating, though no bullish crossover has been confirmed. OBV on the 1-hour has been declining steadily, indicating ongoing distribution rather than accumulation at current levels, while the 4-hour OBV similarly rolled over after the macro peak, corroborating bearish volume flow. The funding rate at 0.0057%–0.0060% is marginally positive and neutral, suggesting the market is not yet in the extreme negative territory that would signal a forced short squeeze setup.
BTC Dominance & Market Sentiment
BTC dominance stands at 55.19%, a relatively elevated reading that reflects ongoing capital rotation away from altcoins toward Bitcoin — a headwind for ETH specifically. USDT dominance at 7.38% indicates a meaningful portion of market participants remain in stablecoins, suggesting risk appetite has not fully returned and sidelined capital has yet to redeploy aggressively into altcoin markets. Until BTC.D shows a sustained reversal lower, ETH is likely to remain under relative underperformance pressure versus Bitcoin.
Risk Scenarios
- Bullish case: A sustained reclaim of the $2,003–$2,012 EMA cluster on the 1-hour and 4-hour timeframes, accompanied by a volume increase and OBV inflection, could trigger a relief rally targeting the $2,044–$2,097 resistance zone. Daily RSI recovering above 35–40 alongside this price action would strengthen conviction for a short-term counter-trend bounce.
- Bearish case: A confirmed daily close below $1,960, particularly on elevated volume with OBV continuing to decline, would open the door to a rapid test of $1,900–$1,920. Failure to hold that zone with daily RSI already near oversold levels could accelerate a move toward the $1,800–$1,820 structural support.
Outlook
The overall bias remains cautiously bearish to neutral, with ETH trapped in a macro downtrend and failing to hold the psychologically critical $2,000 level with conviction. The next 24–48 hours will be pivotal: a sustained hourly close above $2,012 with improving volume would be the minimum requirement to suggest short-term stabilization, while a break below $1,960 on any timeframe would signal the next leg lower is beginning. Traders should monitor whether the daily RSI — approaching 29 — produces a technical bounce or continues to compress, as the latter would signal unusually strong selling pressure. Until EMA structure begins to flatten and OBV shows signs of accumulation, the path of least resistance remains to the downside.
Disclaimer: This analysis is for informational purposes only and does not constitute financial advice. Cryptocurrency markets are highly volatile and unpredictable. All trading decisions should be made based on your own research and risk tolerance. Block Digest is not responsible for any financial losses incurred as a result of acting on this content.