Ethereum Daily Analysis: ETH Falls Below Key EMAs at $1,878
Market Overview
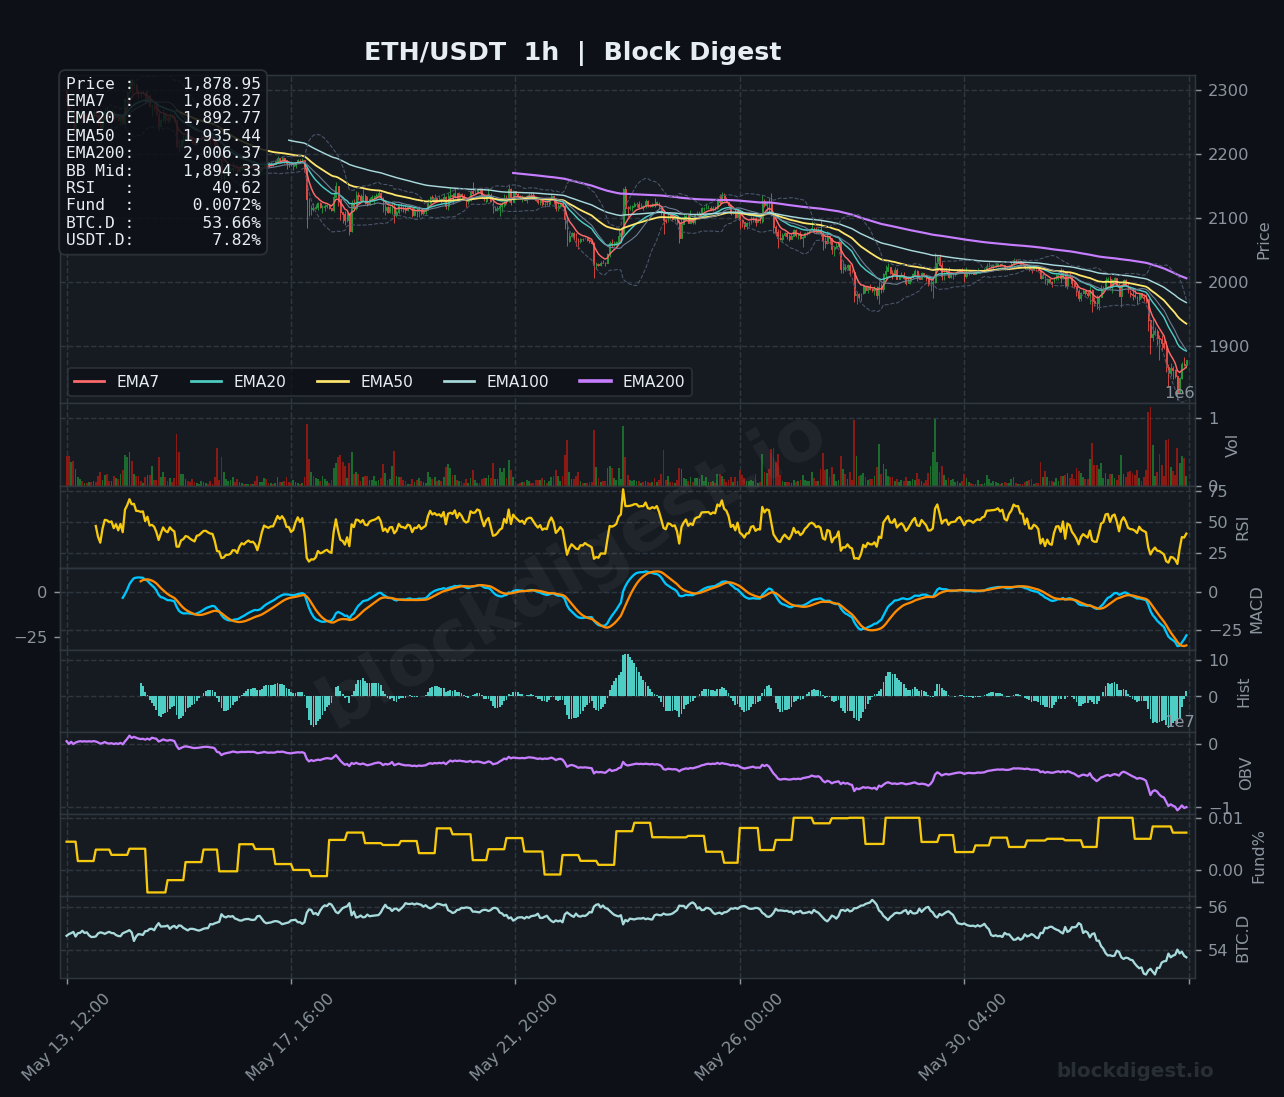
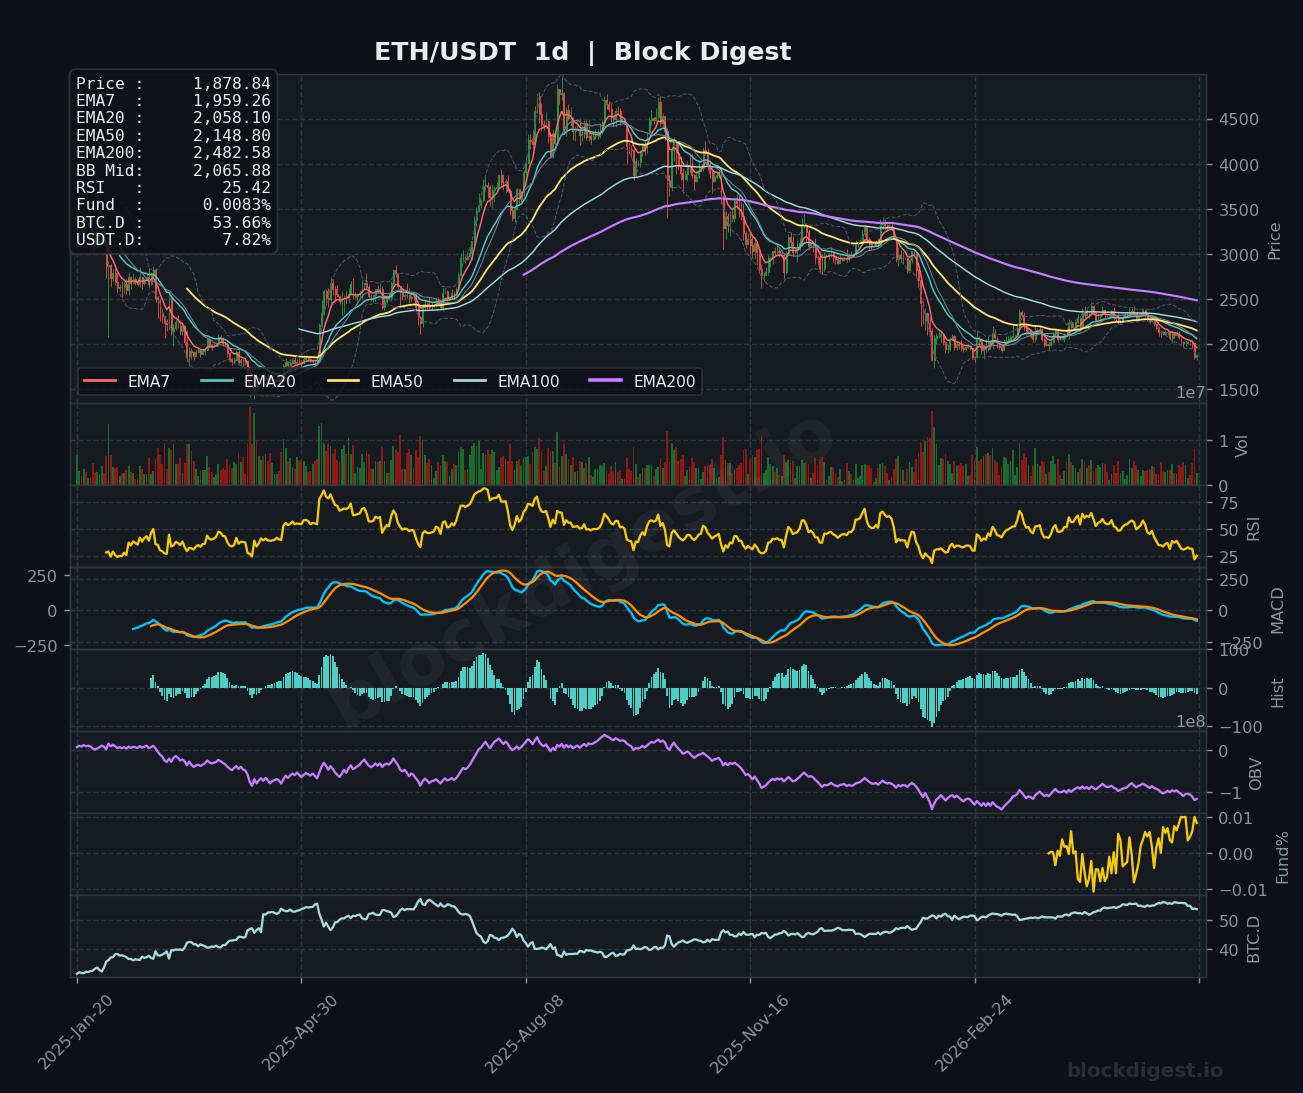
ETH/USDT is trading at $1,878.84–$1,878.95 as of June 3, 2026, extending a sharp multi-week decline that has pushed price well below all major exponential moving averages on every timeframe. On the daily chart, ETH sits beneath the EMA7 ($1,959.26), EMA20 ($2,058.10), EMA50 ($2,148.80), and the EMA200 ($2,482.58), confirming a deeply bearish macro structure. Price has also broken decisively below the Bollinger Band midline ($2,065.88) on the daily, and current candles are pressing against or through the lower band — a sign of significant selling pressure rather than a mean-reversion bounce. The dominant trend on the daily timeframe remains unambiguously bearish, with no structural reversal signals yet present.
Multi-Timeframe Confluence
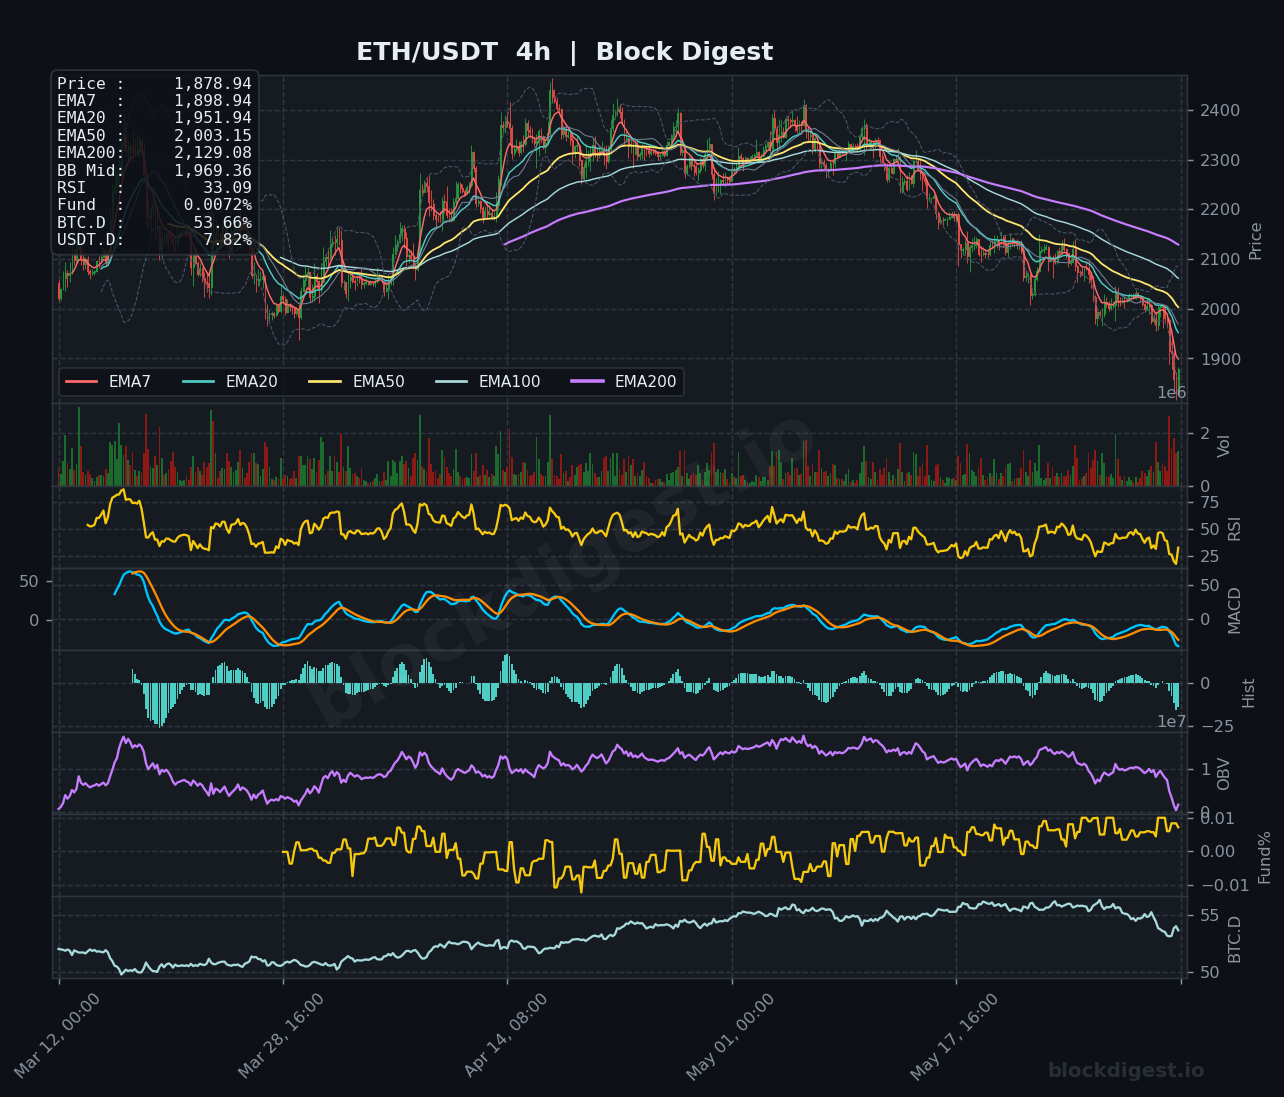
Across all three timeframes, the bearish alignment is consistent and reinforcing: EMAs are in full bearish stack (EMA7 < EMA20 < EMA50 < EMA200) on the 1h, 4h, and 1d charts simultaneously. On the 1-hour chart, the EMA200 sits at $2,006.37, acting as a formidable overhead resistance, while the 4-hour EMA200 at $2,129.08 represents an even larger structural barrier to any recovery. Short-term price action on the 1h is showing a modest attempt to stabilize near $1,878, but this nascent bounce has yet to reclaim even the 1h EMA7 at $1,868.27, suggesting it may be nothing more than a brief pause in the downtrend. There is no meaningful divergence between timeframes — all point to sustained distribution and bearish momentum.
Key Levels to Watch
- Resistance: $1,969.36 — 4h Bollinger Band midline, near-term overhead cap for any relief rally
- Resistance: $2,003–$2,006 — confluence of the 4h EMA50 ($2,003.15) and 1h EMA200 ($2,006.37), a critical zone that must be reclaimed to shift short-term bias
- Resistance: $2,058.10 — daily EMA20, the first meaningful structural resistance on the higher timeframe; reclaiming this level would represent a significant change in character
- Support: $1,878 — current price zone and immediate short-term floor; a break and close below here opens further downside
- Support: ~$1,800 — psychological round-number support and a key area referenced in prior macro lows from early 2025
- Support: ~$1,750 — lower Bollinger Band extension on the daily timeframe; a flush to this zone would represent extreme oversold conditions
Momentum & On-Chain Signals
The RSI readings across all timeframes are deeply bearish: the 1h RSI sits at 40.62, the 4h RSI at 33.09, and the daily RSI at a critically low 25.42 — the latter approaching historically oversold territory not seen in many months. The MACD on both the 1h and 4h is in confirmed bearish crossover territory, with the histogram printing expanding negative bars, indicating accelerating downside momentum rather than deceleration. OBV on the 4h chart has turned sharply lower after a prolonged period of accumulation, confirming that net volume flow is now distinctly distributional — a particularly concerning signal given OBV’s historically reliable trend-following nature. The funding rate remains marginally positive at 0.0072%–0.0083%, suggesting that despite the selloff, leveraged longs have not been fully flushed, which leaves residual risk of further liquidation cascades.
BTC Dominance & Market Sentiment
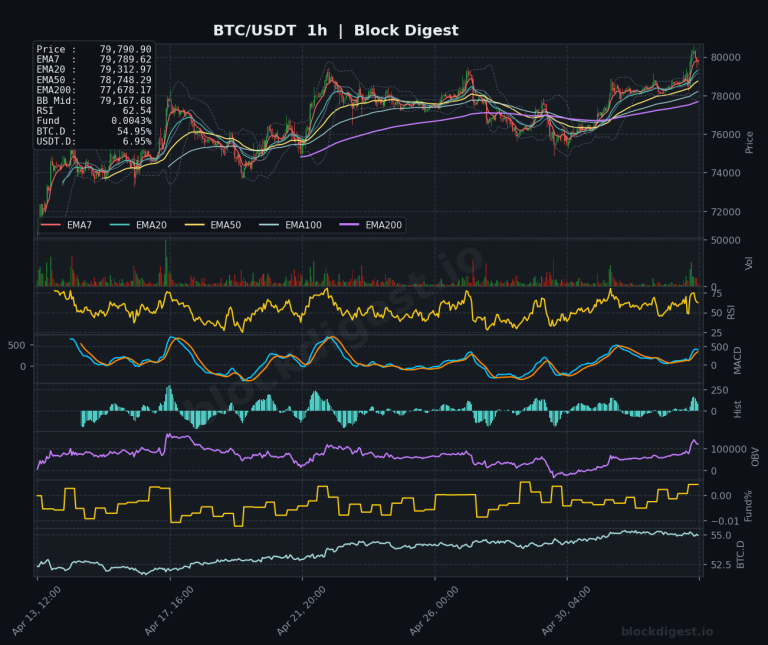
BTC dominance (BTC.D) is currently at 53.66%, having risen meaningfully from the sub-50% levels seen earlier in the cycle, signaling a classic risk-off rotation where capital is consolidating into Bitcoin at the expense of altcoins including ETH. USDT dominance (USDT.D) at 7.82% remains elevated, reflecting a continued preference for cash and stable assets rather than deployment into risk — a headwind for ETH recovery in the near term. For ETH specifically, an elevated BTC.D with no sign of reversal suggests the ETH/BTC pair remains under pressure, and a broad altcoin recovery is unlikely without a sustained drop in BTC dominance first.
Risk Scenarios
- Bullish case: A reclaim of $1,969–$2,006 on a 4h closing basis, accompanied by an RSI recovery above 45 on the 4h and a bullish MACD crossover, would suggest a credible relief rally toward the $2,058–$2,148 resistance cluster. Sustained buying volume confirmed by OBV turning higher would be required to validate any recovery thesis.
- Bearish case: A decisive 4h close below $1,878 with expanding sell volume would confirm continuation of the downtrend, opening a measured move toward $1,800 and potentially $1,750. Funding rates turning negative and OBV making new lows would further validate this breakdown scenario.
Outlook
The path of least resistance for ETH remains to the downside as of June 3, 2026, with all major timeframes aligned bearishly and momentum indicators yet to show meaningful exhaustion. The daily RSI at 25.42 does place ETH in technically oversold territory, which warrants caution for aggressive short entries at current levels — a short-term bounce toward $1,969–$2,006 cannot be ruled out. Key triggers to watch over the next 24–48 hours include whether the $1,878 support holds on a closing basis and whether BTC.D shows any signs of reversal, which would be a prerequisite for altcoin stabilization. A failure to reclaim $2,006 on any bounce would reinforce the bearish thesis and keep the $1,750–$1,800 zone as the next logical downside target.
Disclaimer: This analysis is for informational purposes only and does not constitute financial advice. Cryptocurrency markets are highly volatile and unpredictable. All trading decisions should be made based on your own research and risk tolerance. Block Digest is not responsible for any financial losses incurred as a result of acting on this content.