Bitcoin Daily Analysis: BTC at $63.8K, Below All Major EMAs
Market Overview
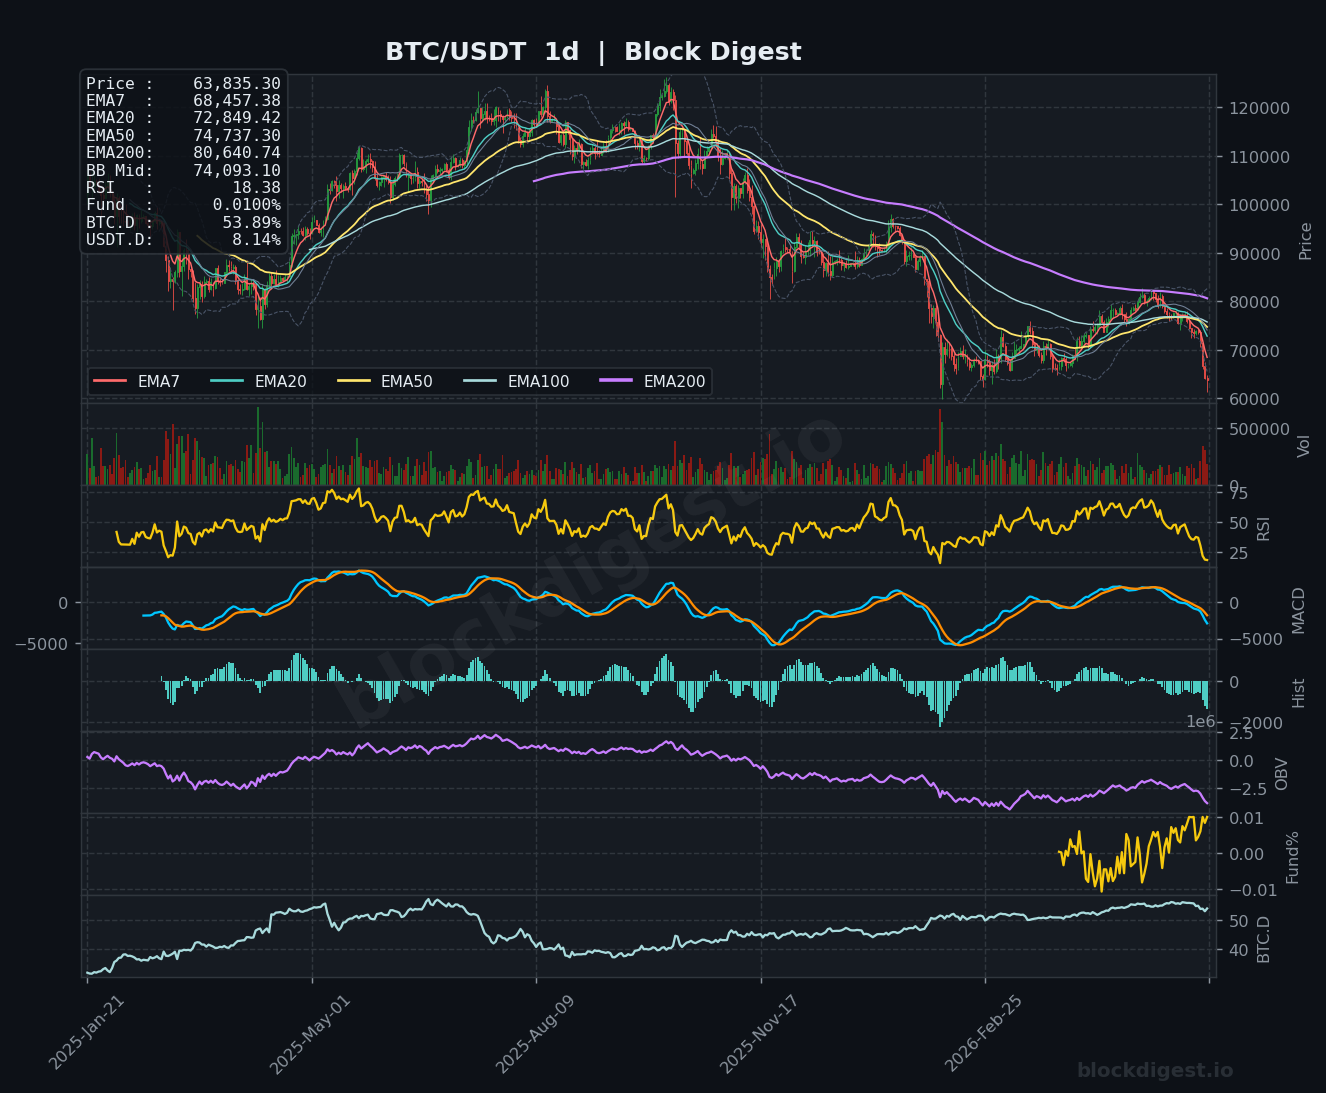
Bitcoin is trading at approximately $63,835–$63,855 across timeframes, having suffered a sharp multi-week decline from highs near $82,000. Price is currently trading well below all major EMAs on every timeframe — a textbook bearish alignment. On the daily chart, BTC sits beneath the EMA7 ($68,457), EMA20 ($72,849), EMA50 ($74,737), and EMA200 ($80,640), with price hugging the lower Bollinger Band (BB Mid: $74,093) — a structure that signals sustained distribution rather than a temporary pullback. The dominant daily trend is unambiguously bearish, with the selloff accelerating after losing critical support in the $75,000–$78,000 zone.
Multi-Timeframe Confluence
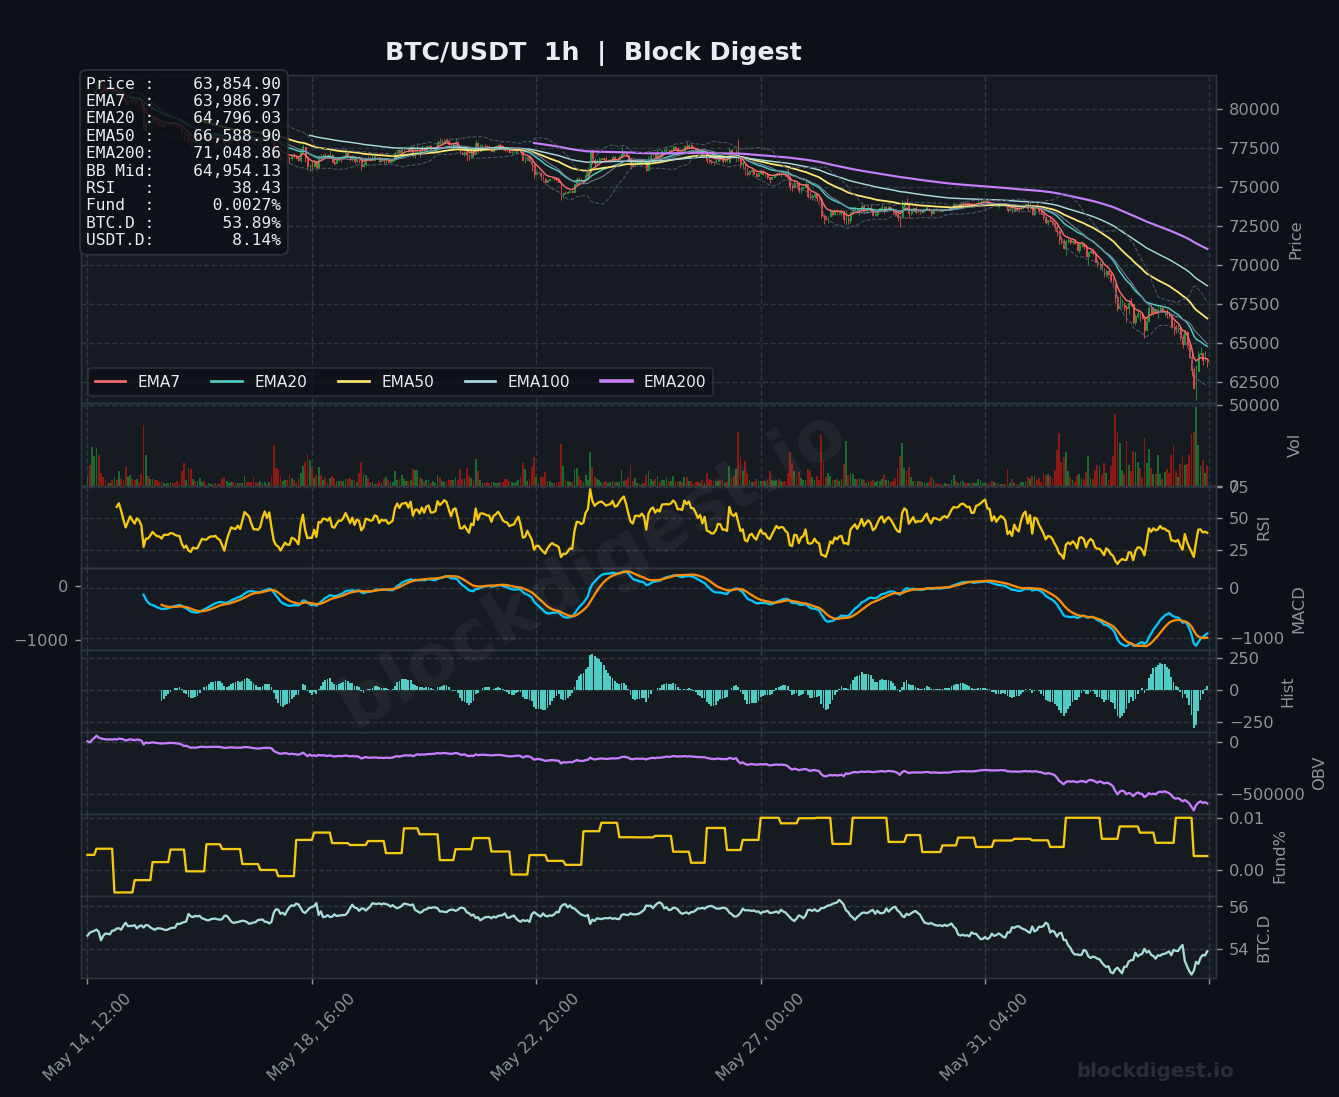
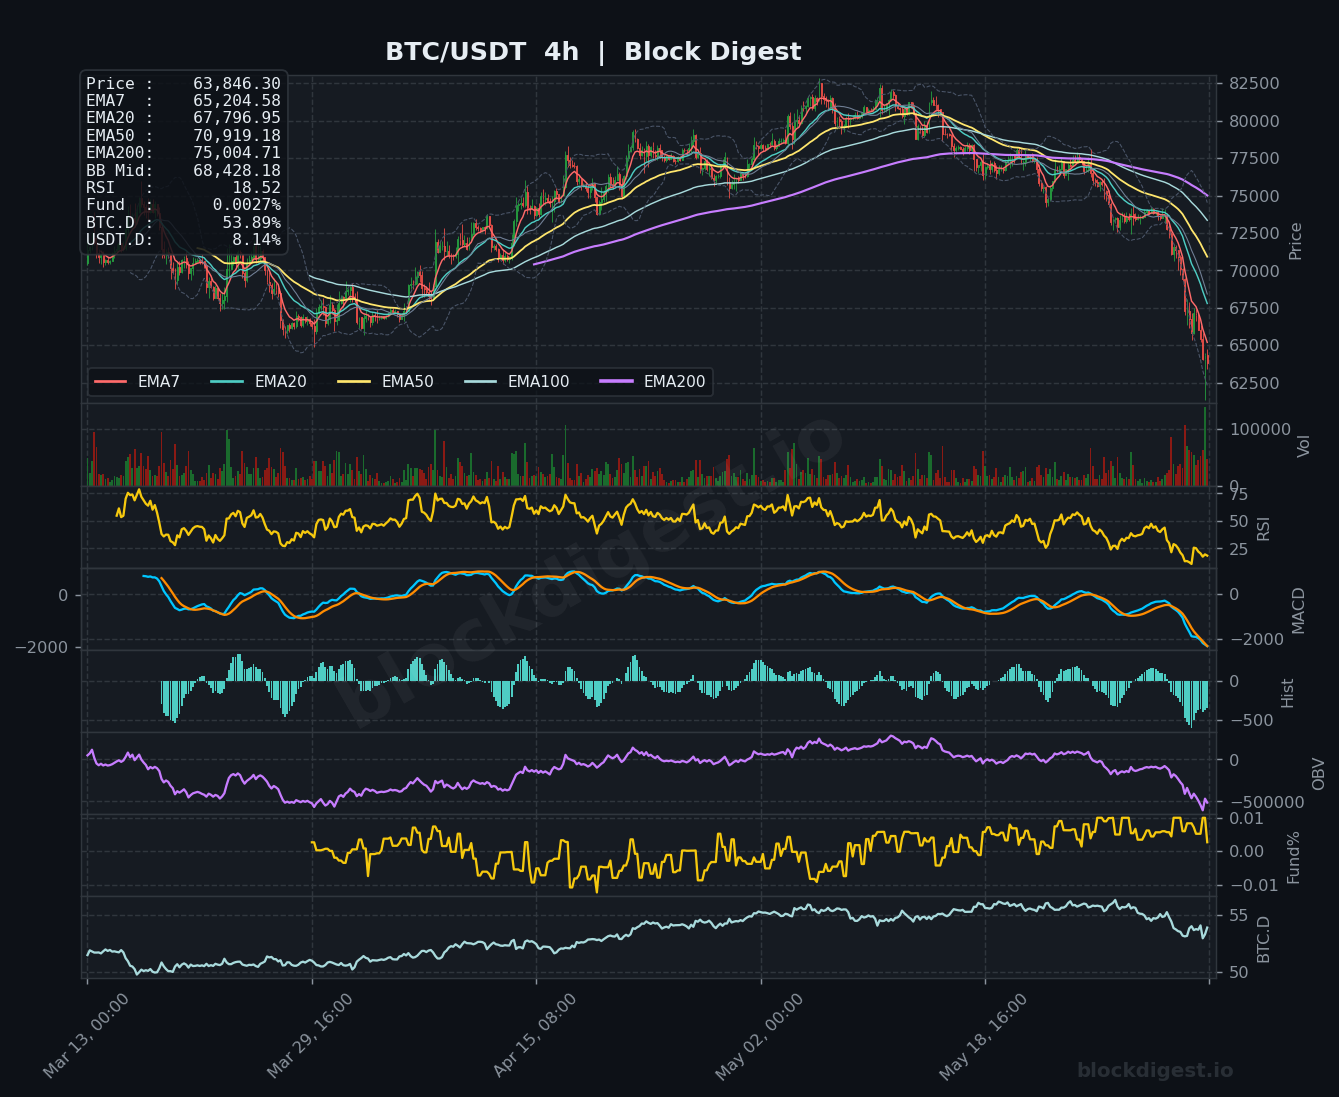
All three timeframes are in full bearish alignment, offering no meaningful divergence to suggest an imminent trend reversal. On the 1h chart, price trades below EMA7 ($63,987), EMA20 ($64,796), and EMA50 ($66,589), with the EMA200 at $71,049 acting as a distant macro ceiling. The 4h chart reinforces this structure, with EMA7 at $65,205 and EMA50 at $70,919 forming a stacked resistance cluster overhead, while the 4h BB Mid at $68,428 aligns with the 1h EMA200 — a confluent resistance zone in the $68,400–$71,000 range. Short-term momentum offers no credible counter-argument to the higher timeframe breakdown.
Key Levels to Watch
- Resistance: $65,200–$65,500 — confluence of 4h EMA7 and recent intraday supply zone; first major hurdle for any bounce attempt
- Resistance: $67,800–$68,430 — 4h EMA20 and 4h BB Mid overlap; this zone capped previous recovery attempts and would need to be reclaimed for any meaningful relief
- Resistance: $70,900–$71,050 — 4h EMA50 and 1h EMA200 confluence; reclaiming this level would materially shift the short-to-medium-term structure
- Support: $62,000–$62,500 — recent intraday swing low where price briefly dipped during the $1.5B liquidation cascade; a critical near-term floor
- Support: $59,000–$60,000 — psychological round number and prior structural support from earlier in the bull cycle; loss of $62,000 likely targets this zone
- Support: $56,500–$57,000 — deeper macro support corresponding to the 2024 post-halving consolidation range; a breach here would represent severe macro trend deterioration
Momentum & On-Chain Signals
RSI readings across all timeframes are deeply depressed: 38.43 on the 1h, 18.52 on the 4h, and 18.38 on the daily — the latter two registering extreme oversold conditions not frequently seen outside major capitulation events. While oversold RSI readings can precede short-covering bounces, the absence of bullish RSI divergence on the 4h and daily charts means these readings alone do not confirm a bottom. The MACD on all timeframes remains in deeply negative territory with bearish histogram expansion, particularly severe on the 4h where the MACD line is approaching -2,000. OBV across all timeframes trends decisively lower, confirming persistent distribution and a lack of meaningful accumulation — consistent with Citi’s observation that new buyer demand remains absent. The funding rate sits at a near-neutral +0.0027%, suggesting the liquidation flush has cleared most leveraged longs without flipping strongly negative, which reduces the probability of an imminent short-squeeze catalyst.
BTC Dominance & Market Sentiment
BTC Dominance sits at 53.89% — a level that has declined notably from recent highs, suggesting capital is not simply rotating into altcoins but rather exiting the broader crypto market into stablecoins or risk-off assets. USDT Dominance at 8.14% remains elevated, reflecting meaningful defensive positioning across the market. This combination — falling BTC.D alongside rising USDT.D — is a classically risk-off configuration, reinforcing the bearish macro backdrop and aligning with reports of capital rotation into gold and AI equities.
Risk Scenarios
- Bullish case: A decisive reclaim of $65,200 on meaningful volume, accompanied by a 4h RSI recovery above 30 and a funding rate flip into positive territory, would open a relief rally targeting the $67,800–$68,430 resistance cluster. Sustained follow-through above $68,430 would be required to challenge the broader bearish structure.
- Bearish case: Failure to hold the $62,000 swing low on a daily close would confirm continuation of the breakdown, with the next meaningful downside target at $59,000–$60,000 and an extended move potentially toward $56,500 if macro risk-off conditions intensify.
Outlook
The technical picture as of June 4, 2026 is unambiguously bearish across all timeframes, with BTC approximately 47% below its all-time high of $126,210 and showing no credible signs of structural reversal from chart indicators alone. The deeply oversold 4h and daily RSI readings warrant caution about aggressive short positions at current levels, as a technical bounce toward $65,200–$67,800 remains possible — particularly if funding rates normalize or spot demand re-emerges. However, with OBV in freefall, all major EMAs overhead, and macro headwinds (Fed rate cut uncertainty, AI/gold rotation) persisting, any bounce should be treated as a potential relief rally within a broader downtrend until proven otherwise. The critical level to watch in the next 24–48 hours is the $62,000 support; its defense or breach will define the near-term trajectory with high conviction.
Disclaimer: This analysis is for informational purposes only and does not constitute financial advice. Cryptocurrency markets are highly volatile and unpredictable. All trading decisions should be made based on your own research and risk tolerance. Block Digest is not responsible for any financial losses incurred as a result of acting on this content.