Ethereum Weekly Analysis: Ethereum Breaks Below $2,000 Resistance Level
Weekly Market Overview
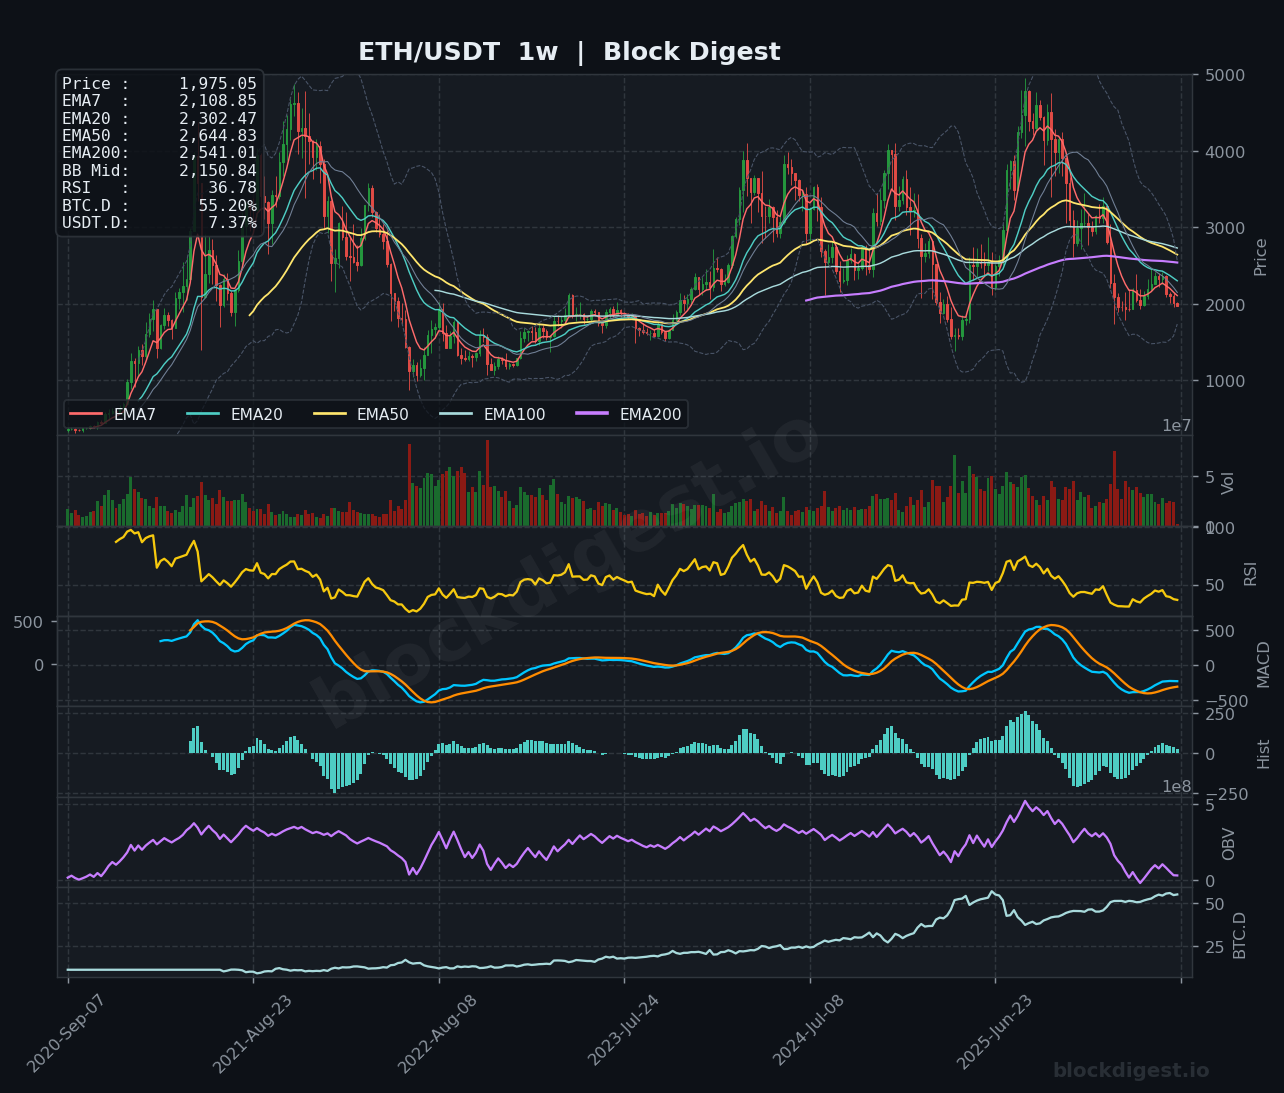
Ethereum closed the week trading just below the psychologically critical $2,000 level, with price printing at approximately $1,975 on the weekly chart — a level that has served as a pivotal macro reference point across multiple market cycles. The weekly candle reflects continued distribution pressure, extending a downtrend that began following the late 2025 cycle highs near $4,000. Price action has now lost the $2,000 handle convincingly, a development that compounds the bearish structure established over the past several months. The broader context is one of a market in a sustained corrective phase, with ETH having shed roughly 50% from its cycle peak, and the current consolidation offering little technical evidence of a trend reversal.
Higher Timeframe Structure
On the weekly chart, the EMA stack is in a deeply bearish configuration: price at ~$1,975 trades well below all major EMAs, with the EMA7 at $2,108, EMA20 at $2,302, EMA50 at $2,644, and EMA200 at $2,541. Notably, the EMA50 has crossed below the EMA200, forming a macro bearish cross that echoes the alignment seen during the 2022 bear market drawdown, a structurally significant signal for longer-term participants. The weekly Bollinger Band midline sits at $2,150, which now acts as dynamic resistance, and price is hugging the lower Bollinger Band — a sign of sustained selling pressure rather than a mean-reversion setup. The weekly RSI at 36.78 is approaching oversold territory but has not yet reached the extreme lows (~25-30) that historically coincided with cycle bottoms for ETH on this timeframe.
Multi-Timeframe Confluence
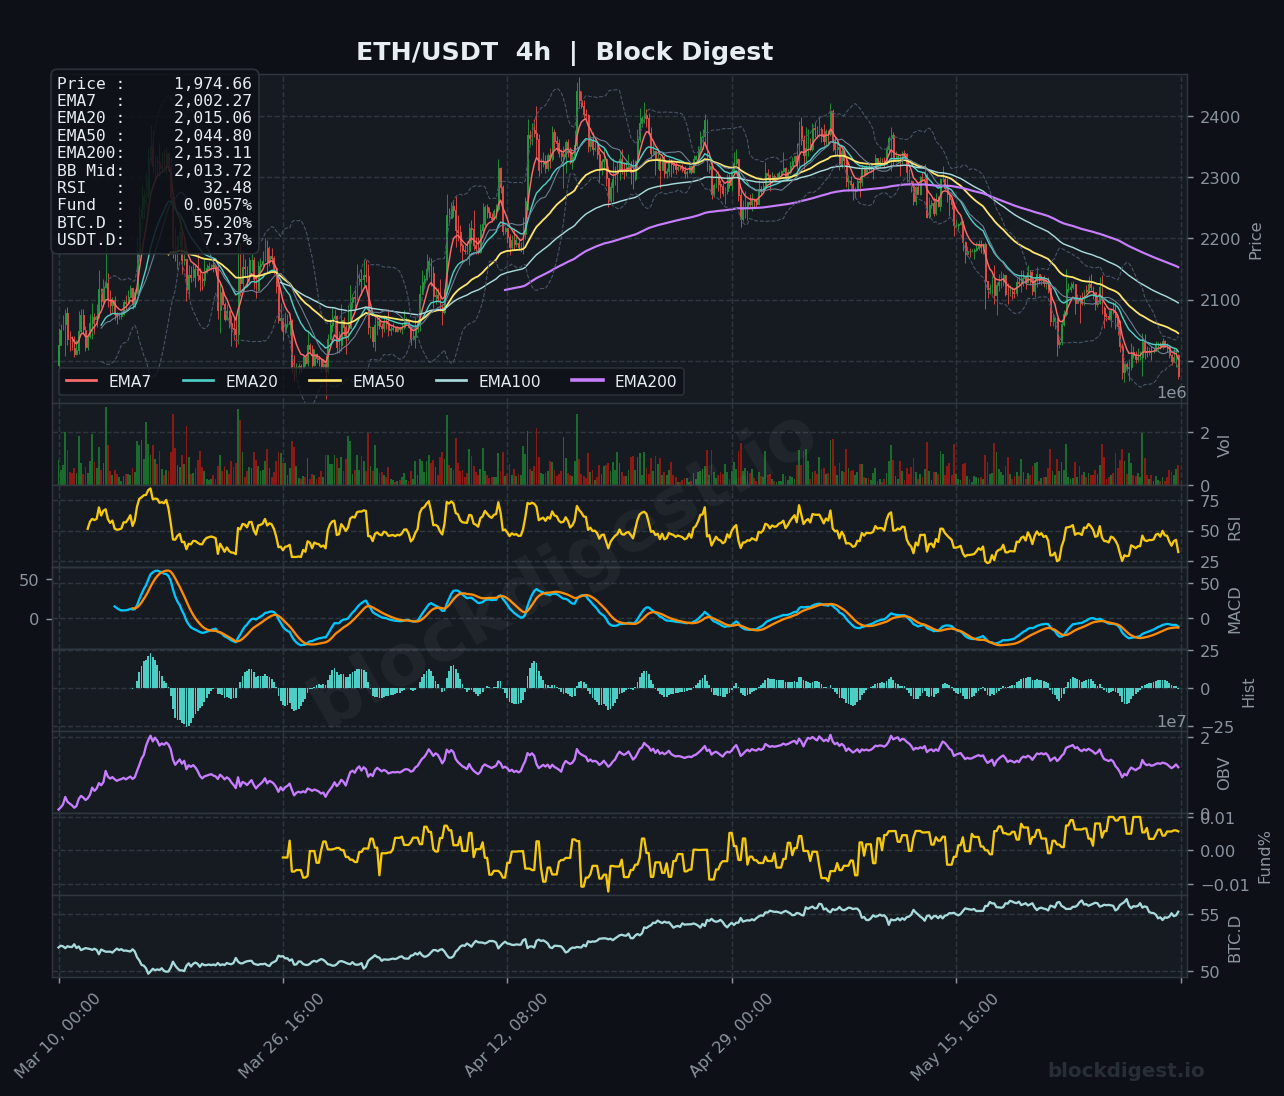
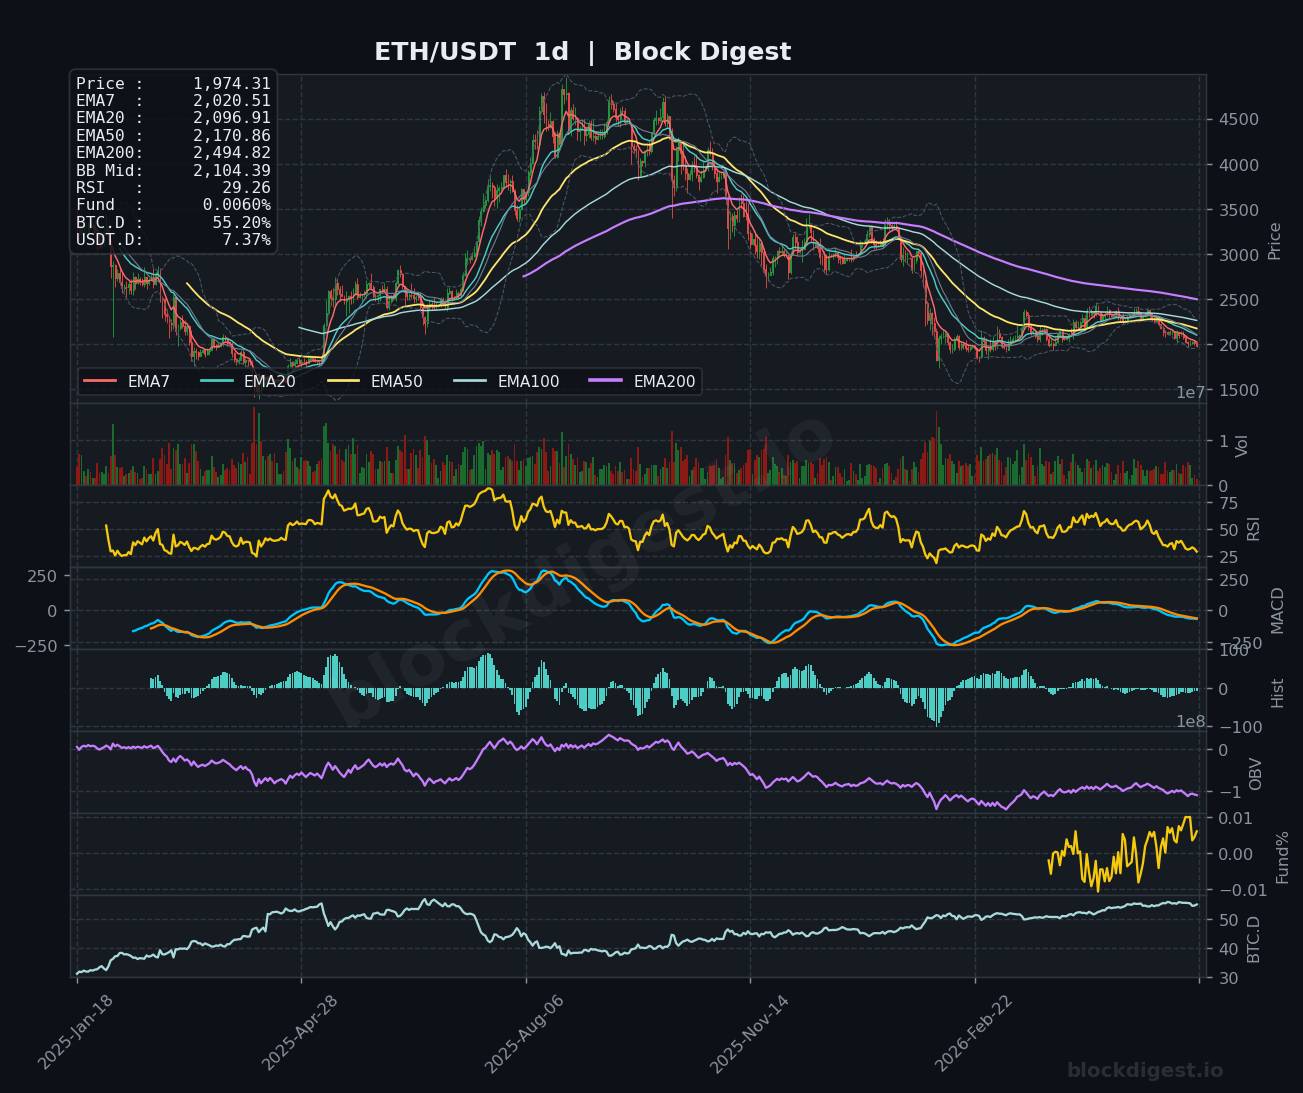
Across all three timeframes, the bearish structure is consistent and reinforcing. On the daily chart, price is trading beneath all major EMAs — EMA7 at $2,020, EMA20 at $2,096, EMA50 at $2,170, and EMA200 at $2,494 — forming a full bearish cascade with no sign of compression or bullish reclaim. The 4-hour chart echoes this alignment precisely, with the EMA200 at $2,153 acting as the ceiling for any intraweek bounces, and each attempt to reclaim the $2,000–$2,050 zone has been faded. The confluence of the $2,000 psychological level, the daily Bollinger Band midline (~$2,104), and the descending 4H EMA cluster between $2,002–$2,044 creates a densely stacked resistance zone that the market must meaningfully close above before any recovery thesis gains traction.
Key Weekly Levels
- Weekly Resistance:
- $2,100–$2,150 — Confluence of weekly BB midline ($2,150), daily EMA20 ($2,096), and descending 4H EMA50; the most critical near-term ceiling
- $2,300–$2,350 — Weekly EMA20 ($2,302) and prior horizontal consolidation zone; a reclaim here would shift intermediate-term bias
- $2,500–$2,541 — Weekly EMA200 ($2,541) and EMA50 ($2,644) zone; a return to this area would represent full trend recovery
- Weekly Support:
- $1,975–$2,000 — Current price level; psychological round number and lower weekly Bollinger Band; loss of this level on a weekly close opens further downside
- $1,750–$1,800 — Prior consolidation zone from the 2023 recovery structure and a historically significant demand region visible on the weekly chart
- $1,500–$1,550 — Deep macro support corresponding to mid-cycle lows; would represent a near full retracement of the 2023–2024 rally leg
Momentum & Volume Analysis
The weekly RSI at 36.78 is in the lower range of its historical band, approaching but not yet confirming a capitulation-level oversold reading — previous weekly cycle lows saw RSI dip toward the 28–32 zone before meaningful reversals materialized. The weekly MACD remains in negative territory with both signal and MACD lines below zero, and the histogram, while showing modest compression, has not yet produced a bullish cross — momentum is bearish with no confirmed inflection. On the daily chart, the RSI has reached 29.26, technically oversold, which does offer a short-term mean-reversion argument, but the 4H RSI at 32.48 and the declining OBV across both the daily and 4H timeframes confirm that volume is not accumulating at current levels — sellers remain in control. The funding rate currently sits at a modestly positive 0.0057%–0.0060%, which is near neutral and suggests the market is not yet in the heavily negative-funding, short-squeeze setup that historically precedes sharp relief rallies; positioning is cautious but not decisively contrarian.
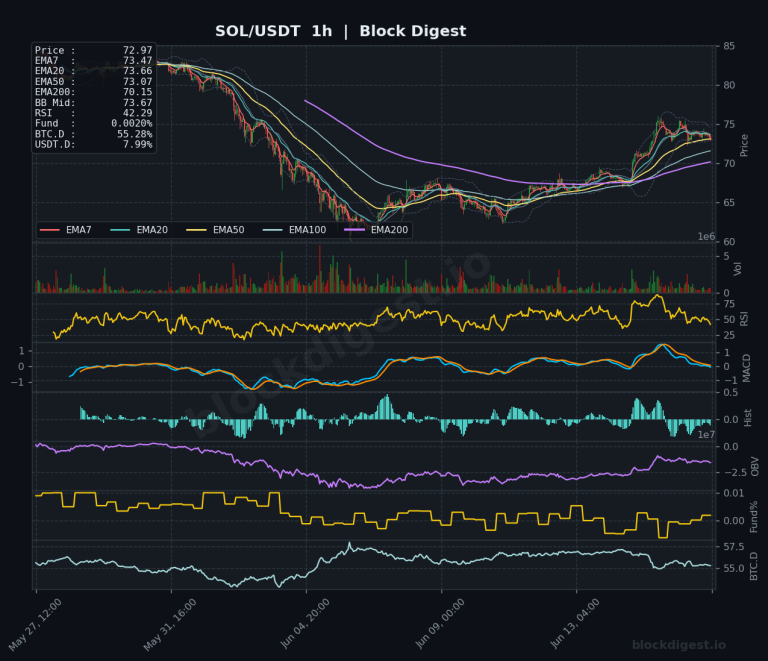
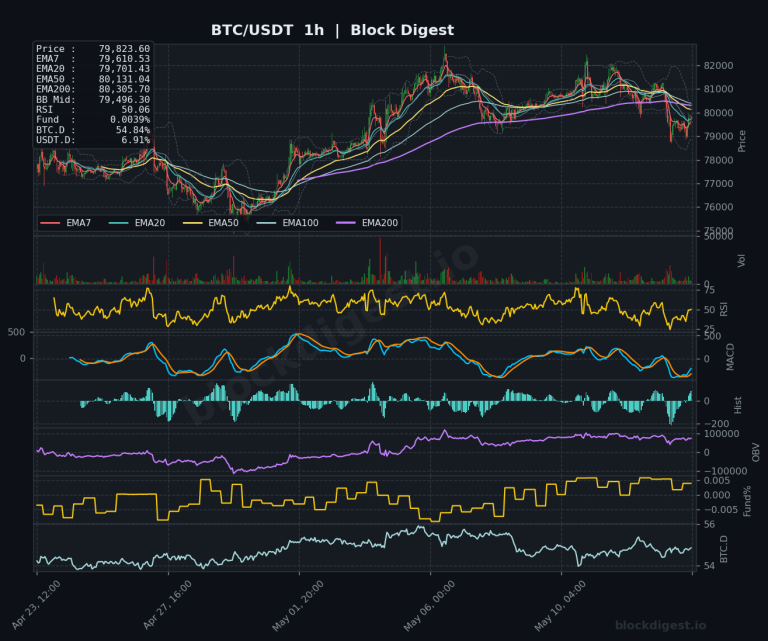
BTC Dominance & Altcoin Implications
BTC dominance (BTC.D) is currently at 55.20% and the weekly chart shows it trending steadily higher from lows near 38% in late 2024 — this persistent uptrend in dominance is a structural headwind for ETH and the broader altcoin market, signaling that capital rotation out of Bitcoin and into altcoins has not yet commenced. USDT.D at 7.37% reflects elevated cash-on-the-sidelines positioning, which could eventually provide fuel for a relief rally, but until BTC.D shows a confirmed rollover from this elevated level, ETH is unlikely to outperform. The sustained dominance trend reinforces the view that ETH’s underperformance relative to Bitcoin is a structural rather than cyclical phenomenon at this stage of the market cycle.
Risk Scenarios
- Bull case: A daily and weekly close back above $2,050–$2,100 — reclaiming the 4H EMA cluster and the daily BB midline — would be the minimum requirement to suggest a near-term recovery is underway, with an initial target toward the $2,300 weekly EMA20. A broader catalyst, such as U.S. regulatory clarity via the CLARITY Act or a surprise resumption of ETH ETF inflows, could accelerate a move back toward the $2,500 EMA200 zone over a multi-week horizon, especially given the daily RSI deeply in oversold territory suggesting a snapback is technically overdue.
- Bear case: Failure to hold $1,975 on a weekly closing basis opens the door to a swift move toward the $1,750–$1,800 support zone, with continued ETF outflows and a risk-off macro environment providing the catalysts. A sustained break below $1,750, particularly if accompanied by rising BTC dominance and dollar strength, would put the $1,500 deep macro support level firmly in scope and validate the thesis that ETH is tracing out a bear market structure analogous to 2022.
Weekly Outlook
Ethereum enters the week of June 1, 2026 at a technically precarious juncture, trading below the $2,000 threshold with every major EMA acting as overhead resistance and a bearish EMA structure entrenched across all three timeframes. The directional bias for the week ahead is cautiously bearish, though the daily RSI’s extreme oversold reading (29.26) and neutral funding rates introduce a non-trivial probability of a short-term dead-cat bounce toward the $2,050–$2,150 zone before resuming the downtrend. The critical level to watch is a sustained daily close above $2,100 — without this, any bounce should be treated as a relief rally within a broader bearish structure rather than a trend reversal. Key catalysts to monitor include any developments around U.S. crypto regulation (CLARITY Act progress), Federal Reserve communication on rate policy, and weekly ETF flow data which has been a primary driver of institutional sentiment. Until BTC dominance peaks and rolls over, and ETH/USDT can reclaim the $2,300–$2,500 region with volume conviction, the path of least resistance remains downward, with risk/reward skewed toward protection over aggressive long positioning.
Disclaimer: This analysis is for informational purposes only and does not constitute financial advice. Cryptocurrency markets are highly volatile and unpredictable. All trading decisions should be made based on your own research and risk tolerance. Block Digest is not responsible for any financial losses incurred as a result of acting on this content.