
daily analysis
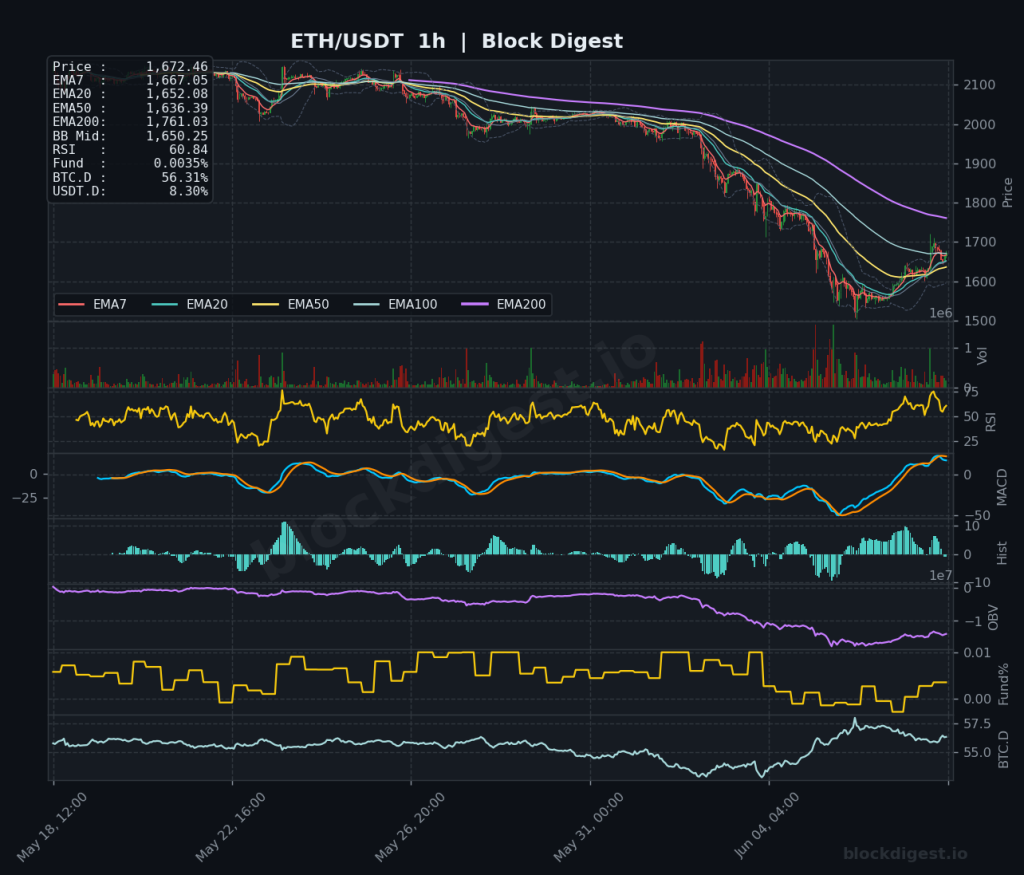
Ethereum Daily Analysis: ETH at $1,672 Below All Major EMAs
Market Overview ETH/USDT is currently trading at $1,672.46, caught in a protracted downtrend that has seen price shed significant value from highs above $4,000 on the daily timeframe. Price remains decisively below all major EMAs on the daily chart — EMA7 at $1,723.40, EMA20 at $1,895.68, EMA50 at $2,057.32, and EMA200 at $2,441.89 — confirming...
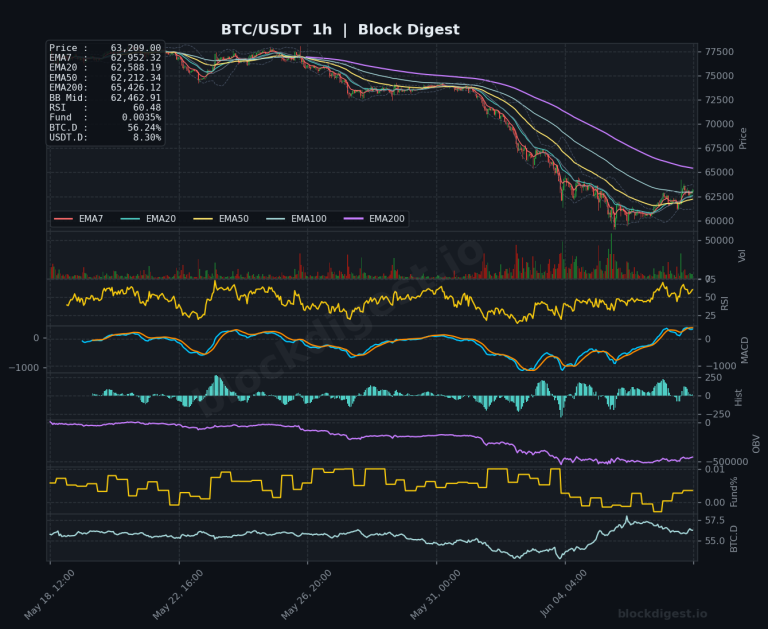
Bitcoin Daily Analysis: Bitcoin at $63K Below All Major EMAs
Market Overview Bitcoin is currently trading around $63,210, sitting approximately 51% below its all-time high of $126,210 reached in early October 2025, reflecting an extended macro downtrend that has steadily eroded value over the past eight months. On the daily timeframe, price remains firmly beneath all major EMAs — the EMA7 at $64,331, EMA20 at...

Ethereum Daily Analysis: ETH Deep Below EMA200 and Bollinger Midline
Market Overview ETH/USDT is currently trading at $1,611.63, deep in bearish territory across all major timeframes. Price sits well below its daily EMA200 ($2,448.78), EMA50 ($2,069.96), and EMA20 ($1,911.73), confirming a structurally damaged downtrend that has been in place since late 2025. On the daily chart, price is also trading significantly beneath the Bollinger Band...
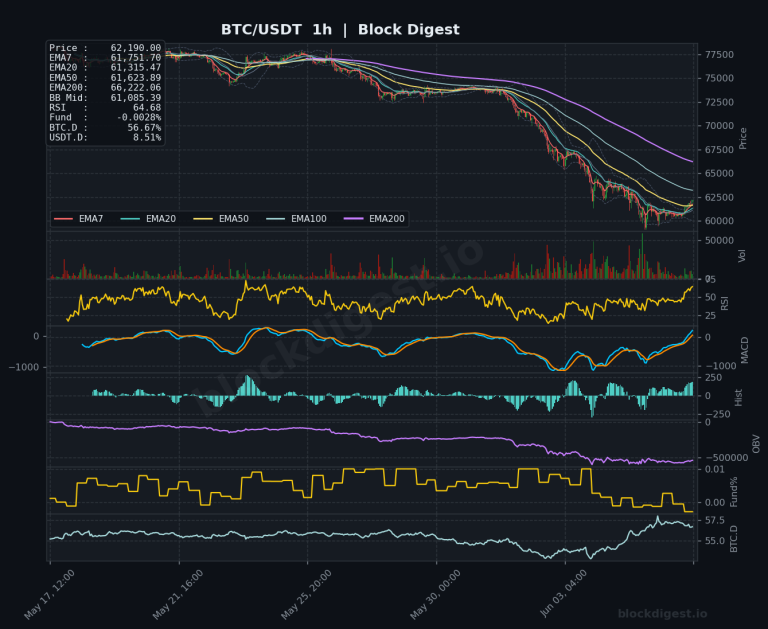
Bitcoin Daily Analysis: Bitcoin Below All Major EMAs, Distribution Phase Ongoing
Market Overview Bitcoin is currently trading at $62,194, positioned well below all major daily EMAs — the EMA7 at $64,421, EMA20 at $69,879, EMA50 at $73,226, and EMA200 at $80,062 — painting a structurally bearish picture across the higher timeframe. Price is also trading significantly beneath the daily Bollinger Band midline of $71,672, suggesting the...
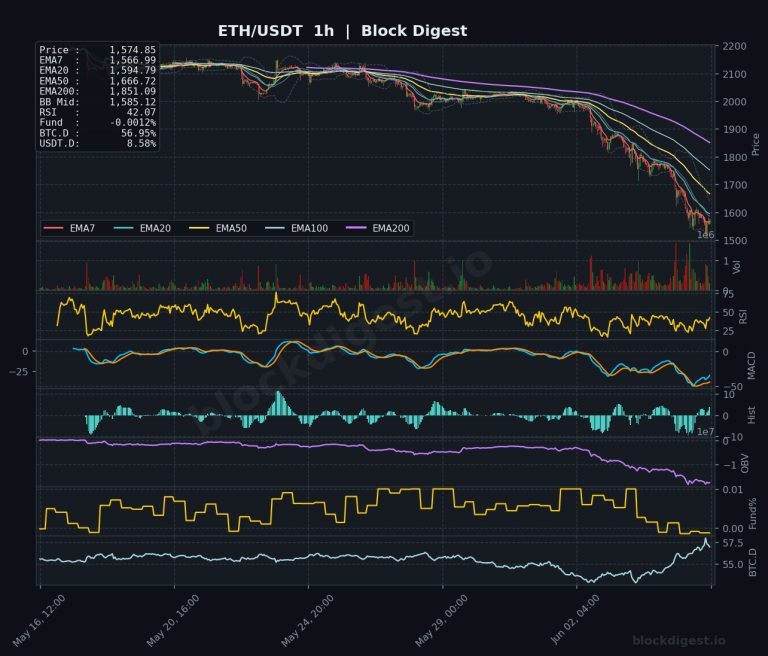
Ethereum Daily Analysis: Ethereum at 13-Month Low Below All Moving Averages
Market Overview Ethereum is trading at $1,574.99 as of June 6, 2026, deep in bearish territory and printing a 13-month low as the latest leg of selling pressure accelerates. Price is trading well below every major moving average across all timeframes — the daily EMA7 sits at $1,758.89, EMA20 at $1,943.94, EMA50 at $2,088.93, and...
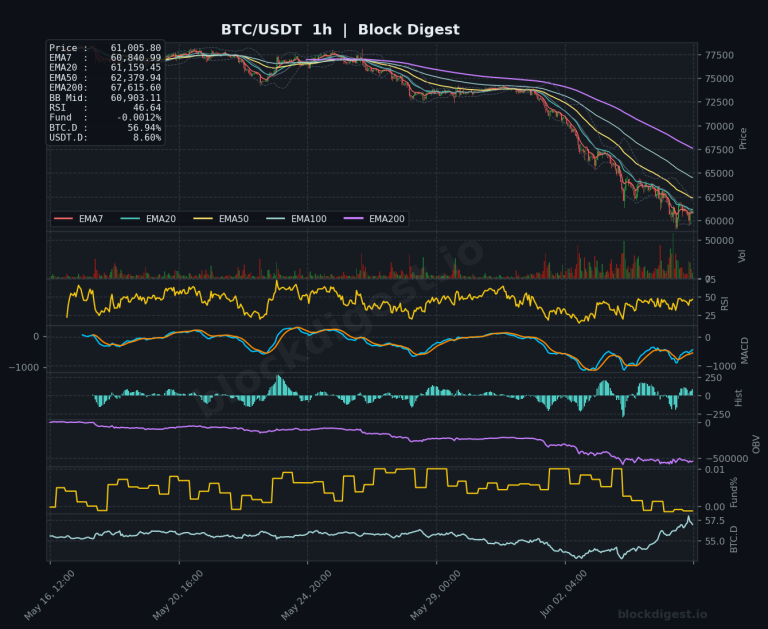
Bitcoin Daily Analysis: Bitcoin at $61K, Below All Major EMAs
Market Overview Bitcoin is trading at approximately $61,005 after suffering a sharp multi-week decline from its recent highs above $73,000, representing a loss of roughly 16% over the past week alone — well off its all-time high of $126,210 set last October. On the daily timeframe, price is trading significantly below all major EMAs: the...
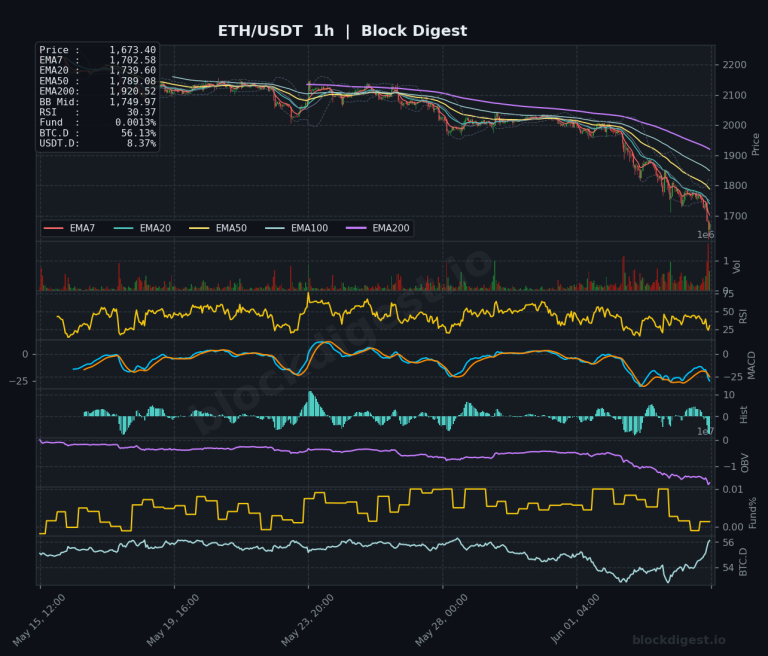
Ethereum Daily Analysis: ETH Plunges Below All Major EMAs at $1,673
Market Overview ETH/USDT is trading at $1,673.76, deep in bearish territory and printing multi-month lows as sellers maintain full control across all timeframes. Price is trading well below every major EMA on the daily chart — the EMA7 at $1,843.04, EMA20 at $1,991.49, EMA50 at $2,113.49, and the EMA200 at $2,466.58 — confirming a sustained...
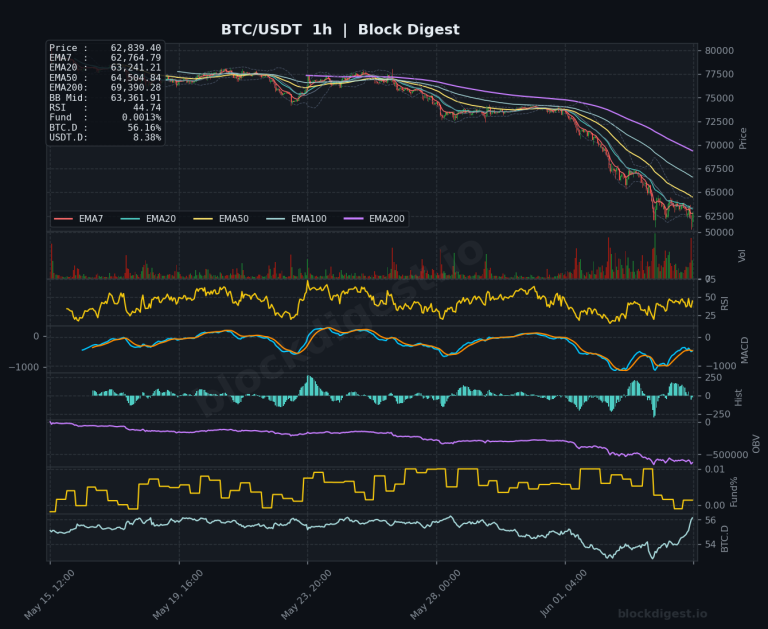
Bitcoin Daily Analysis: Bearish EMA Stack Confirmed Below $62,835
Market Overview Bitcoin is trading at approximately $62,835 as of June 5, 2026, deep in bearish territory following a sharp multi-week selloff that erased gains accumulated since early 2026. Price is trading well below all major EMAs on the daily timeframe — the EMA7 at $67,055, EMA20 at $71,897, EMA50 at $74,271, and the EMA200...
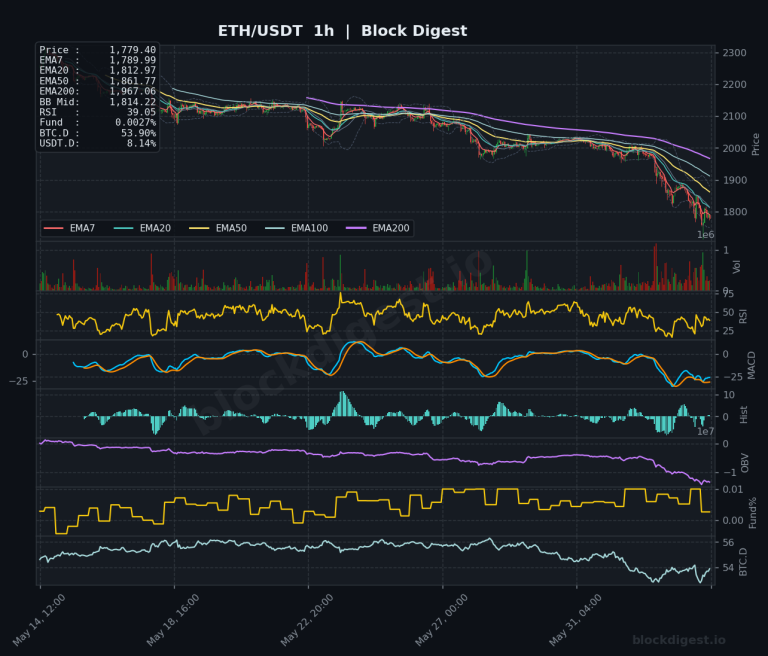
Ethereum Daily Analysis: Ethereum Drops 12% Below EMA7 at $1,778
Market Overview Ethereum is trading at approximately $1,778–$1,779 as of June 4, 2026, extending a sharp multi-week decline that has pushed price well below all key daily EMAs. The daily chart paints a distinctly bearish macro picture: ETH sits approximately 12% below the EMA7 ($1,901.66), 14% below the EMA20 ($2,025.77), and an alarming 28% below...
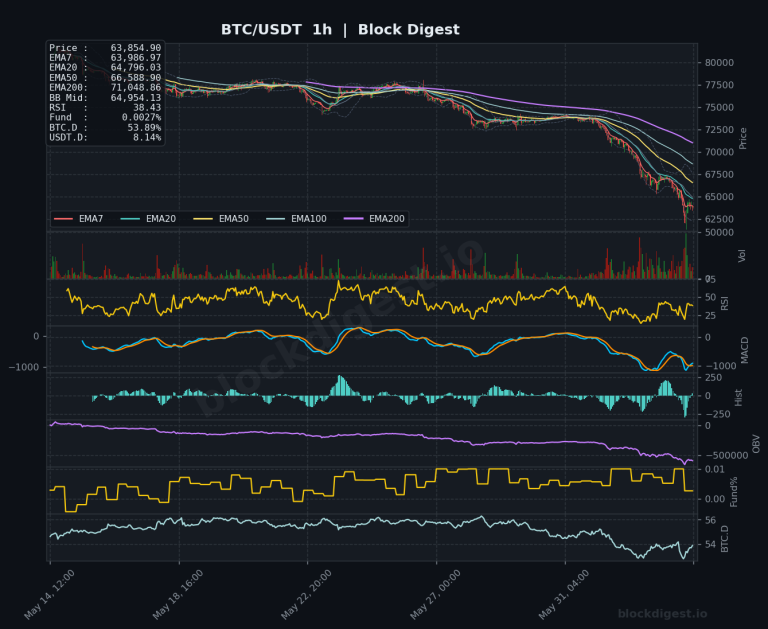
Bitcoin Daily Analysis: BTC at $63.8K, Below All Major EMAs
Market Overview Bitcoin is trading at approximately $63,835–$63,855 across timeframes, having suffered a sharp multi-week decline from highs near $82,000. Price is currently trading well below all major EMAs on every timeframe — a textbook bearish alignment. On the daily chart, BTC sits beneath the EMA7 ($68,457), EMA20 ($72,849), EMA50 ($74,737), and EMA200 ($80,640), with...

Ethereum Daily Analysis: ETH Falls Below Key EMAs at $1,878
Market Overview ETH/USDT is trading at $1,878.84–$1,878.95 as of June 3, 2026, extending a sharp multi-week decline that has pushed price well below all major exponential moving averages on every timeframe. On the daily chart, ETH sits beneath the EMA7 ($1,959.26), EMA20 ($2,058.10), EMA50 ($2,148.80), and the EMA200 ($2,482.58), confirming a deeply bearish macro structure....
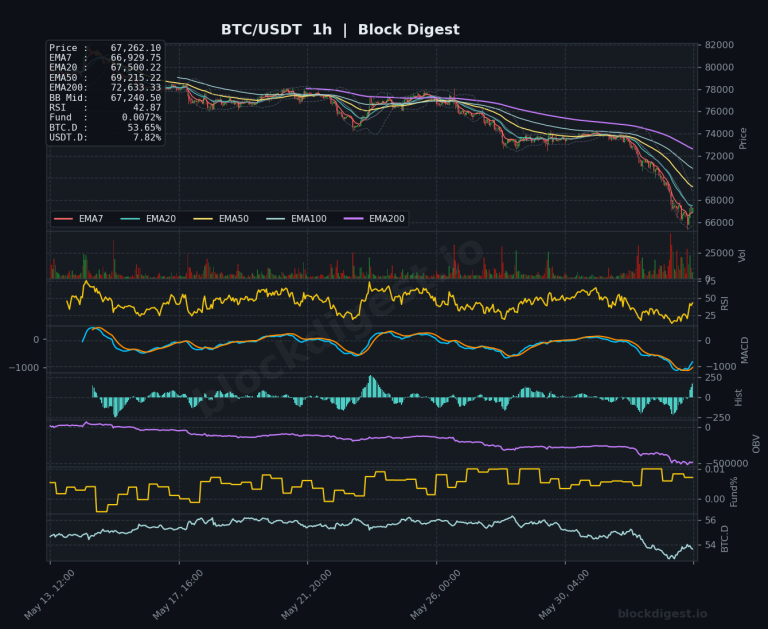
Bitcoin Daily Analysis: Bitcoin Breaks Below Key EMAs at $67,262
Market Overview Bitcoin is trading at approximately $67,262 as of June 3, 2026, down roughly 7% over the past 24 hours and sitting well below all key exponential moving averages across the daily timeframe. On the 1D chart, price has broken decisively beneath the EMA7 ($70,785), EMA20 ($74,098), EMA50 ($75,305), and EMA200 ($80,814), confirming a...